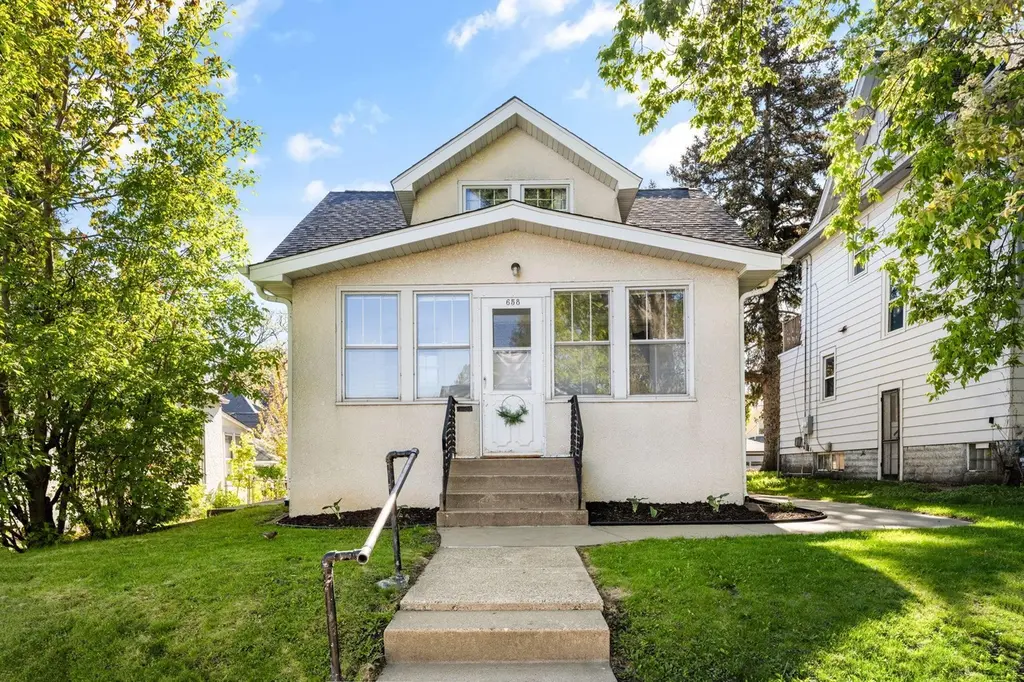
658 Smith Ave S · St. Paul, MN
Flood risk 1/10 · Minimal
- FEMA flood zone
- X (unshaded)
- Chance of flooding over 30 yrs
- 0.0%
- Est. flood insurance / yr
- $473 – $860
Fire risk 1/10 · Minimal
- Est. fire insurance / yr
- $888 – $1,650
Heat risk 2/10 · Minimal
- Hot days now (above 100°F)
- 7 days/yr
- Hot days in 30 yrs
- 14 days/yr
Wind risk 2/10 · Minimal
- Chance of severe wind over 30 yrs
- —
Air-quality risk 2/10 · Minimal
- Unhealthy air days now
- 1 days/yr
- Unhealthy air days in 30 yrs
- 1 days/yr
Risk factors via First Street. Map © Google.
Why this score? — see what drove the D grade
The composite is a weighted blend of 9 inputs, each scored 0–100. Each bar is that input's sub-score; the figure is the points it added to the 100-point composite (weight × sub-score).
- Cash flow +13.0/30.0
- ARV discount +10.6/15.0
- Rent growth +5.0/5.0
- DSCR +3.9/10.0
- 1% rule +3.4/10.0
- Livability +2.5/5.0
- Condition / age +2.5/5.0
- Schools +2.4/10.0
- Appreciation +0.0/10.0
$300,000
🖨 Deal sheet 📄 Offer letter ✓ Due diligence
Listing remarks
Classic St. Paul charm with timeless character close to downtown, parks and trails. Step inside to discover stunning original woodwork and rich refinished hardwood floors that flow throughout the home, creating a cohesive and inviting feel. The front sitting room offers a cozy space to relax and welcome guests. It would also make an incredible home office. The formal living and dining rooms provide the perfect setting for entertaining and every day life. The dining room features a built-in hutch with leaded glass details, adding both character and functional storage. The woodwork everywhere is in stunning condition. The updated kitchen blends classic style with modern convenience, complete
Key facts
- Quartz countertops
- Updated kitchen
- Built-in hutch
Tags
Property features AI
Finance
- Other: Lot dimensions approximately 38 x 115; Lot size approximately 4,370 square feet; Publicly maintained road
Exterior
- Parking: 2-car garage
- Utilities: City water connected; City sewer connected; Natural gas
- Home design: Residential property; One story (with upper-level bedroom); Block foundation; Facing and entry level not specified
- Construction: Asphalt roof, 8 years old or newer; Block foundation; Built features include above- and below-grade finished areas
- Exterior features: Enclosed patio/porch and front porch; Stucco exterior; Partial wood fencing; Light tree coverage; Public transit within six blocks; City street with curbs, paved streets and sidewalks
Interior
- Kitchen: Kitchen window; Stainless steel appliances; Range; Refrigerator
- Bedrooms: 3 bedrooms total; One bedroom on the upper level; Other bedrooms on the main level
- Flooring: Hardwood floors
- Bathrooms: One full bathroom on the main floor
- Heating & cooling: Hot water heating; Window air conditioning units
- Interior features: Ceiling fans; Hardwood floors; Natural woodwork; Patio; Porch; Separate/formal dining room; Main floor bedroom
- Laundry & utility: Washer and dryer included; Washer/dryer hookup in unit; Laundry located in the basement
Neighborhood map
What this means for you Summary
Snapshot
- This is a 3-bed/1.0-bath single-family listed at $300k.
Deal economics
- At list price, monthly cash flow is $-15 ($-178/yr) — negative.
- To cash-flow at today's rent, offer at most $297k (0.9% below list).
- To meet the 1% rule (rent ≥ 1% of price), the offer needs to be $251k (16.2% below list).
- Recommended offer: $251k (16.2% below list) — sets the bar for 1% rule.
Location & tenants
- Location reads: area grade D — affects rentability + tenant quality, not the cash-flow math above.
- St. Paul Public School District (urban): math 21% / reading 33% proficiency, ranked #270 of 301 in MN (top 90%) — low school quality limits family demand, transient renter base, plan for 1-2y turnover; 64% free/reduced lunch — lower-income household profile, screen leases tightly.
- Market conditions: Rents rising fast (+10.8%/yr); 64 active listings in the ZIP; 7 comparable units currently listed for rent nearby; rentals leasing fast (median 3d on market — plan ~1-2 weeks tenant-placement turnaround); 1,202 units permitted in Ramsey County in 2024 (880 in 5+ unit buildings).
- This rent runs 40% of the median local income ($75k/yr) — at the standard rent-burdened threshold; future hikes will face affordability resistance.
Forward outlook
- Local home prices are declining (-3.0%/yr); year-one equity from $2k of loan paydown is wiped out by about $9k of value loss. Plan a longer hold.
- Ramsey County population projected at +27% by 2050 — long-run rental-demand tailwind backs the buy-and-hold thesis.
Negotiation context
- Only 14 days on market — expect competitive offers; lowballing is unlikely to land.
- 2 sale attempts with the ask held roughly flat each time — persistent listings suggest the price (not the market) is what's stuck; bring a comps-based counter.
- Current owner paid $225k; 33% above their basis — modest negotiation headroom, anchor on the comps not their cost.
Risks & watch-outs
- Watch-outs: built in 1914 — expect roof / HVAC / electrical / plumbing capex.
Questions for the listing agent
- What do current leases actually rent for vs. the listed asking? Can we see a recent rent roll and the last 12 months of T-12 income?
- Built in 1914 — when were the roof, HVAC, electrical panel, plumbing, and water heater last replaced?
- Is there a deadline driving the sale (1031 exchange, divorce, estate, relocation)? That informs how much negotiation room exists.
- The area grade is low — what's the realistic commute time and amenity access for the typical tenant pool here? Any planned neighborhood developments (good or bad) we should know about?
- What's the average days-on-market for RENTAL listings here right now (not sales)? A rising rental-DOM trend means longer vacancies and softer asking-rent achievability than the comps imply.
- What's the recent tenant-quality profile in this submarket — average credit score on applications, eviction rate, late-payment / NSF rate, and stable-employment percentage? A property-management company in the area should have these aggregated.
- How much new for-sale + rental construction is in the pipeline within 1–3 miles? Heavy new supply typically softens prices + rents 12–24 months out; constrained supply supports both.
Investment metrics
- 1% rule
- 0.84% ✗
- Cap rate
- 6.23%
- Cash-on-cash
- -0.21%
- DSCR
- 0.99
- GRM
- 9.9
CMA / ARV
- ARV (median comp)
- $322,405
- List price
- $300,000
- Delta
- -6.95%
- Verdict
- FAIR
- Comps
- 5 within 1.0 mi
Projected returns pro-forma
-3.0% appreciation · 8.0% rent growth · sell at horizon
- IRR
- -11.4%
- Equity multiple
- 0.57×
- Total profit
- $-36,287
- Equity at exit
- $44,731
- IRR
- 3.7%
- Equity multiple
- 1.33×
- Total profit
- $27,593
- Equity at exit
- $25,939
Cash invested: $84,000 (down + closing). Projections, not guarantees.
Landlord ↔ Tenant lean methodology
- Overall (STATE)
- 46 Balanced
- State Minnesota
- 46 Balanced · D+2
- County
- — inherits STATE
- City
- — inherits STATE
ZIP-level market 55107
- Home prices YoY
- -16.2%
- Rents YoY
- 10.8%
- Active inventory
- 64
- Price-to-rent
- 9.9×
Monthly cashflow live
- Estimated rent
- $2,513 high interval (Pro) →
- Mortgage (P&I)
- −$1,573
- Tax from tax record
- −$302 /mo · $3,620/yr
- Insurance
- −$125
- HOA
- −$0
- Vacancy / Maint / Mgmt
- −$528
- Net cashflow
- $-15
Break-even live
UW: 25.0% down · 7.5% · 30yr · 1.5% tax · 5.0% vac · 8.0% maint · 8.0% mgmt
Financing live
Cash to close
- Down payment
- $75,000
- Closing costs
- $9,000
- Reserves months
- —
- Total cash needed
- —
Loan-product check · same deal, 3 products live
Conventional
25% down · 7.5% · 30yr
- Down + closing
- —
- Monthly P&I
- —
- Monthly cashflow
- —
- DSCR
- —
- Eligible?
- —
Personal DTI + credit; lowest rate.
DSCR
20% down · 8.5% · 30yr
- Down + closing
- —
- Monthly P&I
- —
- Monthly cashflow
- —
- DSCR
- —
- Eligible?
- —
No personal income docs; deal must DSCR.
Hard money
10% down · 12.0% · 12mo
- Down + closing
- —
- Monthly P&I
- —
- Monthly cashflow
- —
- DSCR
- —
- Eligible?
- —
Short-term bridge; refi at stabilization.
Rent comps 7 comps
| Address | Beds | Baths | Sqft | Rent | $/sqft | DOM | Units | Dist |
|---|---|---|---|---|---|---|---|---|
| 140 Belvidere St W Unit 1 St Paul, MN | 2.0 | 1.0 | 1600 | $1,650 | $1.03 | 2d | 1 | 0.58mi |
| 380 Randolph Ave Saint Paul, MN | 2.0 | 1.0–2.0 | 753 | $2,946 | $3.91 | 1d | 18 | 0.71mi |
| 400 Spring St Saint Paul, MN | 1.0–2.0 | 1.0–2.0 | 1205 | $3,275 | $2.72 | 3d | 31 | 0.72mi |
| 993 Robert St S Saint Paul, MN | 2.0 | 2.0 | 1214 | $1,765 | $1.45 | 5d | 1 | 1.23mi |
| 45 Butler Ave E Saint Paul, MN | 1.0–3.0 | 1.0–2.0 | 1040 | $1,682 | $1.62 | 1d | 12 | 1.34mi |
| 253 Kellogg Blvd W Saint Paul, MN | 2.0 | 1.0–2.0 | 1208 | $3,198 | $2.65 | 2d | 12 | 1.37mi |
| 111 Kellogg Blvd E Saint Paul, MN | 3.0 | 1.0–2.0 | 1000 | $2,783 | $2.78 | 1d | 20 | 1.49mi |
Listing history 3 events
-
2026-05-12historical Contingent - Inspection
-
2026-05-07$300,000 Active
-
2023-07-24soldstatus $225,000
ⓘ Source: listings_history table (triggers on properties + properties_extension) + one-shot
backfill from property_details.listing_events for pre-trigger history.
Tax reassessment forecast MN · Partial reset (capped growth)
- Current annual tax
- $3,620 · $302/mo
- Projected year-2 tax
- $3,620 · $302/mo
- Expected delta
- $0/yr ($0/mo · 0.0%)
ⓘ Screening estimate from a state-policy table — verify with the county assessor before closing.
Climate risk First Street
- Flood 1/10 Low FEMA zone X (unshaded) · 0% chance over 30 yrs
- Wildfire 1/10 Low
- Heat 2/10 Low 7 d/yr ≥100°F today · 14 d/yr by 30 yrs out
- Wind 2/10 Low
- Air quality 2/10 Low 1 unhealthy d/yr today · 1 by 30 yrs out
Nearby sold comps map
Loading sold comps map…
Walkable amenities ~0.75 mi
Loading nearby amenities…
Taxation est. · year 1
- Rental income
- $30,153
- − Mortgage interest
- −$16,805
- − Property taxes
- −$3,620
- − Insurance
- −$1,500
- − Repairs & maintenance
- −$2,412
- − Management
- −$2,412
- − Depreciation
- −$8,727
- Taxable loss
- −$5,324
- Est. tax savings @ 24.0%
- +$1,278
- After-tax cash flow
- $1,099/yr
For passive investors: Depreciation is non-cash, so a rental often shows a tax loss while cash-flowing — sheltering income. Rental losses are passive: they offset passive income freely, and up to $25,000/yr can offset ordinary (W-2) income if you actively participate and your MAGI is under $100k (phasing out to $0 by $150k); unused losses carry forward. On sale, claimed depreciation is recaptured at up to 25%, and gains may owe capital-gains tax (a 1031 exchange can defer both). Figures are a year-1 estimate at your 24.0% rate — not tax advice; consult a CPA.
Schools (NCES district)
- District
- St. Paul Public School District
- NCES district ID
- 2733840
- Math proficiency
- 21% ▼ -11.00%
- Reading proficiency
- 33% ▼ -7.00%
- Median HH income
- $48,316
- Composite
- 23.51/100
- National rank
- #7868
- State rank
- #270 of 301 in MN
Livability — St. Paul
No livability data for this city. (Only ~50 U.S. cities are tracked.)
Census & demographics
- Census place
- St. Paul, MN
- County
- Ramsey County · 542,837 people
- City population
- 280,599
- Metro
- Minneapolis-St. Paul-Bloomington, MN-WI
- Population (ZIP)
- 15,377
- Household income
- $74,531
- Rent vs Own
- Severe rent burden
- 639.0
Population outlook (Ramsey County) Hauer SSP2
- Today (2025)
- 603,431 people
- By 2030
- 636,459 · +5.5%
- By 2040
- 700,596 · +16.1%
- By 2050
- 765,819 · +26.9%
- By 2075
- 929,297 · +54.0%
- By 2100
- 1,053,924 · +74.7%
Race, ethnicity, and origin ACS 2023
- Neighborhood character
- Highly diverse neighborhood (Simpson 0.71)
- Race & ethnicity
- White 47% Hispanic / Latino 23% Two or more races 16% Black 13% Asian 9% Native American 2%
- Hispanic origin (detail)
- Mexican 19%
- Common ancestry
- Portuguese 7% Lithuanian 3% Romanian 2%
- Foreign-born
- 18% · Canada, Philippines, Vietnam
- Languages at home
- 72% English-only · Spanish 15% Other Asian/Pacific 4% Tagalog/Filipino 2%
Political lean MEDSL · Ramsey
- 2024 margin
- Solid D (+43.3) · D 70.5% · R 27.2% · Other 2.3%
- 2008→2024 swing
- +9.4pp toward D · 2008: 33.9pp · 2024: 43.3pp
- All cycles
- 2024: D+43.3 2020: D+45.4 2016: D+39.4 2012: D+35.3 2008: D+33.9
Not yet ingested
- Civics
- —
Market trends
- HPI YoY
- ▼ -57.70%
- Current HPI
- 298.8714
- Rent YoY
- ▲ 10.76%
- Metro
- Minneapolis-St. Paul-Bloomington, MN-WI
- State GDP YoY
- ▲ 2.41%
- F500 in state
- 34
Industry mix (Fortune 500 HQ in MN)
| Industry | F500 HQs | Revenue |
|---|---|---|
| Healthcare | 2 | $407B |
|
||
| Retail | 2 | $150B |
|
||
| Consumer Goods | 2 | $32B |
|
||
| Industrial Machinery | 2 | $6B |
|
||
| Agriculture | 1 | $40B |
|
||
| Healthcare / Medical Devices | 1 | $32B |
|
||
Price history
+33.3% since first listed5 events — show timeline
- 2026-05-24 Pending — NORTHSTARMLS as Distributed by MLS Grid
- 2026-05-21 Relisted — NORTHSTARMLS as Distributed by MLS Grid
- 2026-05-12 Contingent — NORTHSTARMLS as Distributed by MLS Grid
- 2026-05-07 Listed $300,000 NORTHSTARMLS as Distributed by MLS Grid
- 2023-07-24 Sold (Public Records) $225,000 Public Records
Property tax history
+3.6%/yrLatest (2025): $3,620 · +0.9% YoY. Source: county tax records.
Cash-flow waterfall
monthlySold comps — $/sqft
last 12 mo · ≤1 miLoading sold comps…