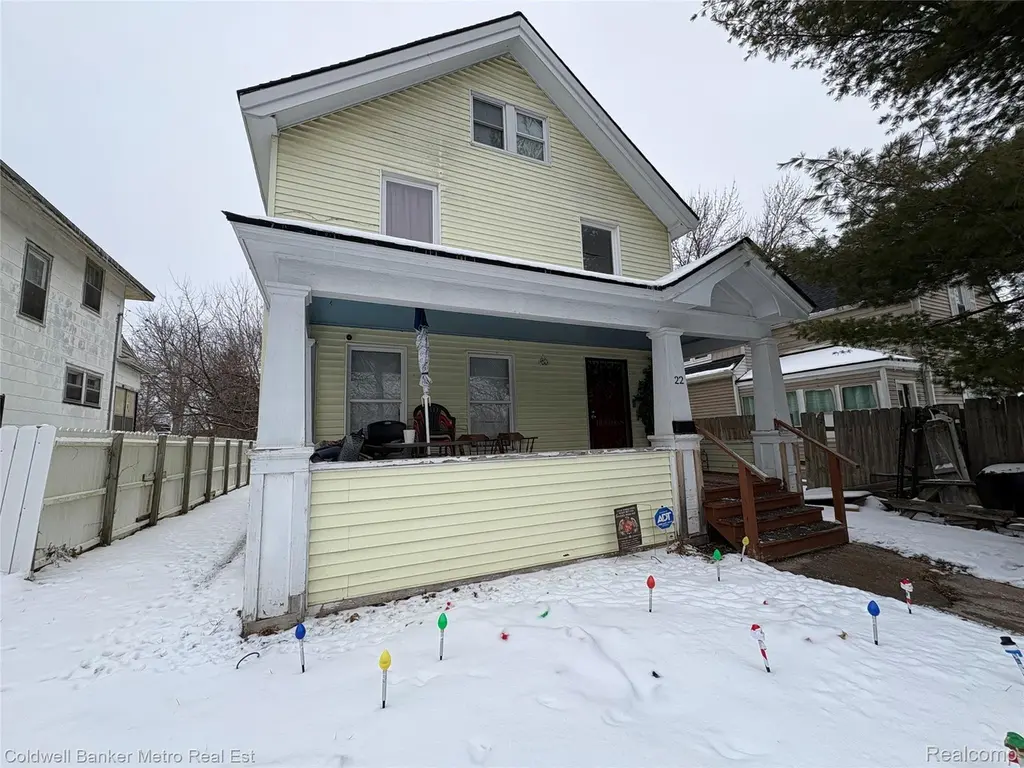
22 Steinbaugh Ct · Pontiac, MI
Flood risk 1/10 · Minimal
- FEMA flood zone
- X (unshaded)
- Chance of flooding over 30 yrs
- 0.0%
- Est. flood insurance / yr
- $473 – $860
Fire risk 1/10 · Minimal
- Est. fire insurance / yr
- $784 – $1,456
Heat risk 2/10 · Minimal
- Hot days now (above 96°F)
- 7 days/yr
- Hot days in 30 yrs
- 15 days/yr
Wind risk 2/10 · Minimal
- Chance of severe wind over 30 yrs
- —
Air-quality risk 3/10 · Minor
- Unhealthy air days now
- 2 days/yr
- Unhealthy air days in 30 yrs
- 4 days/yr
Risk factors via First Street. Map © Google.
Why this score? — see what drove the B- grade
The composite is a weighted blend of 9 inputs, each scored 0–100. Each bar is that input's sub-score; the figure is the points it added to the 100-point composite (weight × sub-score).
- Cash flow +29.4/30.0
- ARV discount +10.1/15.0
- DSCR +10.0/10.0
- 1% rule +7.6/10.0
- Livability +3.2/5.0
- Rent growth +2.5/5.0
- Condition / age +2.5/5.0
- Schools +1.0/10.0
- Appreciation +0.0/10.0
$119,900
🖨 Deal sheet 📄 Offer letter ✓ Due diligence
Key facts
- 3,485 sq ft lot
- Garage
- Built 1910
Neighborhood map
What this means for you Summary
Snapshot
- This is a 3-bed/1.5-bath single-family listed at $120k.
Deal economics
- At list price, monthly cash flow is $426 ($5k/yr) — positive.
- The deal already cash-flows at list — no discount required.
- Meets the 1% rule at list price ($2k rent vs $120k).
- Recommended offer: $106k (12.0% below list) — sets the bar for market timing.
- Cap rate 10.6% vs local median 6.7% in Pontiac — top-decile yield for the area; either an underpriced asset or a hidden risk that comps aren't pricing in. Stress-test before assuming the spread holds.
Location & tenants
- Location reads 64/100 on livability (#499 in MI) — a middle-class / working-renter tenant base. Strengths: commute A+, cost of living A+, housing A+; Watch: health & safety D, schools F, crime F.
- Pontiac City School District (urban): math 8% / reading 17% proficiency, ranked #514 of 540 in MI (top 95%) — low school quality limits family demand, transient renter base, plan for 1-2y turnover; 81% free/reduced lunch — lower-income household profile, screen leases tightly.
- Market conditions: 100 active listings in the ZIP; 18 comparable units currently listed for rent nearby; rentals at typical pace (median 24d on market — plan ~3-4 weeks tenant-placement turnaround); 2,614 units permitted in Oakland County in 2024 (721 in 5+ unit buildings).
- This rent runs 35% of the median local income ($51k/yr) — at the standard rent-burdened threshold; future hikes will face affordability resistance.
Forward outlook
- Local home prices are declining (-3.0%/yr); year-one equity from $829 of loan paydown is wiped out by about $4k of value loss. Plan a longer hold.
- Oakland County population projected at +10% by 2050 — modest demand growth; plan on rents tracking national, not racing it.
- At projected returns (-3.0% appreciation + 3.0% rent growth), your $34k cash investment doubles in ~8 years — after that, you're playing with house money.
Negotiation context
- It's been on market 158 days — a 12% lower offer ($106k) is reasonable based on typical stale-listing flexibility.
- 8 sale attempts since 21y ago with the ask held roughly flat each time — persistent listings suggest the price (not the market) is what's stuck; bring a comps-based counter.
- Current owner paid $85k; 41% above their basis — modest negotiation headroom, anchor on the comps not their cost.
Risks & watch-outs
- Watch-outs: built in 1910 — expect roof / HVAC / electrical / plumbing capex.
Questions for the listing agent
- It's been on market 158 days. Have you received any prior offers? Is the seller open to a 12% concession, seller financing, or rate buy-down credit?
- Built in 1910 — when were the roof, HVAC, electrical panel, plumbing, and water heater last replaced?
- Why hasn't it sold? Are there any deal-killer items the seller is aware of (foundation, flood, title, zoning, code violations)?
- Is there a deadline driving the sale (1031 exchange, divorce, estate, relocation)? That informs how much negotiation room exists.
- Schools are F-rated, which usually means shorter tenancies and higher turnover. Who's the typical renter profile here, and what's been the actual vacancy rate?
- Crime grade is F in this area — have there been break-ins, vandalism, or insurance claims at this property in the last 3 years? What carrier currently insures it and at what premium?
- What's the average days-on-market for RENTAL listings here right now (not sales)? A rising rental-DOM trend means longer vacancies and softer asking-rent achievability than the comps imply.
- What's the recent tenant-quality profile in this submarket — average credit score on applications, eviction rate, late-payment / NSF rate, and stable-employment percentage? A property-management company in the area should have these aggregated.
- How much new for-sale + rental construction is in the pipeline within 1–3 miles? Heavy new supply typically softens prices + rents 12–24 months out; constrained supply supports both.
Investment metrics
- 1% rule
- 1.26% ✓
- Cap rate
- 10.55%
- Cash-on-cash
- 15.22%
- DSCR
- 1.68
- GRM
- 6.6
CMA / ARV
- ARV (median comp)
- $127,233
- List price
- $119,900
- Delta
- -5.76%
- Verdict
- FAIR
- Comps
- 20 within 1.0 mi
Show comp detail 12 sales within ~0.75 mi
| Address | Dist | Beds/Ba | Sqft | Sold | Price | $/sf | Match |
|---|---|---|---|---|---|---|---|
| 105 Augusta Ave | 0.04mi | 3/1.5 | 1,231 (-10%) | 3mo | $114,000 | $93 | 79 |
| 167 Mark Ave | 0.44mi | 3/2.0 | 1,415 (+4%) | 4mo | $162,000 | $114 | 68 |
| 63 Mark Ave | 0.48mi | 3/1.0 | 1,444 (+6%) | 1mo | $61,000 | $42 | 66 |
| 143 Thorpe St | 0.37mi | 3/1.0 | 1,247 (-9%) | 2mo | $174,900 | $140 | 65 |
| 93 Poplar Ave | 0.71mi | 3/1.5 | 1,344 (-2%) | 1mo | $191,500 | $142 | 63 |
| 140 W Howard St | 0.51mi | 3/1.5 | 1,288 (-6%) | 5mo | $105,000 | $82 | 63 |
| 73 Poplar Ave | 0.74mi | 3/2.5 | 1,367 (+0%) | 3mo | $130,000 | $95 | 59 |
| 69 Lincoln St | 0.35mi | 3/2.0 | 1,211 (-11%) | 7mo | $175,000 | $145 | 57 |
| 27 Crawford St | 0.66mi | 3/1.0 | 1,302 (-5%) | 4mo | $94,000 | $72 | 56 |
| 75 Green St | 0.48mi | 3/1.0 | 1,218 (-11%) | 2mo | $113,000 | $93 | 56 |
| 320 Cesar E Chavez Ave | 0.47mi | 3/2.0 | 1,530 (+12%) | 1mo | $170,000 | $111 | 55 |
| 196 Mohawk Rd | 0.74mi | 4/2.0 (+1) | 1,514 (+11%) | 5mo | $97,900 | $65 | 36 |
Match score weights: distance 35% · size 25% · config 20% · recency 20%. Top-matched comps best support the ARV.
Projected returns pro-forma
-3.0% appreciation · 3.0% rent growth · sell at horizon
- IRR
- 5.9%
- Equity multiple
- 1.23×
- Total profit
- $7,669
- Equity at exit
- $17,877
- IRR
- 15.3%
- Equity multiple
- 2.24×
- Total profit
- $41,524
- Equity at exit
- $10,367
Cash invested: $33,572 (down + closing). Projections, not guarantees.
Landlord ↔ Tenant lean methodology
- Overall (STATE)
- 62 Landlord-Friendly
- State Michigan
- 62 Landlord-Friendly · EVEN
- County
- — inherits STATE
- City
- — inherits STATE
ZIP-level market 48341
- Active inventory
- 100
- Price-to-rent
- 6.6×
Monthly cashflow live
- Estimated rent
- $1,506 high interval (Pro) →
- Mortgage (P&I)
- −$629
- Tax from tax record
- −$85 /mo · $1,019/yr
- Insurance
- −$50
- HOA
- −$0
- Vacancy / Maint / Mgmt
- −$316
- Net cashflow
- $426
Break-even live
UW: 25.0% down · 7.5% · 30yr · 1.5% tax · 5.0% vac · 8.0% maint · 8.0% mgmt
Financing live
Cash to close
- Down payment
- $29,975
- Closing costs
- $3,597
- Reserves months
- —
- Total cash needed
- —
Loan-product check · same deal, 3 products live
Conventional
25% down · 7.5% · 30yr
- Down + closing
- —
- Monthly P&I
- —
- Monthly cashflow
- —
- DSCR
- —
- Eligible?
- —
Personal DTI + credit; lowest rate.
DSCR
20% down · 8.5% · 30yr
- Down + closing
- —
- Monthly P&I
- —
- Monthly cashflow
- —
- DSCR
- —
- Eligible?
- —
No personal income docs; deal must DSCR.
Hard money
10% down · 12.0% · 12mo
- Down + closing
- —
- Monthly P&I
- —
- Monthly cashflow
- —
- DSCR
- —
- Eligible?
- —
Short-term bridge; refi at stabilization.
Rent comps 18 comps
| Address | Beds | Baths | Sqft | Rent | $/sqft | DOM | Units | Dist |
|---|---|---|---|---|---|---|---|---|
| 23 Henry Clay Ave Unit 1 Pontiac, MI | 3.0 | 1.0 | 1200 | $1,450 | $1.21 | 17d | 1 | 0.41mi |
| 38 Spokane Dr Pontiac, MI | 2.0 | 1.0 | 1000 | $1,000 | $1.00 | 43d | 1 | 0.61mi |
| 60 Waldo St Pontiac, MI | 3.0 | 1.0 | 1100 | $1,500 | $1.36 | 5d | 1 | 0.68mi |
| 74 E Iroquois Rd Pontiac, MI | 3.0 | 1.0 | 1661 | $1,695 | $1.02 | 24d | 1 | 0.76mi |
| 223 Tucker St Pontiac, MI | 2.0 | 2.5 | 1295 | $1,700 | $1.31 | 17d | 1 | 0.79mi |
| 99 Chippewa Rd Pontiac, MI | 4.0 | 1.0 | 1315 | $1,750 | $1.33 | 24d | 1 | 0.82mi |
| 49 Oakhill St Pontiac, MI | 3.0 | 1.0 | 1200 | $1,575 | $1.31 | 24d | 1 | 0.96mi |
| 4000 Winston Dr Pontiac, MI | 2.0 | 1.5 | 1032 | $515 | $0.50 | 2d | 1 | 1.00mi |
| 5 Wenonah Dr Pontiac, MI | 4.0 | 1.5 | 1749 | $2,000 | $1.14 | 43d | 1 | 1.00mi |
| 65 Whitfield St Pontiac, MI | 3.0 | 1.0 | 924 | $1,175 | $1.27 | 43d | 1 | 1.06mi |
| 949 Boston Ave Unit 1 Waterford Township, MI | 2.0 | 1.0 | 1220 | $1,150 | $0.94 | 21d | 1 | 1.17mi |
| 949 Boston Ave Waterford Twp, MI | 2.0 | 1.0 | 1320 | $1,150 | $0.87 | 43d | 1 | 1.17mi |
| 27 Sylvan Pontiac, MI | 2.0 | 1.5 | 1370 | $1,175 | $0.86 | 12d | 1 | 1.19mi |
| 995 Lakeview St Waterford, MI | 2.0 | 1.5 | 884 | $1,375 | $1.56 | 24d | 1 | 1.32mi |
| 249 W Wilson Ave Unit 1 Pontiac, MI | 3.0 | 1.0 | 900 | $1,540 | $1.71 | 43d | 1 | 1.40mi |
| 68 N Shirley St Pontiac, MI | 3.0 | 1.0 | 950 | $1,395 | $1.47 | 17d | 1 | 1.41mi |
| 38 N Shirley St Pontiac, MI | 3.0 | 1.0 | 1174 | $1,425 | $1.21 | 43d | 1 | 1.42mi |
| 264 Nelson St Pontiac, MI | 3.0 | 1.0 | 1478 | $1,590 | $1.08 | 43d | 1 | 1.45mi |
Listing history 38 events
-
2026-06-18days on market $119,900 Active 158 DOM
-
2026-06-17days on market $119,900 Active 157 DOM
-
2026-06-16days on market $119,900 Active 156 DOM
-
2026-06-15days on market $119,900 Active 155 DOM
-
2026-06-13days on market $119,900 Active 153 DOM
-
2026-06-13days on market $119,900 Active 152 DOM
-
2026-06-09days on market $119,900 Active 149 DOM
-
2026-06-08days on market $119,900 Active 148 DOM
-
2026-06-07days on market $119,900 Active 147 DOM
-
2026-06-04days on market $119,900 Active 144 DOM
-
2026-06-03days on market $119,900 Active 143 DOM
-
2026-06-02days on market $119,900 Active 142 DOM
-
2026-06-01days on market $119,900 Active 141 DOM
-
2026-05-31days on market $119,900 Active 140 DOM
-
2026-01-11$119,900 Active
-
2026-01-11$119,900 Active
-
2022-04-26soldstatus $85,000
-
2022-03-21soldstatus $85,000 Sold
-
2022-03-21soldstatus $85,000 Closed
-
2022-02-01status Pending
-
2022-02-01status Pending
-
2022-01-20historical Accepting Backup Offers
-
2022-01-20historical Accepting Backup Offers
-
2022-01-17status Active
-
2022-01-17status Active
-
2022-01-08status Pending
-
2022-01-08status Pending
-
2021-12-22historical Accepting Backup Offers
-
2021-12-22historical Accepting Backup Offers
-
2021-12-20status Active
-
2021-12-17historical Accepting Backup Offers
-
2021-11-29$89,000 Active
-
2021-11-29$89,000 Active
-
2021-11-24historical $89,000
-
2021-11-24historical $89,000
-
2005-12-13soldstatus $37,000
-
2005-11-14soldstatus $37,000
-
2005-10-11$40,950
ⓘ Source: listings_history table (triggers on properties + properties_extension) + one-shot
backfill from property_details.listing_events for pre-trigger history.
Tax reassessment forecast MI · Partial reset (capped growth)
- Current annual tax
- $1,019 · $85/mo
- Projected year-2 tax
- $1,433 · $119/mo
- Expected delta
- +$414/yr (+$34/mo · 40.6%)
ⓘ Screening estimate from a state-policy table — verify with the county assessor before closing.
Climate risk First Street
- Flood 1/10 Low FEMA zone X (unshaded) · 0% chance over 30 yrs
- Wildfire 1/10 Low
- Heat 2/10 Low 7 d/yr ≥96°F today · 15 d/yr by 30 yrs out
- Wind 2/10 Low
- Air quality 3/10 Moderate 2 unhealthy d/yr today · 4 by 30 yrs out
Nearby sold comps map
Loading sold comps map…
Walkable amenities ~0.75 mi
Loading nearby amenities…
Taxation est. · year 1
- Rental income
- $18,067
- − Mortgage interest
- −$6,716
- − Property taxes
- −$1,019
- − Insurance
- −$600
- − Repairs & maintenance
- −$1,445
- − Management
- −$1,445
- − Depreciation
- −$3,488
- Taxable income
- $3,353
- Est. tax owed @ 24.0%
- −$805
- After-tax cash flow
- $4,304/yr
For passive investors: Depreciation is non-cash, so a rental often shows a tax loss while cash-flowing — sheltering income. Rental losses are passive: they offset passive income freely, and up to $25,000/yr can offset ordinary (W-2) income if you actively participate and your MAGI is under $100k (phasing out to $0 by $150k); unused losses carry forward. On sale, claimed depreciation is recaptured at up to 25%, and gains may owe capital-gains tax (a 1031 exchange can defer both). Figures are a year-1 estimate at your 24.0% rate — not tax advice; consult a CPA.
Schools (NCES district)
- District
- Pontiac City School District
- NCES district ID
- 2628740
- Math proficiency
- 8% ▼ -5.00%
- Reading proficiency
- 17% ▼ -3.00%
- Median HH income
- $33,888
- Composite
- 10.12/100
- National rank
- #9802
- State rank
- #514 of 540 in MI
Livability — Pontiac
- Score
- 64/100
- State rank
- #499
- US rank
- #14703
Category grades
Schools grade is shown separately in the Schools card above.
Census & demographics
- Census place
- Pontiac, MI
- County
- Oakland County · 1,009,092 people
- City population
- 44,593
- Metro
- Detroit-Warren-Dearborn, MI
- Population (ZIP)
- 18,924
- Household income
- $51,390
- Rent vs Own
- Severe rent burden
- 833.0
Population outlook (Oakland County) Hauer SSP2
- Today (2025)
- 1,335,747 people
- By 2030
- 1,375,100 · +2.9%
- By 2040
- 1,435,385 · +7.5%
- By 2050
- 1,469,250 · +10.0%
- By 2075
- 1,531,946 · +14.7%
- By 2100
- 1,450,485 · +8.6%
Race, ethnicity, and origin ACS 2023
- Neighborhood character
- Diverse neighborhood (Simpson 0.61)
- Race & ethnicity
- Black 57% White 22% Hispanic / Latino 12% Two or more races 11% Asian 3%
- Hispanic origin (detail)
- Mexican 4% Puerto Rican 2%
- Common ancestry
- Slovak 2% Romanian 1% Swiss 1%
- Foreign-born
- 10% · Canada
- Languages at home
- 86% English-only · Spanish 9% Other Indo-European 1% Other Asian/Pacific 1%
Political lean MEDSL · Oakland
- 2024 margin
- D (+10.6) · D 54.4% · R 43.8% · Other 1.9%
- 2008→2024 swing
- -3.9pp toward R · 2008: 14.5pp · 2024: 10.6pp
- All cycles
- 2024: D+10.6 2020: D+14.1 2016: D+8.1 2012: D+8.1 2008: D+14.5
Not yet ingested
- Civics
- —
Market trends
- HPI YoY
- ▼ -204.11%
- Current HPI
- 257.8941
- Rent YoY
- —
- Metro
- Detroit-Warren-Dearborn, MI
- State GDP YoY
- ▲ 1.37%
- F500 in state
- 28
Industry mix (Fortune 500 HQ in MI)
| Industry | F500 HQs | Revenue |
|---|---|---|
| Automotive Parts | 3 | $48B |
|
||
| Automotive | 2 | $372B |
|
||
| Chemicals | 1 | $45B |
|
||
| Automotive Retail | 1 | $29B |
|
||
| Healthcare / Medical Devices | 1 | $23B |
|
||
| Automotive Technology | 1 | $20B |
|
||
Price history
+192.8% since first listed24 events — show timeline
- 2026-01-11 Listed $119,900 REALCOMP
- 2026-01-11 Listed $119,900 MiRealSource-MiMLS
- 2022-04-26 Sold (Public Records) $85,000 Public Records
- 2022-03-21 Sold (MLS) $85,000 MiRealSource-MiMLS
- 2022-03-21 Sold (MLS) $85,000 REALCOMP
- 2022-02-01 Pending — MiRealSource-MiMLS
- 2022-02-01 Pending — REALCOMP
- 2022-01-20 Contingent — MiRealSource-MiMLS
- 2022-01-20 Contingent — REALCOMP
- 2022-01-17 Relisted — MiRealSource-MiMLS
- 2022-01-17 Relisted — REALCOMP
- 2022-01-08 Pending — MiRealSource-MiMLS
- 2022-01-08 Pending — REALCOMP
- 2021-12-22 Contingent — MiRealSource-MiMLS
- 2021-12-22 Contingent — REALCOMP
- 2021-12-20 Relisted — REALCOMP
- 2021-12-17 Contingent — REALCOMP
- 2021-11-29 Listed $89,000 MiRealSource-MiMLS
- 2021-11-29 Listed $89,000 REALCOMP
- 2021-11-24 Coming Soon $89,000 MiRealSource-MiMLS
- 2021-11-24 Coming Soon $89,000 REALCOMP
- 2005-12-13 Sold (Public Records) $37,000 Public Records
- 2005-11-14 Sold (MLS) $37,000 REALCOMP
- 2005-10-11 Listed $40,950 REALCOMP
Property tax history
+3.6%/yrLatest (2025): $1,019 · -8.6% YoY. Source: county tax records.
Cash-flow waterfall
monthlySold comps — $/sqft
last 12 mo · ≤1 miLoading sold comps…