210 N South St · Tonopah, NV
Flood risk 1/10 · Minimal
- FEMA flood zone
- X (unshaded)
- Chance of flooding over 30 yrs
- 0.0%
- Est. flood insurance / yr
- $507 – $1,088
Fire risk 1/10 · Minimal
- Est. fire insurance / yr
- $490 – $910
Heat risk 4/10 · Minor
- Hot days now (above 89°F)
- 6 days/yr
- Hot days in 30 yrs
- 16 days/yr
Wind risk 1/10 · Minimal
- Chance of severe wind over 30 yrs
- —
Air-quality risk 3/10 · Minor
- Unhealthy air days now
- 2 days/yr
- Unhealthy air days in 30 yrs
- 3 days/yr
Risk factors via First Street. Map © Google.
Why this score? — see what drove the B grade
The composite is a weighted blend of 9 inputs, each scored 0–100. Each bar is that input's sub-score; the figure is the points it added to the 100-point composite (weight × sub-score).
- Cash flow +30.0/30.0
- 1% rule +10.0/10.0
- DSCR +10.0/10.0
- ARV discount +7.5/15.0
- Appreciation +6.9/10.0
- Livability +3.2/5.0
- Rent growth +2.5/5.0
- Condition / age +2.5/5.0
- Schools +2.2/10.0
$35,000
🖨 Deal sheet 📄 Offer letter ✓ Due diligence
Listing remarks MLS
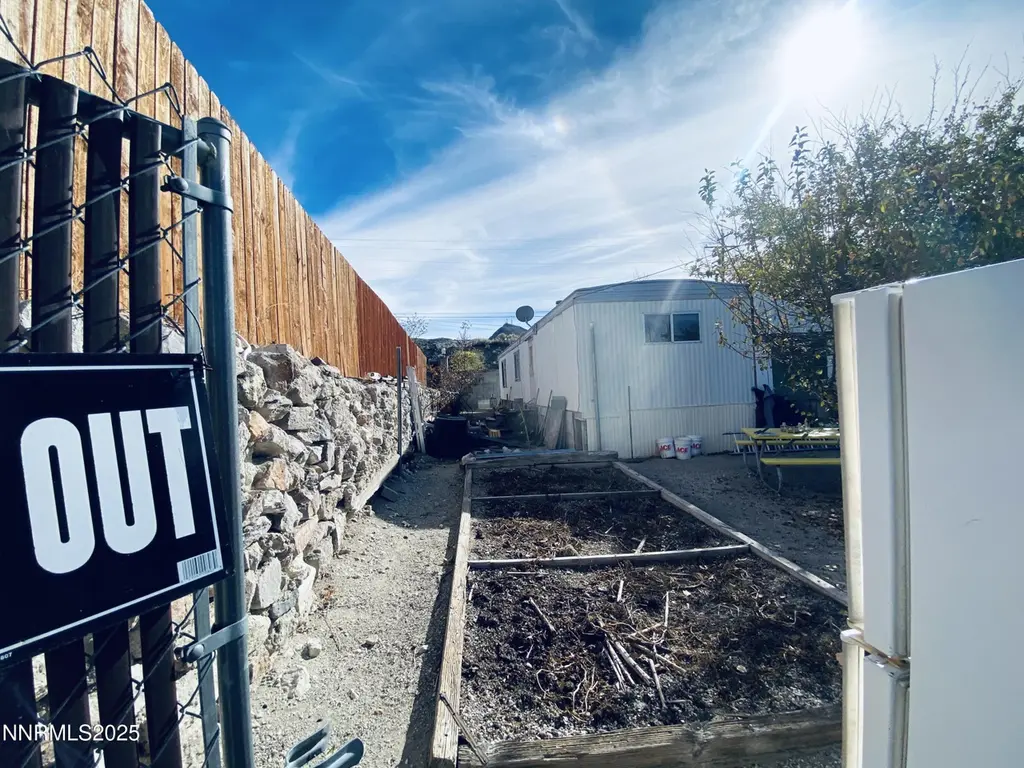
This home is located on the Corner of Oddie and N. South Street. It is tenant occupied and a minimum of 24 hours' notice is required. CASH Only Sale is "AS IS". Do Not Disturb Occupant. Fully fenced and views of the mountains to the West.
Key facts
- Fully fenced
- 3,484 sq ft lot
- Built 1972
Tags
Neighborhood map
What this means for you Summary
Snapshot
- This is a 1-bed/1.0-bath other listed at $35k.
Deal economics
- At list price, monthly cash flow is $444 ($5k/yr) — positive.
- The deal already cash-flows at list — no discount required.
- Meets the 1% rule at list price ($843 rent vs $35k).
- Recommended offer: $31k (12.0% below list) — sets the bar for market timing.
Location & tenants
- Location reads 63/100 on livability (#60 in NV) — a middle-class / working-renter tenant base. Strengths: cost of living A+, housing A+, crime B+; Watch: schools F, amenities F, commute F.
- Nye County School District (rural): math 20% / reading 33% proficiency, ranked #16 of 17 in NV (top 94%) — low school quality limits family demand, transient renter base, plan for 1-2y turnover.
- Market conditions: 25 active listings in the ZIP.
Forward outlook
- In year one you build about $2k of equity ($242 loan paydown + $1k appreciation (3.9% local appreciation)).
- Nye County population projected at -28% by 2050 — secular population decline; favor cash flow + early exit over multi-decade hold.
- At projected returns (3.9% appreciation + 3.0% rent growth), your $10k cash investment doubles in ~2 years — after that, you're playing with house money.
Negotiation context
- It's been on market 203 days — a 12% lower offer ($31k) is reasonable based on typical stale-listing flexibility.
- 2 sale attempts with the ask held roughly flat each time — persistent listings suggest the price (not the market) is what's stuck; bring a comps-based counter.
Questions for the listing agent
- It's been on market 203 days. Have you received any prior offers? Is the seller open to a 12% concession, seller financing, or rate buy-down credit?
- Built in 1972 — when were the roof, HVAC, electrical panel, plumbing, and water heater last replaced?
- Why hasn't it sold? Are there any deal-killer items the seller is aware of (foundation, flood, title, zoning, code violations)?
- Is there a deadline driving the sale (1031 exchange, divorce, estate, relocation)? That informs how much negotiation room exists.
- Schools are F-rated, which usually means shorter tenancies and higher turnover. Who's the typical renter profile here, and what's been the actual vacancy rate?
- What's the average days-on-market for RENTAL listings here right now (not sales)? A rising rental-DOM trend means longer vacancies and softer asking-rent achievability than the comps imply.
- What's the recent tenant-quality profile in this submarket — average credit score on applications, eviction rate, late-payment / NSF rate, and stable-employment percentage? A property-management company in the area should have these aggregated.
- How much new for-sale + rental construction is in the pipeline within 1–3 miles? Heavy new supply typically softens prices + rents 12–24 months out; constrained supply supports both.
Investment metrics
- 1% rule
- 2.41% ✓
- Cap rate
- 21.50%
- Cash-on-cash
- 54.32%
- DSCR
- 3.42
- GRM
- 3.5
CMA / ARV
No comps found within radius.
Projected returns pro-forma
3.88% appreciation · 3.0% rent growth · sell at horizon
- IRR
- 60.3%
- Equity multiple
- 4.48×
- Total profit
- $34,130
- Equity at exit
- $17,501
- IRR
- 59.1%
- Equity multiple
- 9.16×
- Total profit
- $79,934
- Equity at exit
- $28,432
Cash invested: $9,800 (down + closing). Projections, not guarantees.
Landlord ↔ Tenant lean methodology
- Overall (STATE)
- 71 Landlord-Friendly
- State Nevada
- 71 Landlord-Friendly · R+1
- County
- — inherits STATE
- City
- — inherits STATE
ZIP-level market 89049
- Home prices YoY
- 3.2%
- Active inventory
- 25
- Price-to-rent
- 3.5×
Monthly cashflow live
- Estimated rent
- $843 medium interval (Pro) →
- Mortgage (P&I)
- −$184
- Tax from tax record
- −$24 /mo · $290/yr
- Insurance
- −$15
- HOA
- −$0
- Vacancy / Maint / Mgmt
- −$177
- Net cashflow
- $444
Break-even live
UW: 25.0% down · 7.5% · 30yr · 1.5% tax · 5.0% vac · 8.0% maint · 8.0% mgmt
Financing live
Cash to close
- Down payment
- $8,750
- Closing costs
- $1,050
- Reserves months
- —
- Total cash needed
- —
Loan-product check · same deal, 3 products live
Conventional
25% down · 7.5% · 30yr
- Down + closing
- —
- Monthly P&I
- —
- Monthly cashflow
- —
- DSCR
- —
- Eligible?
- —
Personal DTI + credit; lowest rate.
DSCR
20% down · 8.5% · 30yr
- Down + closing
- —
- Monthly P&I
- —
- Monthly cashflow
- —
- DSCR
- —
- Eligible?
- —
No personal income docs; deal must DSCR.
Hard money
10% down · 12.0% · 12mo
- Down + closing
- —
- Monthly P&I
- —
- Monthly cashflow
- —
- DSCR
- —
- Eligible?
- —
Short-term bridge; refi at stabilization.
Listing history 18 events
-
2026-06-19days on market $35,000 Active 203 DOM
-
2026-06-18days on market $35,000 Active 202 DOM
-
2026-06-17days on market $35,000 Active 201 DOM
-
2026-06-16days on market $35,000 Active 200 DOM
-
2026-06-15days on market $35,000 Active 199 DOM
-
2026-06-14days on market $35,000 Active 197 DOM
-
2026-06-12days on market $35,000 Active 196 DOM
-
2026-06-09days on market $35,000 Active 193 DOM
-
2026-06-08days on market $35,000 Active 192 DOM
-
2026-06-07days on market $35,000 Active 191 DOM
-
2026-06-03days on market $35,000 Active 187 DOM
-
2026-06-02days on market $35,000 Active 186 DOM
-
2026-06-01days on market $35,000 Active 185 DOM
-
2026-05-31days on market $35,000 Active 184 DOM
-
2026-05-30days on market $35,000 Active 183 DOM
-
2026-04-30status Active 248-char remark
Show marketing remark (248 chars)
This home is located on the Corner of Oddie and N. South Street. It is tenant occupied and a minimum of 24 hours' notice is required. CASH Only Sale is "AS IS". Do Not Disturb Occupant. Fully fenced and views of the mountains to the West.
-
2026-04-27historical Active Under Contract-Show 248-char remark
Show marketing remark (248 chars)
This home is located on the Corner of Oddie and N. South Street. It is tenant occupied and a minimum of 24 hours' notice is required. CASH Only Sale is "AS IS". Do Not Disturb Occupant. Fully fenced and views of the mountains to the West.
-
2025-11-25$35,000 Active 248-char remark
Show marketing remark (248 chars)
This home is located on the Corner of Oddie and N. South Street. It is tenant occupied and a minimum of 24 hours' notice is required. CASH Only Sale is "AS IS". Do Not Disturb Occupant. Fully fenced and views of the mountains to the West.
ⓘ Source: listings_history table (triggers on properties + properties_extension) + one-shot
backfill from property_details.listing_events for pre-trigger history.
Tax reassessment forecast NV · Resets to sale price
- Current annual tax
- $290 · $24/mo
- Projected year-2 tax
- $290 · $24/mo
- Expected delta
- $0/yr ($0/mo · 0.0%)
ⓘ Screening estimate from a state-policy table — verify with the county assessor before closing.
Climate risk First Street
- Flood 1/10 Low FEMA zone X (unshaded) · 0% chance over 30 yrs
- Wildfire 1/10 Low
- Heat 4/10 Moderate 6 d/yr ≥89°F today · 16 d/yr by 30 yrs out
- Wind 1/10 Low
- Air quality 3/10 Moderate 2 unhealthy d/yr today · 3 by 30 yrs out
Nearby sold comps map
Loading sold comps map…
Walkable amenities ~0.75 mi
Loading nearby amenities…
Taxation est. · year 1
- Rental income
- $10,115
- − Mortgage interest
- −$1,961
- − Property taxes
- −$290
- − Insurance
- −$175
- − Repairs & maintenance
- −$809
- − Management
- −$809
- − Depreciation
- −$1,018
- Taxable income
- $5,053
- Est. tax owed @ 24.0%
- −$1,213
- After-tax cash flow
- $4,111/yr
For passive investors: Depreciation is non-cash, so a rental often shows a tax loss while cash-flowing — sheltering income. Rental losses are passive: they offset passive income freely, and up to $25,000/yr can offset ordinary (W-2) income if you actively participate and your MAGI is under $100k (phasing out to $0 by $150k); unused losses carry forward. On sale, claimed depreciation is recaptured at up to 25%, and gains may owe capital-gains tax (a 1031 exchange can defer both). Figures are a year-1 estimate at your 24.0% rate — not tax advice; consult a CPA.
Schools (NCES district)
- District
- Nye County School District
- NCES district ID
- 3200360
- Math proficiency
- 20% ▼ -6.00%
- Reading proficiency
- 33% ▼ -5.00%
- Median HH income
- $41,447
- Composite
- 22.43/100
- National rank
- #8110
- State rank
- #16 of 17 in NV
Livability — Tonopah
- Score
- 63/100
- State rank
- #60
- US rank
- #16080
Category grades
Schools grade is shown separately in the Schools card above.
Census & demographics
- Census place
- Tonopah, NV
- Population (ZIP)
- 2,711
Population outlook (Nye County) Hauer SSP2
- Today (2025)
- 40,727 people
- By 2030
- 38,812 · -4.7%
- By 2040
- 33,952 · -16.6%
- By 2050
- 29,393 · -27.8%
- By 2075
- 21,122 · -48.1%
- By 2100
- 14,400 · -64.6%
Race, ethnicity, and origin ACS 2023
- Neighborhood character
- Predominantly White (73%)
- Race & ethnicity
- White 73% Hispanic / Latino 15% Black 8% Two or more races 4% Asian 1%
- Hispanic origin (detail)
- Mexican 8% Puerto Rican 5%
- Common ancestry
- Lithuanian 2% Romanian 2% Scottish 2%
- Foreign-born
- 8% · Canada, China
- Languages at home
- 90% English-only · French/Haitian/Cajun 6% Spanish 2% Tagalog/Filipino 1%
Political lean MEDSL · Nye
- 2024 margin
- Solid R (+42.2) · D 28.0% · R 70.2% · Other 1.8%
- 2008→2024 swing
- -28.8pp toward R · 2008: -13.4pp · 2024: -42.2pp
- All cycles
- 2024: R+42.2 2020: R+40.4 2016: R+42.0 2012: R+24.2 2008: R+13.4
Not yet ingested
- Civics
- —
Market trends
- HPI YoY
- ▲ 3.88%
- Current HPI
- 124.5675
- Rent YoY
- —
- Metro
- —
- State GDP YoY
- ▲ 3.08%
- F500 in state
- 6
Industry mix (Fortune 500 HQ in NV)
| Industry | F500 HQs | Revenue |
|---|---|---|
| Hotels / Casinos | 3 | $36B |
|
||
Price history
3 events — show timeline
- 2026-04-30 Relisted — NNRMLS
- 2026-04-27 Contingent — NNRMLS
- 2025-11-25 Listed $35,000 NNRMLS
Property tax history
+1.5%/yrLatest (2025): $290 · -2.8% YoY. Source: county tax records.
Cash-flow waterfall
monthlySold comps — $/sqft
last 12 mo · ≤1 miLoading sold comps…