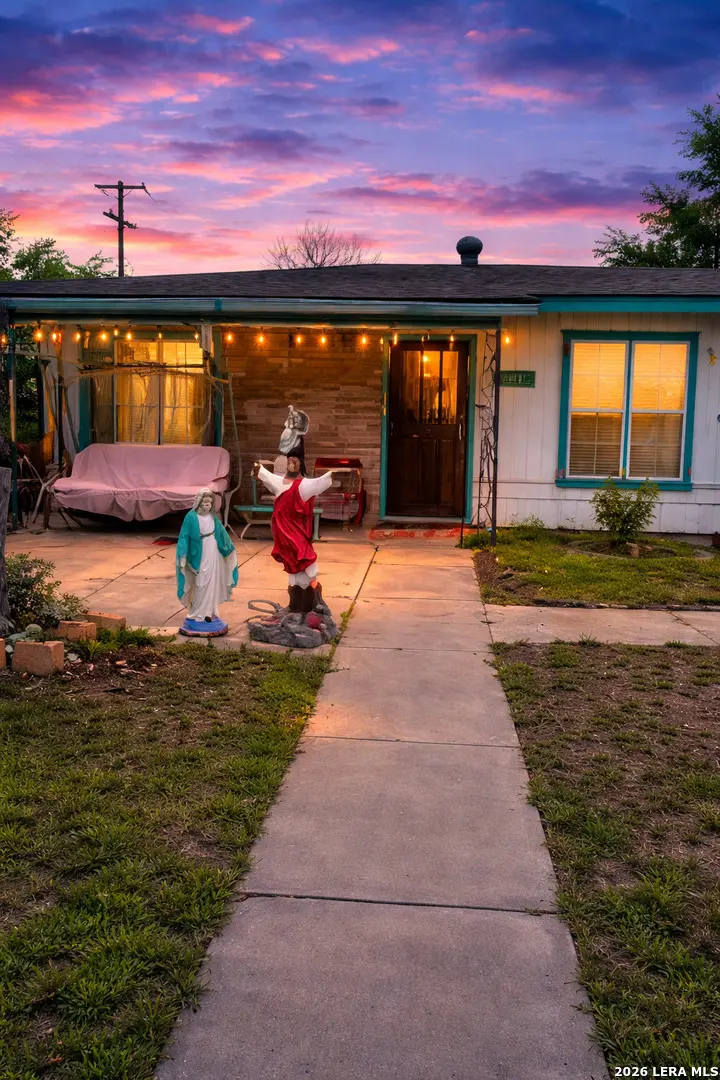
503 Lanark · San Antonio, TX
Flood risk 1/10 · Minimal
- FEMA flood zone
- X (unshaded)
- Chance of flooding over 30 yrs
- 0.0%
- Est. flood insurance / yr
- $507 – $1,088
Fire risk 1/10 · Minimal
- Est. fire insurance / yr
- $1,222 – $2,270
Heat risk 8/10 · Major
- Hot days now (above 108°F)
- 7 days/yr
- Hot days in 30 yrs
- 22 days/yr
Wind risk 8/10 · Major
- Chance of severe wind over 30 yrs
- 80.0%
Air-quality risk 2/10 · Minimal
- Unhealthy air days now
- 0 days/yr
- Unhealthy air days in 30 yrs
- 1 days/yr
Risk factors via First Street. Map © Google.
Why this score? — see what drove the B grade
The composite is a weighted blend of 9 inputs, each scored 0–100. Each bar is that input's sub-score; the figure is the points it added to the 100-point composite (weight × sub-score).
- Cash flow +26.7/30.0
- ARV discount +15.0/15.0
- 1% rule +9.8/10.0
- DSCR +9.2/10.0
- Livability +4.0/5.0
- Schools +3.8/10.0
- Condition / age +2.5/5.0
- Rent growth +1.1/5.0
- Appreciation +0.0/10.0
$105,000
🖨 Deal sheet 📄 Offer letter ✓ Due diligence
Listing remarks
Multiple offers received, please submit highest & best offers by Sunday @ 10pm. * Refresh needed with endless potential in a convenient San Antonio location! This 3-bedroom, 2-bath home offers a functional layout and classic hardwood floors, providing a great foundation for your next project. With easy access to major highways, shopping, and dining, the location adds even more value. Bring your vision and transform this property into something special!
Key facts
- Functional layout
- Hardwood floors
- San antonio location
Tags
Property features AI
Finance
- Financial info: Down payment assistance resources available
- HOA & community: Subdivision: North Alamo Heights
Exterior
- Parking: Attached parking
- Utilities: Water: SAWS / City; Sewer: City of San Antonio; Gas: CPS; Electric: CPS; Garbage: City of San Antonio
- Home design: Pre-owned property; Approximate age: 70 years; Slab entry/foundation
- Construction: Built-up/gravel roof; Slab foundation; Asbestos shingle exterior; Approximately 70 years old
- Exterior features: Asbestos shingle exterior; Lot in North Alamo Heights subdivision
Interior
- Kitchen: Eat-in kitchen (12 x 12)
- Bedrooms: Master bedroom on lower level (10 x 10); Bedroom 2 (10 x 10); Bedroom 3 (10 x 10)
- Flooring: Wood floors; Linoleum floors
- Bathrooms: Two full bathrooms; Master bath with shower only (5 x 5)
- Heating & cooling: Floor furnace heating; Electric heat; One window air conditioner
- Interior features: Ceiling fans; Chandelier; City garbage service; Some window coverings remain; Eat-in kitchen; One living area
- Laundry & utility: Washer connection; Dryer connection
Neighborhood map
What this means for you Summary
Snapshot
- This is a 3-bed/1.0-bath single-family listed at $105k.
Deal economics
- At list price, monthly cash flow is $284 ($3k/yr) — positive.
- The deal already cash-flows at list — no discount required.
- Meets the 1% rule at list price ($2k rent vs $105k).
- Recommended offer: $103k (1.5% below list) — sets the bar for market timing.
- Cap rate 9.5% vs local median 3.8% in San Antonio — top-decile yield for the area; either an underpriced asset or a hidden risk that comps aren't pricing in. Stress-test before assuming the spread holds.
Location & tenants
- Location reads 80/100 on livability (#31 in TX, #1,616 nationally) — a professional / high-income tenant draw. Strengths: amenities A+, commute A+, cost of living A+; Watch: crime F.
- North East ISD (urban): math 38% / reading 49% proficiency, ranked #276 of 826 in TX (top 33%) — families likely to look elsewhere, expect single-tenant / working-renter base with shorter leases.
- Zoned schools: Walzem El (math 21% / reading 27%, grade F, #3,221 of 4,322 statewide, top 75%, 660 students, 89% FRL); Roosevelt H S (math 20% / reading 40%, grade F, #1,096 of 1,632 statewide, top 68%, 2,599 students, 72% FRL) — zoned schools average 80% FRL vs 41% district-wide (39 pts higher); higher-poverty schools than district average — tighter screening recommended.
- Zoned-school proficiency averages 27% at this address vs 44% district-wide (-16 pts) — the specific schools serving this property underperform the North East ISD average; the district grade overstates school quality for this exact location.
- Market conditions: Rents falling (-5.6%/yr); 131 active listings in the ZIP; 40 comparable units currently listed for rent nearby; rentals at typical pace (median 17d on market — plan ~3-4 weeks tenant-placement turnaround); 8,308 units permitted in Bexar County in 2024 (2,506 in 5+ unit buildings).
- This rent runs 33% of the median local income ($57k/yr) — at the standard rent-burdened threshold; future hikes will face affordability resistance.
Forward outlook
- Local home prices are declining (-3.0%/yr); year-one equity from $726 of loan paydown is wiped out by about $3k of value loss. Plan a longer hold.
- Bexar County population projected at +50% by 2050 — long-run rental-demand tailwind backs the buy-and-hold thesis.
Negotiation context
- It's been on market 29 days — a 2% lower offer ($103k) is reasonable based on typical stale-listing flexibility.
Risks & watch-outs
- Watch-outs: property tax is 4.0% of price; built in 1956 — expect roof / HVAC / electrical / plumbing capex.
- Climate carrying-cost: severe wind risk, 80% chance of damaging wind over 30y; extreme-heat days projected 7→22/yr by 2055 (HVAC capex compounding) — expect insurance premiums to compound above CPI over the hold.
Questions for the listing agent
- Built in 1956 — when were the roof, HVAC, electrical panel, plumbing, and water heater last replaced?
- Property tax is high relative to price — has the assessment been appealed recently, and will the sale trigger a re-assessment?
- Is there a deadline driving the sale (1031 exchange, divorce, estate, relocation)? That informs how much negotiation room exists.
- Crime grade is F in this area — have there been break-ins, vandalism, or insurance claims at this property in the last 3 years? What carrier currently insures it and at what premium?
- What's the average days-on-market for RENTAL listings here right now (not sales)? A rising rental-DOM trend means longer vacancies and softer asking-rent achievability than the comps imply.
- What's the recent tenant-quality profile in this submarket — average credit score on applications, eviction rate, late-payment / NSF rate, and stable-employment percentage? A property-management company in the area should have these aggregated.
- How much new for-sale + rental construction is in the pipeline within 1–3 miles? Heavy new supply typically softens prices + rents 12–24 months out; constrained supply supports both.
Investment metrics
- 1% rule
- 1.48% ✓
- Cap rate
- 9.54%
- Cash-on-cash
- 11.58%
- DSCR
- 1.52
- GRM
- 5.6
CMA / ARV
- ARV (median comp)
- $184,638
- List price
- $105,000
- Delta
- -43.13%
- Verdict
- UNDERPRICED
- Comps
- 20 within 1.0 mi
Show comp detail 12 sales within ~0.75 mi
| Address | Dist | Beds/Ba | Sqft | Sold | Price | $/sf | Match |
|---|---|---|---|---|---|---|---|
| 559 Artemis | 0.25mi | 3/2.0 | 1,435 (+3%) | 6mo | $230,000 | $160 | 75 |
| 911 Elkhorn | 0.25mi | 3/2.0 | 1,448 (+4%) | 8mo | $149,900 | $104 | 72 |
| 526 Radiance | 0.12mi | 3/2.0 | 1,212 (-13%) | 9mo | $189,900 | $157 | 61 |
| 410 Blaze | 0.26mi | 3/2.0 | 1,229 (-12%) | 4mo | $189,900 | $155 | 61 |
| 7206 Glendora | 0.50mi | 4/1.0 (+1) | 1,292 (-7%) | 3mo | $150,000 | $116 | 57 |
| 202 Covina Ave | 0.49mi | 4/2.5 (+1) | 1,492 (+7%) | 4mo | $245,000 | $164 | 52 |
| 4538 Waikiki | 0.65mi | 3/2.0 | 1,524 (+9%) | 0mo | $220,000 | $144 | 50 |
| 130 Bobby Lou | 0.36mi | 2/1.0 (-1) | 1,188 (-15%) | 6mo | $159,500 | $134 | 49 |
| 5002 Prince Valiant | 0.71mi | 4/2.0 (+1) | 1,332 (-4%) | 4mo | $210,000 | $158 | 47 |
| 5003 Round Table | 0.72mi | 3/2.0 | 1,521 (+9%) | 6mo | $215,900 | $142 | 42 |
| 4334 Diamondhead | 0.57mi | 3/2.0 | 1,204 (-14%) | 10mo | $174,900 | $145 | 38 |
| 4411 Bikini Dr | 0.70mi | 3/2.0 | 1,212 (-13%) | 9mo | $215,000 | $177 | 34 |
Match score weights: distance 35% · size 25% · config 20% · recency 20%. Top-matched comps best support the ARV.
Projected returns pro-forma
-3.0% appreciation · 0.0% rent growth · sell at horizon
- IRR
- -3.1%
- Equity multiple
- 0.89×
- Total profit
- $-3,336
- Equity at exit
- $15,656
- IRR
- 1.9%
- Equity multiple
- 1.12×
- Total profit
- $3,406
- Equity at exit
- $9,078
Cash invested: $29,400 (down + closing). Projections, not guarantees.
Landlord ↔ Tenant lean methodology
- Overall (STATE)
- 87 Strongly Landlord-Friendly
- State Texas
- 87 Strongly Landlord-Friendly · R+5
- County
- — inherits STATE
- City
- — inherits STATE
ZIP-level market 78218
- Home prices YoY
- -16.1%
- Rents YoY
- -5.6%
- Active inventory
- 131
- Price-to-rent
- 5.6×
Monthly cashflow live
- Estimated rent
- $1,554 high interval (Pro) →
- Mortgage (P&I)
- −$551
- Tax from tax record
- −$350 /mo · $4,198/yr
- Insurance
- −$44
- HOA
- −$0
- Vacancy / Maint / Mgmt
- −$326
- Net cashflow
- $284
Break-even live
UW: 25.0% down · 7.5% · 30yr · 1.5% tax · 5.0% vac · 8.0% maint · 8.0% mgmt
Financing live
Cash to close
- Down payment
- $26,250
- Closing costs
- $3,150
- Reserves months
- —
- Total cash needed
- —
Loan-product check · same deal, 3 products live
Conventional
25% down · 7.5% · 30yr
- Down + closing
- —
- Monthly P&I
- —
- Monthly cashflow
- —
- DSCR
- —
- Eligible?
- —
Personal DTI + credit; lowest rate.
DSCR
20% down · 8.5% · 30yr
- Down + closing
- —
- Monthly P&I
- —
- Monthly cashflow
- —
- DSCR
- —
- Eligible?
- —
No personal income docs; deal must DSCR.
Hard money
10% down · 12.0% · 12mo
- Down + closing
- —
- Monthly P&I
- —
- Monthly cashflow
- —
- DSCR
- —
- Eligible?
- —
Short-term bridge; refi at stabilization.
Rent comps 40 comps
| Address | Beds | Baths | Sqft | Rent | $/sqft | DOM | Units | Dist |
|---|---|---|---|---|---|---|---|---|
| 538 Lanark Dr San Antonio, TX | 2.0 | 1.0 | 987 | $1,295 | $1.31 | 16d | 1 | 0.11mi |
| 538 Lanark Dr San Antonio, TX | 2.0 | 1.0 | 987 | $1,295 | $1.31 | 24d | 1 | 0.11mi |
| 143 Huxley Dr San Antonio, TX | 3.0 | 2.0 | 1290 | $2,000 | $1.55 | 24d | 1 | 0.25mi |
| 547 Cicero Ave Unit NA San Antonio, TX | 3.0 | 2.0 | 1500 | $1,525 | $1.02 | 43d | 1 | 0.29mi |
| 343 Blaze Ave San Antonio, TX | 3.0 | 2.0 | 1438 | $1,750 | $1.22 | 16d | 1 | 0.35mi |
| 2355 Austin Hwy Apt 710 San Antonio, TX | 2.0 | 2.0 | 908 | $881 | $0.97 | 3d | 1 | 0.43mi |
| 206 Covina Ave San Antonio, TX | 3.0 | 2.0 | 1332 | $2,000 | $1.50 | 24d | 1 | 0.51mi |
| 4511 Diamondhead Dr San Antonio, TX | 4.0 | 2.5 | 1829 | $2,050 | $1.12 | 7d | 1 | 0.57mi |
| 106 Covina Ave San Antonio, TX | 3.0 | 2.0 | 1421 | $2,000 | $1.41 | 2d | 1 | 0.62mi |
| 4207 Waikiki Dr San Antonio, TX | 3.0 | 2.0 | 1144 | $1,475 | $1.29 | 43d | 1 | 0.70mi |
| 5014 Galahad Dr San Antonio, TX | 4.0 | 2.0 | 1400 | $1,900 | $1.36 | 2d | 1 | 0.73mi |
| 2600 NE Interstate 410 Loop Unit 710 San Antonio, TX | 2.0 | 2.0 | 951 | $1,042 | $1.10 | 3d | 1 | 0.74mi |
| 6347 Kingston Dr San Antonio, TX | 3.0 | 2.0 | 1672 | $1,800 | $1.08 | 4d | 1 | 0.76mi |
| 5031 Lancelot Dr San Antonio, TX | 3.0 | 2.0 | 1340 | $1,395 | $1.04 | 44d | 1 | 0.80mi |
| 4102 Waikiki Dr San Antonio, TX | 3.0 | 1.0 | 1167 | $1,395 | $1.20 | 14d | 1 | 0.81mi |
| 2554 NE Interstate 410 Loop Unit 710 San Antonio, TX | 2.0 | 2.0 | 988 | $1,047 | $1.06 | 3d | 1 | 0.84mi |
| 6810 Glendora Ave Unit 15 San Antonio, TX | 2.0 | 1.0 | 1000 | $865 | $0.86 | 43d | 1 | 0.85mi |
| 4310 Judivan San Antonio, TX | 3.0 | 2.0 | 1859 | $2,300 | $1.24 | 19d | 1 | 0.94mi |
| 5134 Gawain Dr San Antonio, TX | 3.0 | 2.0 | 1488 | $1,750 | $1.18 | 17d | 1 | 1.03mi |
| 2607 NE Interstate 410 Loop San Antonio, TX | 3.0 | 1.0 | 1200 | $1,120 | $0.93 | 43d | 1 | 1.07mi |
| 5202 Gawain Dr San Antonio, TX | 2.0 | 1.0 | 1100 | $1,075 | $0.98 | 11d | 1 | 1.11mi |
| 842 Corinne Dr #21 San Antonio, TX | 3.0 | 2.0 | 1248 | $49,000 | $39.26 | 22d | 1 | 1.12mi |
| 3730 La Sabre Dr San Antonio, TX | 4.0 | 2.0 | 1434 | $1,900 | $1.32 | 43d | 1 | 1.22mi |
| 4431 Myrna Dr San Antonio, TX | 2.0 | 2.0 | 1186 | $1,035 | $0.87 | 15d | 1 | 1.24mi |
| 4811 Village Vw San Antonio, TX | 3.0 | 2.0 | 1288 | $1,450 | $1.13 | 7d | 1 | 1.25mi |
| 5143 Village Lawn San Antonio, TX | 3.0 | 1.5 | 1008 | $1,450 | $1.44 | 22d | 1 | 1.27mi |
| 5306 Gawain Dr Unit 5308 San Antonio, TX | 2.0 | 2.0 | 912 | $1,195 | $1.31 | 43d | 1 | 1.31mi |
| 5308 Gawain Dr San Antonio, TX | 2.0 | 2.0 | 912 | $1,195 | $1.31 | 43d | 1 | 1.31mi |
| 5130 Village Green San Antonio, TX | 3.0 | 1.0 | 1620 | $1,350 | $0.83 | 16d | 1 | 1.31mi |
| 5315 Gawain Dr Unit 710 San Antonio, TX | 2.0 | 2.0 | 944 | $1,081 | $1.15 | 3d | 1 | 1.32mi |
| 5310 Gawain Dr San Antonio, TX | 2.0 | 2.0 | 912 | $1,099 | $1.21 | 24d | 1 | 1.32mi |
| 8731 Tradewind Dr Windcrest, TX | 3.0 | 2.5 | 1750 | $1,350 | $0.77 | 15d | 1 | 1.32mi |
| 5100 Eisenhauer Rd Unit 710 San Antonio, TX | 2.0 | 2.0 | 1088 | $1,204 | $1.11 | 3d | 1 | 1.34mi |
| 3623 Invicta Dr San Antonio, TX | 3.0 | 2.0 | 1688 | $1,695 | $1.00 | 2d | 1 | 1.36mi |
| 1006 Sumner Dr San Antonio, TX | 3.0 | 2.0 | 1314 | $1,697 | $1.29 | 24d | 1 | 1.44mi |
| 8623 Starcrest Dr Unit 710 San Antonio, TX | 2.0 | 2.0 | 1292 | $1,357 | $1.05 | 3d | 1 | 1.44mi |
| 8623 Starcrest Dr Unit P05 San Antonio, TX | 2.0 | 1.0 | 986 | $1,099 | $1.11 | 3d | 1 | 1.44mi |
| 8623 Starcrest Dr Apt X1 San Antonio, TX | 2.0 | 2.0 | 1453 | $1,549 | $1.07 | 3d | 1 | 1.44mi |
| 8623 Starcrest Dr Apt Y8 San Antonio, TX | 2.0 | 2.0 | 1325 | $1,349 | $1.02 | 3d | 1 | 1.44mi |
| 8623 Starcrest Dr Unit X07 San Antonio, TX | 2.0 | 1.0 | 1082 | $1,225 | $1.13 | 15d | 1 | 1.44mi |
Listing history 10 events
-
2026-06-10status $105,000 Pending 29 DOM
-
2026-06-09days on market $105,000 Active Option 29 DOM
-
2026-06-08days on market $105,000 Active Option 28 DOM
-
2026-06-07days on market $105,000 Active Option 27 DOM
-
2026-06-04days on market $105,000 Active Option 24 DOM
-
2026-06-03days on market $105,000 Active Option 23 DOM
-
2026-06-02days on market $105,000 Active Option 22 DOM
-
2026-06-01days on market $105,000 Active Option 21 DOM
-
2026-05-31days on market $105,000 Active Option 20 DOM
-
2026-04-15$105,000 New 460-char remark
ⓘ Source: listings_history table (triggers on properties + properties_extension) + one-shot
backfill from property_details.listing_events for pre-trigger history.
Tax reassessment forecast TX · Resets to sale price
- Current annual tax
- $4,198 · $350/mo
- Projected year-2 tax
- $4,198 · $350/mo
- Expected delta
- $0/yr ($0/mo · 0.0%)
ⓘ Screening estimate from a state-policy table — verify with the county assessor before closing.
Climate risk First Street
- Flood 1/10 Low FEMA zone X (unshaded) · 0% chance over 30 yrs
- Wildfire 1/10 Low
- Heat 8/10 Severe 7 d/yr ≥108°F today · 22 d/yr by 30 yrs out
- Wind 8/10 Severe 80% chance of damaging wind over 30 yrs
- Air quality 2/10 Low 0 unhealthy d/yr today · 1 by 30 yrs out
Nearby sold comps map
Loading sold comps map…
Walkable amenities ~0.75 mi
Loading nearby amenities…
Taxation est. · year 1
- Rental income
- $18,654
- − Mortgage interest
- −$5,882
- − Property taxes
- −$4,198
- − Insurance
- −$525
- − Repairs & maintenance
- −$1,492
- − Management
- −$1,492
- − Depreciation
- −$3,055
- Taxable income
- $2,010
- Est. tax owed @ 24.0%
- −$482
- After-tax cash flow
- $2,923/yr
For passive investors: Depreciation is non-cash, so a rental often shows a tax loss while cash-flowing — sheltering income. Rental losses are passive: they offset passive income freely, and up to $25,000/yr can offset ordinary (W-2) income if you actively participate and your MAGI is under $100k (phasing out to $0 by $150k); unused losses carry forward. On sale, claimed depreciation is recaptured at up to 25%, and gains may owe capital-gains tax (a 1031 exchange can defer both). Figures are a year-1 estimate at your 24.0% rate — not tax advice; consult a CPA.
Schools (NCES district)
- District
- North East ISD
- NCES district ID
- 4832940
- Math proficiency
- 38% ▼ -14.00%
- Reading proficiency
- 49% ▼ -4.00%
- Median HH income
- $57,715
- Composite
- 38.1/100
- National rank
- #4276
- State rank
- #276 of 826 in TX
Livability — San Antonio
- Score
- 80/100
- State rank
- #31
- US rank
- #1616
Category grades
Schools grade is shown separately in the Schools card above.
Census & demographics
- Census place
- San Antonio, TX
- County
- Bexar County · 1,990,555 people
- City population
- 1,806,925
- Metro
- San Antonio-New Braunfels, TX
- Population (ZIP)
- 39,428
- Household income
- $57,285
- Rent vs Own
- Severe rent burden
- 2508.0
Population outlook (Bexar County) Hauer SSP2
- Today (2025)
- 2,336,851 people
- By 2030
- 2,560,728 · +9.6%
- By 2040
- 3,020,569 · +29.3%
- By 2050
- 3,493,522 · +49.5%
- By 2075
- 4,668,459 · +99.8%
- By 2100
- 5,533,242 · +136.8%
Race, ethnicity, and origin ACS 2023
- Neighborhood character
- Diverse neighborhood (Simpson 0.64)
- Race & ethnicity
- Hispanic / Latino 53% Two or more races 26% White 25% Black 14% Asian 3% Native American 2%
- Hispanic origin (detail)
- Mexican 41% Puerto Rican 3%
- Common ancestry
- Serbian 2% Italian 1% Romanian 1%
- Foreign-born
- 18% · Canada, Vietnam, China
- Languages at home
- 60% English-only · Spanish 34% Vietnamese 1% Other Asian/Pacific 1%
Political lean MEDSL · Bexar
- 2024 margin
- Lean D (+9.8) · D 54.3% · R 44.6% · Other 1.1%
- 2008→2024 swing
- +4.2pp toward D · 2008: 5.6pp · 2024: 9.8pp
- All cycles
- 2024: D+9.8 2020: D+18.2 2016: D+13.5 2012: D+4.6 2008: D+5.6
Not yet ingested
- Civics
- —
Market trends
- HPI YoY
- ▼ -52.17%
- Current HPI
- 271.2807
- Rent YoY
- ▼ -5.56%
- Metro
- San Antonio-New Braunfels, TX
- State GDP YoY
- ▲ 3.95%
- F500 in state
- 110
Industry mix (Fortune 500 HQ in TX)
| Industry | F500 HQs | Revenue |
|---|---|---|
| Energy | 16 | $1,198B |
|
||
| Technology | 5 | $198B |
|
||
| Engineering / Construction | 4 | $72B |
|
||
| Energy Services | 3 | $60B |
|
||
| Utilities | 3 | $41B |
|
||
| Healthcare | 2 | $330B |
|
||
Price history
3 events — show timeline
- 2026-06-09 Pending — LERA
- 2026-05-24 Contingent — LERA
- 2026-04-15 Listed $105,000 LERA
Property tax history
+7.6%/yrLatest (2025): $4,198 · +3.6% YoY. Source: county tax records.
Cash-flow waterfall
monthlySold comps — $/sqft
last 12 mo · ≤1 miLoading sold comps…