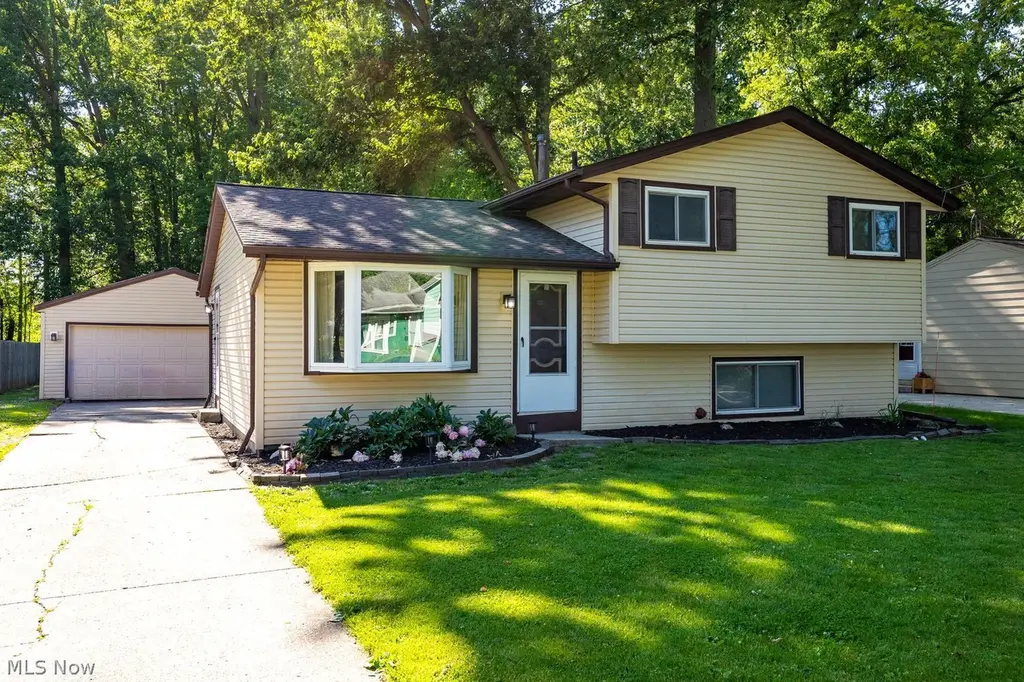
5654 Olive Ave · North Ridgeville, OH
Flood risk 1/10 · Minimal
- FEMA flood zone
- X (shaded)
- Chance of flooding over 30 yrs
- 0.0%
- Est. flood insurance / yr
- $473 – $860
Fire risk 1/10 · Minimal
- Est. fire insurance / yr
- $713 – $1,323
Heat risk 2/10 · Minimal
- Hot days now (above 96°F)
- 7 days/yr
- Hot days in 30 yrs
- 16 days/yr
Wind risk 1/10 · Minimal
- Chance of severe wind over 30 yrs
- —
Air-quality risk 2/10 · Minimal
- Unhealthy air days now
- 1 days/yr
- Unhealthy air days in 30 yrs
- 3 days/yr
Risk factors via First Street. Map © Google.
Why this score? — see what drove the F grade
The composite is a weighted blend of 9 inputs, each scored 0–100. Each bar is that input's sub-score; the figure is the points it added to the 100-point composite (weight × sub-score).
- Cash flow +13.1/30.0
- Schools +4.8/10.0
- DSCR +3.9/10.0
- Livability +3.7/5.0
- 1% rule +3.3/10.0
- Rent growth +2.5/5.0
- Condition / age +2.5/5.0
- ARV discount +0.0/15.0
- Appreciation +0.0/10.0
$258,500
🖨 Deal sheet (PDF) 📄 Offer letter ✓ Due diligence
Listing remarks MLS
Discover this wonderfully updated split-level home on a quiet street! As you enter, you will immediately notice the newer flooring throughout - luxury vinyl on the first floor, ceramic tile in the lower level and carpet upstairs. Updated kitchen includes butcher block counters and new appliances. Both bathrooms have been updated as well. New furnace and air conditioner (added by seller). Beautiful fixtures throughout. Large 2 car garage is an excellent additional feature. Deep partially wooded lot with an above ground pool. One year home warranty is included for your peace of mind! There is a transferable waterproofing warranty as well. Sump pump and battery backup! Schedule your private showing today!
Key facts
- Outdoor pool
- Wood mantel
- Digital wall safe
Tags
Neighborhood map
What this means for you Summary
Snapshot
- This is a 3-bed/1.5-bath single-family listed at $258k.
Deal economics
- At list price, monthly cash flow is $-8 ($-93/yr) — negative.
- To cash-flow at today's rent, offer at most $257k (0.5% below list).
- To meet the 1% rule (rent ≥ 1% of price), the offer needs to be $215k (17.0% below list).
- Recommended offer: $215k (17.0% below list) — sets the bar for 1% rule.
- Cap rate 6.3% vs local median 3.3% in North Ridgeville — top-decile yield for the area; either an underpriced asset or a hidden risk that comps aren't pricing in. Stress-test before assuming the spread holds.
Location & tenants
- Location reads 74/100 on livability (#305 in OH, #4,924 nationally) — a middle-class / working-renter tenant base. Strengths: employment A+, cost of living A+, housing A+; Watch: health & safety D, amenities F, commute F.
- North Ridgeville City (suburban): math 49% / reading 61% proficiency, ranked #339 of 656 in OH (top 52%) — acceptable for families but not a draw, mixed tenant base, ~2y average lease; only 20% free/reduced lunch — higher-income household profile.
- Market conditions: 202 active listings in the ZIP; 6 comparable units currently listed for rent nearby; rentals at typical pace (median 21d on market — plan ~3-4 weeks tenant-placement turnaround); solid renter incomes; 1,098 units permitted in Lorain County in 2024 (20 in 5+ unit buildings).
Forward outlook
- Local home prices are declining (-3.0%/yr); year-one equity from $2k of loan paydown is wiped out by about $8k of value loss. Plan a longer hold.
Negotiation context
- It's been on market 23 days — a 2% lower offer ($255k) is reasonable based on typical stale-listing flexibility.
- 6 sale attempts since 29y ago; this cycle's ask has dropped $16k (6%) from the opening price — seller is motivated, your offer sets the floor, not the list.
Questions for the listing agent
- What do current leases actually rent for vs. the listed asking? Can we see a recent rent roll and the last 12 months of T-12 income?
- Built in 1972 — when were the roof, HVAC, electrical panel, plumbing, and water heater last replaced?
- Is there a deadline driving the sale (1031 exchange, divorce, estate, relocation)? That informs how much negotiation room exists.
- Schools are A-rated — typically a magnet for longer-tenancy family renters. What's the average tenant stay here, and is there a school-zone premium baked into asking?
- The area grade is low — what's the realistic commute time and amenity access for the typical tenant pool here? Any planned neighborhood developments (good or bad) we should know about?
- What's the average days-on-market for RENTAL listings here right now (not sales)? A rising rental-DOM trend means longer vacancies and softer asking-rent achievability than the comps imply.
- What's the recent tenant-quality profile in this submarket — average credit score on applications, eviction rate, late-payment / NSF rate, and stable-employment percentage? A property-management company in the area should have these aggregated.
- How much new for-sale + rental construction is in the pipeline within 1–3 miles? Heavy new supply typically softens prices + rents 12–24 months out; constrained supply supports both.
Investment metrics
- 1% rule
- 0.83% ✗
- Cap rate
- 6.26%
- Cash-on-cash
- -0.13%
- DSCR
- 0.99
- GRM
- 10.0
CMA / ARV
- ARV (on-the-fly)
- $213,426
- Comps found
- 12
Show comp detail 12 sales within ~0.75 mi
| Address | Dist | Beds/Ba | Sqft | Sold | Price | $/sf | Match |
|---|---|---|---|---|---|---|---|
| 5906 Cornell Blvd | 0.26mi | 3/1.0 | 1,230 (-4%) | 3mo | $230,000 | $187 | 77 |
| 5785 Deborah Dr | 0.22mi | 3/1.0 | 1,404 (+10%) | 1mo | $235,000 | $167 | 70 |
| 5577 Main Ave | 0.64mi | 4/1.5 (+1) | 1,296 (+1%) | 1mo | $233,612 | $180 | 62 |
| 6044 Main Ave | 0.69mi | 3/1.5 | 1,248 (-2%) | 8mo | $166,500 | $133 | 58 |
| 5482 Pleasant St | 0.74mi | 3/1.5 | 1,292 (+1%) | 10mo | $233,000 | $180 | 55 |
| 5724 Main Ave | 0.60mi | 2/1.0 (-1) | 1,338 (+5%) | 2mo | $174,500 | $130 | 55 |
| 6180 Olive Ave | 0.51mi | 4/2.0 (+1) | 1,196 (-6%) | 7mo | $230,100 | $192 | 53 |
| 35109 Drake St | 0.43mi | 3/2.0 | 1,420 (+11%) | 8mo | $162,000 | $114 | 53 |
| 5861 Lee Ave | 0.67mi | 4/1.5 (+1) | 1,428 (+12%) | 7mo | $239,000 | $167 | 38 |
| 5835 Broad Blvd | 0.70mi | 3/1.5 | 1,460 (+14%) | 7mo | $227,000 | $155 | 38 |
| 5965 Rosebelle Ave | 0.72mi | 3/1.5 | 1,428 (+12%) | 11mo | $232,000 | $162 | 38 |
| 6323 Olive Ave | 0.64mi | 2/1.0 (-1) | 1,112 (-13%) | 10mo | $169,900 | $153 | 33 |
Match score weights: distance 35% · size 25% · config 20% · recency 20%. Top-matched comps best support the ARV.
Projected returns pro-forma
-3.0% appreciation · 3.0% rent growth · sell at horizon
- IRR
- -16.5%
- Equity multiple
- 0.41×
- Total profit
- $-42,398
- Equity at exit
- $38,543
- IRR
- -8.3%
- Equity multiple
- 0.48×
- Total profit
- $-37,628
- Equity at exit
- $22,350
Cash invested: $72,380 (down + closing). Projections, not guarantees.
Landlord ↔ Tenant lean methodology
- Overall (STATE)
- 73 Landlord-Friendly
- State Ohio
- 73 Landlord-Friendly · R+6
- County
- — inherits STATE
- City
- — inherits STATE
ZIP-level market 44039
- Active inventory
- 202
- Price-to-rent
- 10.0×
Monthly cashflow live
- Estimated rent
- $2,147 high interval (Pro) →
- Mortgage (P&I)
- −$1,356
- Tax from tax record
- −$240 /mo · $2,882/yr
- Insurance
- −$108
- HOA
- −$0
- Vacancy / Maint / Mgmt
- −$451
- Net cashflow
- $-8
Break-even live
Sensitivity live
| Price | -10% $139 | -5% $65 | +0% $-8 | +5% $-81 | +10% $-154 |
|---|---|---|---|---|---|
| Rent | -10% $-177 | -5% $-93 | +0% $-8 | +5% $77 | +10% $162 |
| Rate | -1.0pp $122 | -0.5pp $58 | base $-8 | +0.5pp $-75 | +1.0pp $-143 |
UW: 25.0% down · 7.5% · 30yr · 1.5% tax · 5.0% vac · 8.0% maint · 8.0% mgmt
Financing live
Cash to close
- Down payment
- $64,625
- Closing costs
- $7,755
- Reserves months
- —
- Total cash needed
- —
Loan-product check · same deal, 3 products live
Conventional
25% down · 7.5% · 30yr
- Down + closing
- —
- Monthly P&I
- —
- Monthly cashflow
- —
- DSCR
- —
- Eligible?
- —
Personal DTI + credit; lowest rate.
DSCR
20% down · 8.5% · 30yr
- Down + closing
- —
- Monthly P&I
- —
- Monthly cashflow
- —
- DSCR
- —
- Eligible?
- —
No personal income docs; deal must DSCR.
Hard money
10% down · 12.0% · 12mo
- Down + closing
- —
- Monthly P&I
- —
- Monthly cashflow
- —
- DSCR
- —
- Eligible?
- —
Short-term bridge; refi at stabilization.
Rent comps 6 comps
| Address | Beds | Baths | Sqft | Rent | $/sqft | DOM | Units | Dist |
|---|---|---|---|---|---|---|---|---|
| 5922 Albert Ave North Ridgeville, OH | 3.0 | 1.5 | 1588 | $2,125 | $1.34 | 2d | 1 | 0.55mi |
| 5498 Broad Blvd North Ridgeville, OH | 3.0 | 1.5 | 1300 | $1,895 | $1.46 | 44d | 1 | 0.70mi |
| 6401 Forest Park Dr North Ridgeville, OH | 2.0 | 2.0 | 1180 | $1,900 | $1.61 | 8d | 1 | 0.94mi |
| 4710 Jaycox Rd Avon, OH | 3.0 | 2.0 | 1476 | $2,299 | $1.56 | 2d | 1 | 1.00mi |
| 6528 Rosebelle Ave North Ridgeville, OH | 3.0 | 1.0 | 1200 | $2,275 | $1.90 | 20d | 1 | 1.08mi |
| 6610 Lear Nagle Rd #157 North Ridgeville, OH | 3.0 | 2.0 | 1344 | $1,549 | $1.15 | 44d | 1 | 1.22mi |
Listing history 14 events
-
2026-06-21days on market $258,500 Active 23 DOM
-
2026-06-18days on market $258,500 Active 20 DOM
-
2026-06-17days on market $258,500 Active 19 DOM
-
2026-06-16days on market $258,500 Active 18 DOM
-
2026-06-15days on market $258,500 Active 17 DOM
-
2026-06-13pricedays on market $258,500 Active 15 DOM
-
2026-06-09days on market $263,900 Active 11 DOM
-
2026-06-08days on market $263,900 Active 10 DOM
-
2026-06-07days on market $263,900 Active 9 DOM
-
2026-06-05pricedays on market $263,900 Active 6 DOM
-
2026-06-03days on market $275,000 Active 5 DOM
-
2026-06-02days on market $275,000 Active 4 DOM
-
2026-06-01days on market $275,000 Active 3 DOM
-
2026-05-31days on market $275,000 Active 2 DOM
ⓘ Source: listings_history table (triggers on properties + properties_extension) + one-shot
backfill from property_details.listing_events for pre-trigger history.
Tax reassessment forecast OH · Partial reset (capped growth)
- Current annual tax
- $2,882 · $240/mo
- Projected year-2 tax
- $3,457 · $288/mo
- Expected delta
- +$575/yr (+$48/mo · 20.0%)
ⓘ Screening estimate from a state-policy table — verify with the county assessor before closing.
Climate risk First Street
- Flood 1/10 Low FEMA zone X (shaded) · 0% chance over 30 yrs
- Wildfire 1/10 Low
- Heat 2/10 Low 7 d/yr ≥96°F today · 16 d/yr by 30 yrs out
- Wind 1/10 Low
- Air quality 2/10 Low 1 unhealthy d/yr today · 3 by 30 yrs out
Nearby sold comps map
Loading sold comps map…
Walkable amenities ~0.75 mi
Loading nearby amenities…
Taxation est. · year 1
- Rental income
- $25,759
- − Mortgage interest
- −$14,480
- − Property taxes
- −$2,882
- − Insurance
- −$1,292
- − Repairs & maintenance
- −$2,061
- − Management
- −$2,061
- − Depreciation
- −$7,520
- Taxable loss
- −$4,537
- Est. tax savings @ 24.0%
- +$1,089
- After-tax cash flow
- $996/yr
For passive investors: Depreciation is non-cash, so a rental often shows a tax loss while cash-flowing — sheltering income. Rental losses are passive: they offset passive income freely, and up to $25,000/yr can offset ordinary (W-2) income if you actively participate and your MAGI is under $100k (phasing out to $0 by $150k); unused losses carry forward. On sale, claimed depreciation is recaptured at up to 25%, and gains may owe capital-gains tax (a 1031 exchange can defer both). Figures are a year-1 estimate at your 24.0% rate — not tax advice; consult a CPA.
Schools (NCES district)
- District
- North Ridgeville City
- NCES district ID
- 3904453
- Math proficiency
- 49% ▼ -21.00%
- Reading proficiency
- 61% ▼ -11.00%
- Median HH income
- $66,437
- Composite
- 48.46/100
- National rank
- #2130
- State rank
- #339 of 656 in OH
Livability — North Ridgeville
- Score
- 74/100
- State rank
- #305
- US rank
- #4924
Category grades
Schools grade is shown separately in the Schools card above.
Census & demographics
- Census place
- North Ridgeville, OH
- County
- Lorain County · 219,437 people
- City population
- 36,780
- Metro
- Cleveland-Elyria, OH
- Population (ZIP)
- 36,780
- Household income
- $96,485
- Rent vs Own
- Severe rent burden
- 207.0
Population outlook (Lorain County) Hauer SSP2
- Today (2025)
- 314,924 people
- By 2030
- 317,546 · +0.8%
- By 2040
- 317,962 · +1.0%
- By 2050
- 312,872 · -0.7%
- By 2075
- 301,806 · -4.2%
- By 2100
- 278,271 · -11.6%
Race, ethnicity, and origin ACS 2023
- Neighborhood character
- Predominantly White (87%)
- Race & ethnicity
- White 87% Hispanic / Latino 7% Two or more races 6% Black 2% Asian 1%
- Hispanic origin (detail)
- Mexican 2% Puerto Rican 3%
- Common ancestry
- Romanian 9% Slovak 3% Lithuanian 3%
- Foreign-born
- 5% · Canada
- Languages at home
- 94% English-only · Spanish 4% Other Indo-European 1%
Political lean MEDSL · Lorain
- 2024 margin
- Lean R (+5.7) · D 46.7% · R 52.4%
- 2008→2024 swing
- -23.6pp toward R · 2008: 17.9pp · 2024: -5.7pp
- All cycles
- 2024: R+5.7 2020: R+2.5 2016: R+0.3 2012: D+14.4 2008: D+17.9
Not yet ingested
- Civics
- —
Market trends
- HPI YoY
- ▼ -160.14%
- Current HPI
- 210.6074
- Rent YoY
- —
- Metro
- Cleveland-Elyria, OH
- State GDP YoY
- ▲ 1.98%
- F500 in state
- 48
Industry mix (Fortune 500 HQ in OH)
| Industry | F500 HQs | Revenue |
|---|---|---|
| Insurance | 3 | $145B |
|
||
| Industrial Machinery | 3 | $49B |
|
||
| Financial Services | 3 | $24B |
|
||
| Consumer Goods | 2 | $93B |
|
||
| Aerospace / Defense | 2 | $47B |
|
||
| Utilities | 2 | $33B |
|
||
Price history
+383.3% since first listed21 events — show timeline
- 2026-05-29 Listed $275,000 MLSNOW
- 2023-06-13 Sold (Public Records) $240,700 Public Records
- 2023-06-13 Sold (MLS) $240,611 MLSNOW
- 2023-05-15 Pending — MLSNOW
- 2023-05-10 Listed $225,000 MLSNOW
- 2020-09-24 Sold (MLS) $155,000 MLSNOW
- 2020-08-04 Pending — MLSNOW
- 2020-07-26 Price Changed $168,000 MLSNOW
- 2020-07-17 Price Changed $170,000 MLSNOW
- 2020-06-25 Price Changed $176,500 MLSNOW
- 2020-06-18 Listed $180,000 MLSNOW
- 2019-01-29 Listing Removed — MLSNOW
- 2018-08-22 Price Changed $159,000 MLSNOW
- 2018-07-29 Listed $162,000 MLSNOW
- 2008-03-01 Listing Removed — MLSNOW
- 2007-08-31 Listed $119,999 MLSNOW
- 2004-03-19 Sold (Public Records) $133,000 Public Records
- 1997-03-10 Sold (Public Records) $91,000 Public Records
- 1997-03-10 Sold (MLS) $91,000 MLSNOW
- 1997-01-29 Listed $95,000 MLSNOW
- 1987-09-30 Sold (Public Records) $56,900 Public Records
Property tax history
+3.1%/yrLatest (2025): $2,882 · -4.3% YoY. Source: county tax records.
Cash-flow waterfall
monthlySold comps — $/sqft
last 12 mo · ≤1 miLoading sold comps…