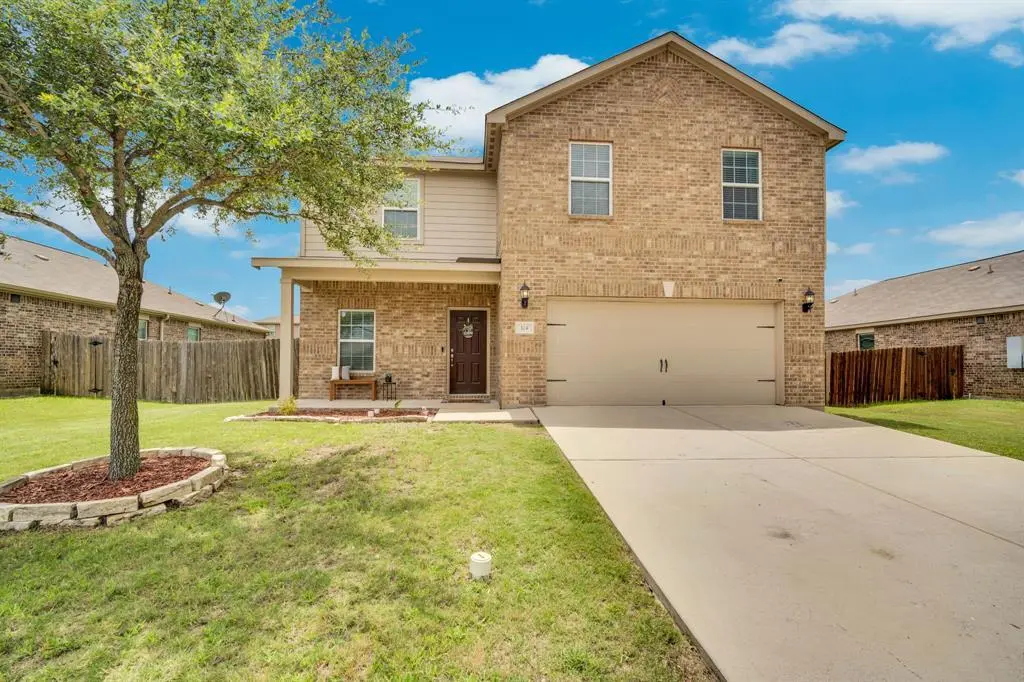
104 Liberty Ln · Venus, TX
Flood risk 1/10 · Minimal
- FEMA flood zone
- X (unshaded)
- Chance of flooding over 30 yrs
- 0.0%
- Est. flood insurance / yr
- $507 – $1,088
Fire risk 5/10 · Moderate
- Est. fire insurance / yr
- $1,222 – $2,270
Heat risk 7/10 · Major
- Hot days now (above 110°F)
- 7 days/yr
- Hot days in 30 yrs
- 25 days/yr
Wind risk 6/10 · Moderate
- Chance of severe wind over 30 yrs
- 27.0%
Air-quality risk 2/10 · Minimal
- Unhealthy air days now
- 2 days/yr
- Unhealthy air days in 30 yrs
- 2 days/yr
Risk factors via First Street. Map © Google.
Why this score? — see what drove the D- grade
The composite is a weighted blend of 9 inputs, each scored 0–100. Each bar is that input's sub-score; the figure is the points it added to the 100-point composite (weight × sub-score).
- Appreciation +8.7/10.0
- ARV discount +6.4/15.0
- Cash flow +5.9/30.0
- Schools +4.8/10.0
- Livability +3.5/5.0
- Rent growth +3.1/5.0
- Condition / age +2.5/5.0
- 1% rule +2.2/10.0
- DSCR +0.3/10.0
$315,000
🖨 Deal sheet 📄 Offer letter ✓ Due diligence
Listing remarks MLS
Fabulous Home Built in 2017 with Incredible Location within Midlothian ISD!! Chef's Eat-in Kitchen with Range-Oven, Granite Counter-tops, Stained Concrete Floors throughout the 1st Floor, Black Appliances, Breakfast Bar, Custom Cabinets & Room to Entertain any Occasion. Just Over 2,000 sqft with 3 Beds, 2.1 Full Baths, Main Open Living Concept, Recessed Lighting, New Fixtures, Large Dining & Oversized Master Suite, Gameroom Upstairs. Master includes Walk In Closet, Soaking Tub, Separate Shower, Ceramic Tile in All Wet Areas. Backyard Perfect for Outdoor Entertaining with Extended Patio Deck & Large Private Backyard with Extra Storage Building. Conveniently located to Restaurants, Shopping, Parks & Schools!!
Key facts
- Custom cabinetry
- Granite countertops
- 6,534 sq ft lot
Tags
Property features AI
Finance
- Other: Restrictions: Deed
- Financial info: Accepted financing: Cash, Conventional, FHA, VA Loan, Other
- HOA & community: Mandatory HOA with annual fee; Association fee covers full use of facilities and management fees; HOA managed by Legacy SW Property Mgmt
Exterior
- Parking: Attached 2-car garage with garage door opener (garage faces front); 2 covered parking spaces; Concrete driveway
- Security: No specific security features listed
- Utilities: City water; City sewer; Cable available; City power (electric)
- Home design: Single family residence; Residential property; Two-story; Entry level information not specified; Facing direction not specified
- Construction: Built in 2017; Slab foundation
- Exterior features: Private yard; Wood fencing; Landscaped; Interior lot; Located in a subdivision (Patriot Estates Ph 2); Community mailbox; Sidewalks
Interior
- Kitchen: Dishwasher; Disposal; Electric range; Microwave
- Bedrooms: 3 bedrooms (Primary bedroom located on 2nd level)
- Flooring: Carpet; Concrete
- Bathrooms: 2 full bathrooms; 1 half bathroom
- Heating & cooling: Central heating (electric); Central air (electric); Ceiling fan(s)
- Interior features: Open floorplan; Eat-in kitchen; Granite counters; Decorative lighting; Cable TV available; High speed internet available; Walk-in closet(s); Two living areas; One dining area; Total room count: 5; Levels: Two
- Laundry & utility: No specific laundry appliances listed
Neighborhood map
What this means for you Summary
Snapshot
- This is a 3-bed/2.5-bath single-family listed at $315k.
Deal economics
- At list price, monthly cash flow is $-616 ($-7k/yr) — negative.
- To cash-flow at today's rent, offer at most $206k (34.5% below list).
- To meet the 1% rule (rent ≥ 1% of price), the offer needs to be $225k (28.5% below list).
- Recommended offer: $206k (34.5% below list) — sets the bar for cash-flow.
- Cap rate 3.9% vs local median 3.0% in Venus — meaningfully above typical; check what's discounted (condition, days-on-market, listing class) to confirm the premium yield is real.
Location & tenants
- Location reads 70/100 on livability (#356 in TX) — a middle-class / working-renter tenant base. Strengths: crime A+, employment A+, cost of living A+; Watch: amenities F, commute F, health & safety F.
- Midlothian ISD (suburban): math 53% / reading 52% proficiency, ranked #94 of 826 in TX (top 11%) — acceptable for families but not a draw, mixed tenant base, ~2y average lease.
- Zoned schools: Irvin El (math 49% / reading 47%, grade D, #971 of 4,322 statewide, top 23%, 650 students, 54% FRL) — zoned schools average 54% FRL vs 22% district-wide (32 pts higher); higher-poverty schools than district average — tighter screening recommended.
- Market conditions: Rents rising (+2.4%/yr); 426 active listings in the ZIP; 22 comparable units currently listed for rent nearby; rentals leasing fast (median 7d on market — plan ~1-2 weeks tenant-placement turnaround); solid renter incomes; 3,016 units permitted in Ellis County in 2024 (20 in 5+ unit buildings).
Forward outlook
- In year one you build about $25k of equity ($2k loan paydown + $23k appreciation (7.3% local appreciation)).
- Ellis County population projected at +36% by 2050 — long-run rental-demand tailwind backs the buy-and-hold thesis.
- By year 2, paydown + projected appreciation supports a ~$40k cash-out refi (75% LTV) — recoverable capital for the next deal without selling this one.
Negotiation context
- Only 5 days on market — expect competitive offers; lowballing is unlikely to land.
- 4 sale attempts since 9y ago with the ask held roughly flat each time — persistent listings suggest the price (not the market) is what's stuck; bring a comps-based counter.
Risks & watch-outs
- Climate carrying-cost: major wind risk, 27% chance of damaging wind over 30y; moderate wildfire risk; extreme-heat days projected 7→25/yr by 2055 (HVAC capex compounding) — expect insurance premiums to compound above CPI over the hold.
Questions for the listing agent
- What do current leases actually rent for vs. the listed asking? Can we see a recent rent roll and the last 12 months of T-12 income?
- What does the HOA fee cover, when was the last increase, and are there any pending special assessments or reserve-fund shortfalls?
- Is there a deadline driving the sale (1031 exchange, divorce, estate, relocation)? That informs how much negotiation room exists.
- Schools are D-rated, which usually means shorter tenancies and higher turnover. Who's the typical renter profile here, and what's been the actual vacancy rate?
- The area grade is low — what's the realistic commute time and amenity access for the typical tenant pool here? Any planned neighborhood developments (good or bad) we should know about?
- What's the average days-on-market for RENTAL listings here right now (not sales)? A rising rental-DOM trend means longer vacancies and softer asking-rent achievability than the comps imply.
- What's the recent tenant-quality profile in this submarket — average credit score on applications, eviction rate, late-payment / NSF rate, and stable-employment percentage? A property-management company in the area should have these aggregated.
- How much new for-sale + rental construction is in the pipeline within 1–3 miles? Heavy new supply typically softens prices + rents 12–24 months out; constrained supply supports both.
Investment metrics
- 1% rule
- 0.72% ✗
- Cap rate
- 3.95%
- Cash-on-cash
- -8.38%
- DSCR
- 0.63
- GRM
- 11.7
CMA / ARV
- ARV (on-the-fly)
- $307,683
- Comps found
- 12
Show comp detail 12 sales within ~0.75 mi
| Address | Dist | Beds/Ba | Sqft | Sold | Price | $/sf | Match |
|---|---|---|---|---|---|---|---|
| 103 Presidents Way | 0.04mi | 4/2.5 (+1) | 2,135 (+6%) | 6mo | $300,000 | $141 | 78 |
| 106 Rushmore Ln | 0.20mi | 4/2.5 (+1) | 2,135 (+6%) | 4mo | $293,000 | $137 | 72 |
| 153 Jefferson Dr | 0.22mi | 3/2.5 | 2,228 (+11%) | 0mo | $289,500 | $130 | 71 |
| 137 Jefferson Dr | 0.26mi | 3/2.5 | 2,228 (+11%) | 6mo | $288,000 | $129 | 64 |
| 203 Julian Davis Dr | 0.59mi | 4/2.5 (+1) | 2,189 (+9%) | 3mo | $321,900 | $147 | 50 |
| 202 Julian Davis Dr | 0.61mi | 4/2.5 (+1) | 2,189 (+9%) | 2mo | $359,900 | $164 | 50 |
| 206 Julian Davis Dr | 0.61mi | 4/2.5 (+1) | 2,189 (+9%) | 3mo | $307,900 | $141 | 50 |
| 426 Gib Woodall Dr | 0.68mi | 4/2.5 (+1) | 2,189 (+9%) | 6mo | $344,900 | $158 | 43 |
| 414 Watson Ct | 0.56mi | 4/2.0 (+1) | 1,784 (-11%) | 6mo | $329,900 | $185 | 43 |
| 419 Watson Ct | 0.61mi | 4/2.0 (+1) | 1,784 (-11%) | 6mo | $314,900 | $177 | 41 |
| 321 Julian Davis Dr | 0.70mi | 4/2.0 (+1) | 1,784 (-11%) | 2mo | $329,900 | $185 | 40 |
| 502 Monroe Jackson St | 0.73mi | 4/2.0 (+1) | 1,791 (-11%) | 2mo | $274,000 | $153 | 39 |
Match score weights: distance 35% · size 25% · config 20% · recency 20%. Top-matched comps best support the ARV.
Projected returns pro-forma
7.32% appreciation · 2.39% rent growth · sell at horizon
- IRR
- 11.9%
- Equity multiple
- 1.86×
- Total profit
- $75,810
- Equity at exit
- $224,916
- IRR
- 12.3%
- Equity multiple
- 3.80×
- Total profit
- $246,755
- Equity at exit
- $433,383
Cash invested: $88,200 (down + closing). Projections, not guarantees.
Landlord ↔ Tenant lean methodology
- Overall (STATE)
- 87 Strongly Landlord-Friendly
- State Texas
- 87 Strongly Landlord-Friendly · R+5
- County
- — inherits STATE
- City
- — inherits STATE
ZIP-level market 76084
- Home prices YoY
- 2.1%
- Rents YoY
- 2.4%
- Active inventory
- 426
- Price-to-rent
- 11.7×
Monthly cashflow live
- Estimated rent
- $2,253 high interval (Pro) →
- Mortgage (P&I)
- −$1,652
- Tax from tax record
- −$575 /mo · $6,906/yr
- Insurance
- −$131
- HOA
- −$37
- Vacancy / Maint / Mgmt
- −$473
- Net cashflow
- $-616
Break-even live
UW: 25.0% down · 7.5% · 30yr · 1.5% tax · 5.0% vac · 8.0% maint · 8.0% mgmt
Financing live
Cash to close
- Down payment
- $78,750
- Closing costs
- $9,450
- Reserves months
- —
- Total cash needed
- —
Loan-product check · same deal, 3 products live
Conventional
25% down · 7.5% · 30yr
- Down + closing
- —
- Monthly P&I
- —
- Monthly cashflow
- —
- DSCR
- —
- Eligible?
- —
Personal DTI + credit; lowest rate.
DSCR
20% down · 8.5% · 30yr
- Down + closing
- —
- Monthly P&I
- —
- Monthly cashflow
- —
- DSCR
- —
- Eligible?
- —
No personal income docs; deal must DSCR.
Hard money
10% down · 12.0% · 12mo
- Down + closing
- —
- Monthly P&I
- —
- Monthly cashflow
- —
- DSCR
- —
- Eligible?
- —
Short-term bridge; refi at stabilization.
Rent comps 22 comps
| Address | Beds | Baths | Sqft | Rent | $/sqft | DOM | Units | Dist |
|---|---|---|---|---|---|---|---|---|
| 135 Houston Pl Venus, TX | 3.0 | 2.0 | 1590 | $2,029 | $1.28 | 1d | 1 | 0.05mi |
| 112 Liberty Ln Venus, TX | 4.0 | 2.0 | 1658 | $2,309 | $1.39 | 43d | 1 | 0.05mi |
| 108 Rushmore Ln Venus, TX | 4.0 | 2.0 | 1658 | $1,969 | $1.19 | 24d | 1 | 0.21mi |
| 640-644 Wheatfield DR Venus, TX | 4.0 | 2.0 | 1926 | $2,100 | $1.09 | 1d | 1 | 0.33mi |
| 170 Kennedy Dr Venus, TX | 4.0 | 2.0 | 1661 | $2,300 | $1.38 | 1d | 1 | 0.33mi |
| 131 Mt Vernon Ln Venus, TX | 3.0 | 2.0 | 1652 | $2,169 | $1.31 | 22d | 1 | 0.38mi |
| 628 Blackland Dr Venus, TX | 4.0 | 2.5 | 1483 | $2,200 | $1.48 | 1d | 1 | 0.38mi |
| 120 Mt Vernon Ln Venus, TX | 3.0 | 2.0 | 1661 | $2,149 | $1.29 | 43d | 1 | 0.42mi |
| 720 Blackland Dr Venus, TX | 4.0 | 2.5 | 1926 | $2,200 | $1.14 | 7d | 1 | 0.45mi |
| 101 Hancock St Venus, TX | 3.0 | 2.5 | 1773 | $1,929 | $1.09 | 1d | 1 | 0.48mi |
| 201 Julian Davis Dr Venus, TX | 3.0 | 2.5 | 1626 | $2,195 | $1.35 | 19d | 1 | 0.57mi |
| 208 Julian Davis Dr Venus, TX | 4.0 | 2.0 | 1784 | $2,330 | $1.31 | 11d | 1 | 0.59mi |
| 214 Julian Davis Dr Venus, TX | 4.0 | 2.0 | 1784 | $2,355 | $1.32 | 43d | 1 | 0.59mi |
| 147 Sammy Fowler Ave Venus, TX | 4.0 | 2.0 | 1690 | $2,250 | $1.33 | 1d | 1 | 0.79mi |
| 201 John Laurens Dr Venus, TX | 3.0–5.0 | 2.0–2.5 | 1975 | $2,250 | $1.14 | 1d | 1 | 0.81mi |
| 428 Condie Russell Ave Venus, TX | 4.0 | 2.0 | 1784 | $2,150 | $1.21 | 24d | 1 | 0.84mi |
| 523 Bennie Leonard St Venus, TX | 4.0 | 2.0 | 1690 | $2,350 | $1.39 | 1d | 1 | 0.86mi |
| 512 Albert Anthony St Venus, TX | 3.0 | 2.0 | 1658 | $1,990 | $1.20 | 22d | 1 | 0.88mi |
| 358 Condie Russell Ave Venus, TX | 3.0 | 2.0 | 1658 | $1,995 | $1.20 | 2d | 1 | 0.88mi |
| 325 Condie Russell Ave Venus, TX | 4.0 | 2.5 | 2189 | $2,325 | $1.06 | 12d | 1 | 0.88mi |
| 313 Patton Ln Venus, TX | 4.0 | 2.0 | 1784 | $2,355 | $1.32 | 7d | 1 | 1.04mi |
| 315 Patton Ln Venus, TX | 4.0 | 2.5 | 2173 | $2,515 | $1.16 | 3d | 1 | 1.05mi |
HOA detail
- Monthly dues
- $37 · $444/yr
Listing history 6 events
-
2026-06-18days on market $315,000 Active 5 DOM
-
2026-06-17days on market $315,000 Active 4 DOM
-
2026-06-16days on market $315,000 Active 3 DOM
-
2026-06-15days on market $315,000 Active 2 DOM
-
2026-06-13remarks 693-char remark
-
2026-06-13$315,000 Active 1 DOM
ⓘ Source: listings_history table (triggers on properties + properties_extension) + one-shot
backfill from property_details.listing_events for pre-trigger history.
Tax reassessment forecast TX · Resets to sale price
- Current annual tax
- $6,906 · $575/mo
- Projected year-2 tax
- $6,906 · $575/mo
- Expected delta
- $0/yr ($0/mo · 0.0%)
ⓘ Screening estimate from a state-policy table — verify with the county assessor before closing.
Climate risk First Street
- Flood 1/10 Low FEMA zone X (unshaded) · 0% chance over 30 yrs
- Wildfire 5/10 Major
- Heat 7/10 Severe 7 d/yr ≥110°F today · 25 d/yr by 30 yrs out
- Wind 6/10 Major 27% chance of damaging wind over 30 yrs
- Air quality 2/10 Low 2 unhealthy d/yr today · 2 by 30 yrs out
Nearby sold comps map
Loading sold comps map…
Walkable amenities ~0.75 mi
Loading nearby amenities…
Taxation est. · year 1
- Rental income
- $27,037
- − Mortgage interest
- −$17,645
- − Property taxes
- −$6,906
- − Insurance
- −$1,575
- − Repairs & maintenance
- −$2,163
- − Management
- −$2,163
- − HOA
- −$444
- − Depreciation
- −$9,164
- Taxable loss
- −$13,022
- Est. tax savings @ 24.0%
- +$3,125
- After-tax cash flow
- $-4,263/yr
For passive investors: Depreciation is non-cash, so a rental often shows a tax loss while cash-flowing — sheltering income. Rental losses are passive: they offset passive income freely, and up to $25,000/yr can offset ordinary (W-2) income if you actively participate and your MAGI is under $100k (phasing out to $0 by $150k); unused losses carry forward. On sale, claimed depreciation is recaptured at up to 25%, and gains may owe capital-gains tax (a 1031 exchange can defer both). Figures are a year-1 estimate at your 24.0% rate — not tax advice; consult a CPA.
Schools (NCES district)
- District
- Midlothian ISD
- NCES district ID
- 4830600
- Math proficiency
- 53% ▼ -7.00%
- Reading proficiency
- 52% ▼ -1.00%
- Median HH income
- $85,068
- Composite
- 48.22/100
- National rank
- #2165
- State rank
- #94 of 826 in TX
Livability — Venus
- Score
- 70/100
- State rank
- #356
- US rank
- #7724
Category grades
Schools grade is shown separately in the Schools card above.
Census & demographics
- Census place
- Venus, TX
- County
- Johnson County · 147,987 people
- Metro
- Dallas-Fort Worth-Arlington, TX
- Population (ZIP)
- 14,097
- Household income
- $102,115
- Rent vs Own
- Severe rent burden
- 70.0
Population outlook (Ellis County) Hauer SSP2
- Today (2025)
- 194,556 people
- By 2030
- 209,679 · +7.8%
- By 2040
- 238,837 · +22.8%
- By 2050
- 265,451 · +36.4%
- By 2075
- 326,571 · +67.9%
- By 2100
- 362,156 · +86.1%
Race, ethnicity, and origin ACS 2023
- Neighborhood character
- Diverse neighborhood (Simpson 0.63)
- Race & ethnicity
- White 52% Hispanic / Latino 30% Two or more races 24% Black 11% Asian 1%
- Hispanic origin (detail)
- Mexican 25% Puerto Rican 1%
- Common ancestry
- Romanian 2% Lithuanian 1% Slovak 1%
- Foreign-born
- 8% · Canada
- Languages at home
- 78% English-only · Spanish 18% Arabic 1% French/Haitian/Cajun 1%
Political lean MEDSL · Ellis
- 2024 margin
- Solid R (+31.1) · D 34.0% · R 65.1%
- 2008→2024 swing
- +11.2pp toward D · 2008: -42.2pp · 2024: -31.1pp
- All cycles
- 2024: R+31.1 2020: R+34.1 2016: R+45.4 2012: R+47.5 2008: R+42.2
Not yet ingested
- Civics
- —
Market trends
- HPI YoY
- ▲ 7.32%
- Current HPI
- 355.74
- Rent YoY
- ▲ 2.39%
- Metro
- Dallas-Fort Worth-Arlington, TX
- State GDP YoY
- ▲ 3.95%
- F500 in state
- 110
Industry mix (Fortune 500 HQ in TX)
| Industry | F500 HQs | Revenue |
|---|---|---|
| Energy | 16 | $1,198B |
|
||
| Technology | 5 | $198B |
|
||
| Engineering / Construction | 4 | $72B |
|
||
| Energy Services | 3 | $60B |
|
||
| Utilities | 3 | $41B |
|
||
| Healthcare | 2 | $330B |
|
||
Price history
+45.9% since first listed12 events — show timeline
- 2026-06-13 Listed $315,000 NTREIS
- 2021-09-20 Sold (Public Records) — Public Records
- 2021-09-18 Sold (MLS) — NTREIS
- 2021-08-30 Pending — NTREIS
- 2021-08-27 Contingent — NTREIS
- 2021-08-25 Listed $275,000 NTREIS
- 2017-06-30 Sold (MLS) — NTREIS
- 2017-04-19 Pending — NTREIS
- 2017-04-07 Listed $211,900 NTREIS
- 2017-04-01 Listing Removed — NTREIS
- 2017-03-09 Price Changed $216,900 NTREIS
- 2017-02-24 Listed $215,900 NTREIS
Property tax history
+45.7%/yrLatest (2025): $6,906 · +5.3% YoY. Source: county tax records.
Cash-flow waterfall
monthlySold comps — $/sqft
last 12 mo · ≤1 miLoading sold comps…