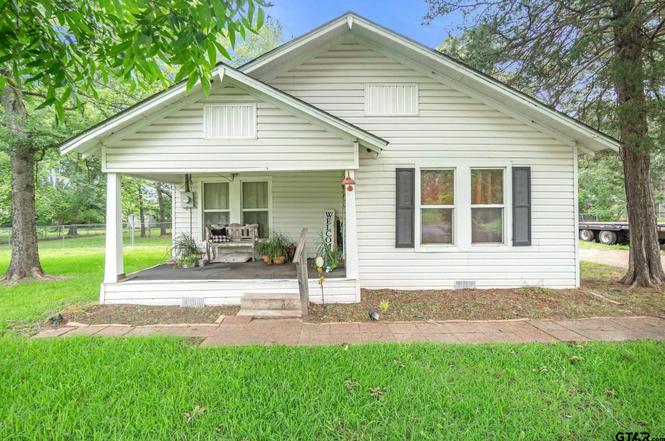
963 E Main St · Van, TX
Flood risk 1/10 · Minimal
- FEMA flood zone
- X (unshaded)
- Chance of flooding over 30 yrs
- 0.0%
- Est. flood insurance / yr
- $507 – $1,088
Fire risk 3/10 · Minor
- Est. fire insurance / yr
- $1,222 – $2,270
Heat risk 7/10 · Major
- Hot days now (above 109°F)
- 7 days/yr
- Hot days in 30 yrs
- 25 days/yr
Wind risk 6/10 · Moderate
- Chance of severe wind over 30 yrs
- 65.0%
Air-quality risk 2/10 · Minimal
- Unhealthy air days now
- 0 days/yr
- Unhealthy air days in 30 yrs
- 1 days/yr
Risk factors via First Street. Map © Google.
Why this score? — see what drove the C+ grade
The composite is a weighted blend of 9 inputs, each scored 0–100. Each bar is that input's sub-score; the figure is the points it added to the 100-point composite (weight × sub-score).
- Cash flow +20.5/30.0
- ARV discount +15.0/15.0
- 1% rule +7.5/10.0
- DSCR +6.5/10.0
- Schools +3.5/10.0
- Livability +3.4/5.0
- Rent growth +2.5/5.0
- Condition / age +2.5/5.0
- Appreciation +0.0/10.0
$99,999
🖨 Deal sheet 📄 Offer letter ✓ Due diligence
Listing remarks
INVESTOR OPPORTUNITY IN VAN, TX!!! VACANT 3-bedroom home ready for renovation. Property needs roof and foundation repair and is priced accordingly. Strong after-repair value potential. Cash or hard money financing only. Property is SOLD AS-IS. Seller will make no repairs. Great opportunity for investors or flippers looking for their next project. Inside pictures are just to show size of rooms. The rooms are empty.
Key facts
- Vacant home
- Roof repair
- Sold as-is
Tags
Property features AI
Exterior
- Home design: Single-family detached residence; Single story
- Exterior features: Front porch; Chain link fencing; Composition roof; Lot approximately 0.55 acre
Interior
- Kitchen: Dishwasher; Electric oven; Electric range
- Bathrooms: 1 full bathroom
- Heating & cooling: Central air; Central electric heating
- Interior features: Dishwasher; Electric oven; Electric range; Central heating and cooling; Electric heating
Neighborhood map
What this means for you Summary
Snapshot
- This is a 3-bed/1.0-bath single-family listed at $100k.
Deal economics
- At list price, monthly cash flow is $132 ($2k/yr) — positive.
- The deal already cash-flows at list — no discount required.
- Meets the 1% rule at list price ($1k rent vs $100k).
- Recommended offer: $97k (3.0% below list) — sets the bar for market timing.
- Cap rate 7.9% vs local median 2.3% in Van — top-decile yield for the area; either an underpriced asset or a hidden risk that comps aren't pricing in. Stress-test before assuming the spread holds.
Location & tenants
- Location reads 68/100 on livability (#505 in TX) — a middle-class / working-renter tenant base. Strengths: crime A+, cost of living A+, housing A+; Watch: employment C-, amenities F, commute F.
- Van ISD (rural): math 40% / reading 42% proficiency, ranked #390 of 826 in TX (top 47%) — families likely to look elsewhere, expect single-tenant / working-renter base with shorter leases.
- Zoned schools: Rhodes El (392 students, 64% FRL); Van J H (math 33% / reading 49%, grade F, #613 of 1,662 statewide, top 38%, 389 students, 59% FRL); Van H S (math 47% / reading 47%, grade D-, #591 of 1,632 statewide, top 38%, 793 students, 52% FRL).
- Market conditions: 86 active listings in the ZIP; 1 comparable units currently listed for rent nearby; 54 units permitted in Van Zandt County in 2024 (0 in 5+ unit buildings).
Forward outlook
- Local home prices are declining (-3.0%/yr); year-one equity from $691 of loan paydown is wiped out by about $3k of value loss. Plan a longer hold.
- Van Zandt County population projected at +4% by 2050 — modest demand growth; plan on rents tracking national, not racing it.
Negotiation context
- It's been on market 47 days — a 3% lower offer ($97k) is reasonable based on typical stale-listing flexibility.
- 4 sale attempts since 12y ago; this cycle's ask has dropped $20k (17%) from the opening price — seller is motivated, your offer sets the floor, not the list.
Risks & watch-outs
- Watch-outs: property tax is 3.5% of price; built in 1953 — expect roof / HVAC / electrical / plumbing capex.
- Climate carrying-cost: major wind risk, 65% chance of damaging wind over 30y; extreme-heat days projected 7→25/yr by 2055 (HVAC capex compounding) — expect insurance premiums to compound above CPI over the hold.
Questions for the listing agent
- It's been on market 47 days. Have you received any prior offers? Is the seller open to a 3% concession, seller financing, or rate buy-down credit?
- Built in 1953 — when were the roof, HVAC, electrical panel, plumbing, and water heater last replaced?
- Property tax is high relative to price — has the assessment been appealed recently, and will the sale trigger a re-assessment?
- Is there a deadline driving the sale (1031 exchange, divorce, estate, relocation)? That informs how much negotiation room exists.
- Schools are D-rated, which usually means shorter tenancies and higher turnover. Who's the typical renter profile here, and what's been the actual vacancy rate?
- What's the average days-on-market for RENTAL listings here right now (not sales)? A rising rental-DOM trend means longer vacancies and softer asking-rent achievability than the comps imply.
- What's the recent tenant-quality profile in this submarket — average credit score on applications, eviction rate, late-payment / NSF rate, and stable-employment percentage? A property-management company in the area should have these aggregated.
- How much new for-sale + rental construction is in the pipeline within 1–3 miles? Heavy new supply typically softens prices + rents 12–24 months out; constrained supply supports both.
Investment metrics
- 1% rule
- 1.25% ✓
- Cap rate
- 7.87%
- Cash-on-cash
- 5.65%
- DSCR
- 1.25
- GRM
- 6.7
CMA / ARV
- ARV (on-the-fly)
- $194,880
- Comps found
- 5
Show comp detail 5 sales within ~0.75 mi
| Address | Dist | Beds/Ba | Sqft | Sold | Price | $/sf | Match |
|---|---|---|---|---|---|---|---|
| 412 Stadium Ln | 0.25mi | 3/2.0 | 1,477 (+10%) | 1mo | $290,000 | $196 | 67 |
| 884 E Pennsylvania Ave E | 0.29mi | 3/1.0 | 1,266 (-6%) | 14mo | $219,000 | $173 | 65 |
| 110 Ebony St | 0.28mi | 2/2.0 (-1) | 1,276 (-5%) | 11mo | $185,000 | $145 | 60 |
| 200 Oregon St | 0.45mi | 4/2.0 (+1) | 1,416 (+5%) | 23mo | $199,990 | $141 | 42 |
| 2484 Vz County Road 1412 | 0.67mi | 3/2.0 | 1,460 (+9%) | 23mo | $179,900 | $123 | 31 |
Match score weights: distance 35% · size 25% · config 20% · recency 20%. Top-matched comps best support the ARV.
Projected returns pro-forma
-3.0% appreciation · 3.0% rent growth · sell at horizon
- IRR
- -7.4%
- Equity multiple
- 0.73×
- Total profit
- $-7,690
- Equity at exit
- $14,910
- IRR
- 2.3%
- Equity multiple
- 1.16×
- Total profit
- $4,599
- Equity at exit
- $8,646
Cash invested: $28,000 (down + closing). Projections, not guarantees.
Landlord ↔ Tenant lean methodology
- Overall (STATE)
- 87 Strongly Landlord-Friendly
- State Texas
- 87 Strongly Landlord-Friendly · R+5
- County
- — inherits STATE
- City
- — inherits STATE
ZIP-level market 75790
- Home prices YoY
- -11.4%
- Active inventory
- 86
- Price-to-rent
- 6.7×
Monthly cashflow live
- Estimated rent
- $1,250 medium interval (Pro) →
- Mortgage (P&I)
- −$524
- Tax from tax record
- −$290 /mo · $3,476/yr
- Insurance
- −$42
- HOA
- −$0
- Vacancy / Maint / Mgmt
- −$262
- Net cashflow
- $132
Break-even live
UW: 25.0% down · 7.5% · 30yr · 1.5% tax · 5.0% vac · 8.0% maint · 8.0% mgmt
Financing live
Cash to close
- Down payment
- $25,000
- Closing costs
- $3,000
- Reserves months
- —
- Total cash needed
- —
Loan-product check · same deal, 3 products live
Conventional
25% down · 7.5% · 30yr
- Down + closing
- —
- Monthly P&I
- —
- Monthly cashflow
- —
- DSCR
- —
- Eligible?
- —
Personal DTI + credit; lowest rate.
DSCR
20% down · 8.5% · 30yr
- Down + closing
- —
- Monthly P&I
- —
- Monthly cashflow
- —
- DSCR
- —
- Eligible?
- —
No personal income docs; deal must DSCR.
Hard money
10% down · 12.0% · 12mo
- Down + closing
- —
- Monthly P&I
- —
- Monthly cashflow
- —
- DSCR
- —
- Eligible?
- —
Short-term bridge; refi at stabilization.
Rent comps 1 comps
| Address | Beds | Baths | Sqft | Rent | $/sqft | DOM | Units | Dist |
|---|---|---|---|---|---|---|---|---|
| 202 Chestnut St Unit C Van, TX | 2.0 | 1.0 | 1664 | $1,250 | $0.75 | 43d | 1 | 0.13mi |
Listing history 13 events
-
2026-04-29status Pending
-
2026-04-22price $99,999
-
2026-03-31price $109,900
-
2026-03-13$120,000 Active
-
2023-08-14historical
-
2023-06-27price $191,000
-
2023-06-25$191,000 Active
-
2023-06-25$171,000 Active
-
2020-03-02soldstatus
-
2015-01-06soldstatus
-
2015-01-05soldstatus
-
2014-11-26$50,000
-
1992-01-15soldstatus
ⓘ Source: listings_history table (triggers on properties + properties_extension) + one-shot
backfill from property_details.listing_events for pre-trigger history.
Tax reassessment forecast TX · Resets to sale price
- Current annual tax
- $3,476 · $290/mo
- Projected year-2 tax
- $3,476 · $290/mo
- Expected delta
- $0/yr ($0/mo · 0.0%)
ⓘ Screening estimate from a state-policy table — verify with the county assessor before closing.
Climate risk First Street
- Flood 1/10 Low FEMA zone X (unshaded) · 0% chance over 30 yrs
- Wildfire 3/10 Moderate
- Heat 7/10 Severe 7 d/yr ≥109°F today · 25 d/yr by 30 yrs out
- Wind 6/10 Major 65% chance of damaging wind over 30 yrs
- Air quality 2/10 Low 0 unhealthy d/yr today · 1 by 30 yrs out
Nearby sold comps map
Loading sold comps map…
Walkable amenities ~0.75 mi
Loading nearby amenities…
Taxation est. · year 1
- Rental income
- $15,000
- − Mortgage interest
- −$5,601
- − Property taxes
- −$3,476
- − Insurance
- −$500
- − Repairs & maintenance
- −$1,200
- − Management
- −$1,200
- − Depreciation
- −$2,909
- Taxable income
- $114
- Est. tax owed @ 24.0%
- −$27
- After-tax cash flow
- $1,554/yr
For passive investors: Depreciation is non-cash, so a rental often shows a tax loss while cash-flowing — sheltering income. Rental losses are passive: they offset passive income freely, and up to $25,000/yr can offset ordinary (W-2) income if you actively participate and your MAGI is under $100k (phasing out to $0 by $150k); unused losses carry forward. On sale, claimed depreciation is recaptured at up to 25%, and gains may owe capital-gains tax (a 1031 exchange can defer both). Figures are a year-1 estimate at your 24.0% rate — not tax advice; consult a CPA.
Schools (NCES district)
- District
- Van ISD
- NCES district ID
- 4843920
- Math proficiency
- 40% ▼ -8.00%
- Reading proficiency
- 42% ▼ -5.00%
- Median HH income
- $44,308
- Composite
- 34.78/100
- National rank
- #5120
- State rank
- #390 of 826 in TX
Livability — Van
- Score
- 68/100
- State rank
- #505
- US rank
- #9995
Category grades
Schools grade is shown separately in the Schools card above.
Census & demographics
- Census place
- Van, TX
- City population
- 3,790
- Population (ZIP)
- 3,790
Population outlook (Van Zandt County) Hauer SSP2
- Today (2025)
- 55,634 people
- By 2030
- 56,479 · +1.5%
- By 2040
- 57,672 · +3.7%
- By 2050
- 57,913 · +4.1%
- By 2075
- 57,544 · +3.4%
- By 2100
- 52,659 · -5.3%
Race, ethnicity, and origin ACS 2023
- Neighborhood character
- Predominantly White (80%)
- Race & ethnicity
- White 80% Hispanic / Latino 15% Two or more races 6% Black 3%
- Hispanic origin (detail)
- Mexican 15%
- Common ancestry
- Portuguese 2% Italian 1% Greek 1%
- Foreign-born
- 4% · Canada
- Languages at home
- 92% English-only · Spanish 8%
Political lean MEDSL · Van Zandt
- 2024 margin
- Solid R (+74.8) · D 12.3% · R 87.2%
- 2008→2024 swing
- -19.8pp toward R · 2008: -55.1pp · 2024: -74.8pp
- All cycles
- 2024: R+74.8 2020: R+72.1 2016: R+72.1 2012: R+66.6 2008: R+55.1
Not yet ingested
- Civics
- —
Market trends
- HPI YoY
- ▼ -27.57%
- Current HPI
- 213.6886
- Rent YoY
- —
- Metro
- —
- State GDP YoY
- ▲ 3.95%
- F500 in state
- 110
Industry mix (Fortune 500 HQ in TX)
| Industry | F500 HQs | Revenue |
|---|---|---|
| Energy | 16 | $1,198B |
|
||
| Technology | 5 | $198B |
|
||
| Engineering / Construction | 4 | $72B |
|
||
| Energy Services | 3 | $60B |
|
||
| Utilities | 3 | $41B |
|
||
| Healthcare | 2 | $330B |
|
||
Price history
+100.0% since first listed13 events — show timeline
- 2026-04-29 Pending — GTAR
- 2026-04-22 Price Changed $99,999 GTAR
- 2026-03-31 Price Changed $109,900 GTAR
- 2026-03-13 Listed $120,000 GTAR
- 2023-08-14 Listing Removed — NTREIS
- 2023-06-27 Price Changed $191,000 NTREIS
- 2023-06-25 Listed $171,000 NTREIS
- 2023-06-25 Listed $191,000 GTAR
- 2020-03-02 Sold (Public Records) — Public Records
- 2015-01-06 Sold (Public Records) — Public Records
- 2015-01-05 Sold (MLS) — GTAR
- 2014-11-26 Listed $50,000 GTAR
- 1992-01-15 Sold (Public Records) — Public Records
Property tax history
+6.2%/yrLatest (2025): $3,476 · +4.6% YoY. Source: county tax records.
Cash-flow waterfall
monthlySold comps — $/sqft
last 12 mo · ≤1 miLoading sold comps…