 Multi-family
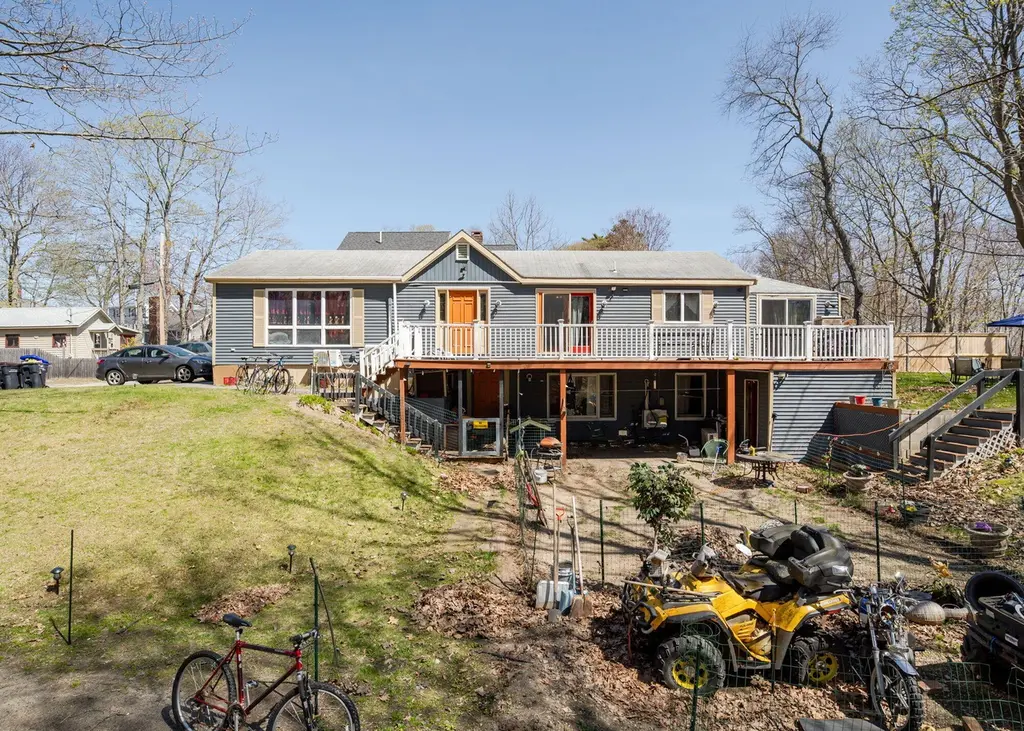
35 Fort Hill Ave · Old Orchard Beach, ME
Flood risk 6/10 · Moderate
- FEMA flood zone
- X
- Chance of flooding over 30 yrs
- 0.72%
- Est. flood insurance / yr
- $507 – $1,088
Fire risk 3/10 · Minor
- Est. fire insurance / yr
- $669 – $1,243
Heat risk 4/10 · Minor
- Hot days now (above 87°F)
- 7 days/yr
- Hot days in 30 yrs
- 18 days/yr
Wind risk 6/10 · Moderate
- Chance of severe wind over 30 yrs
- 68.0%
Air-quality risk 2/10 · Minimal
- Unhealthy air days now
- 1 days/yr
- Unhealthy air days in 30 yrs
- 1 days/yr
Risk factors via First Street. Map © Google.
Why this score? — see what drove the C- grade
The composite is a weighted blend of 9 inputs, each scored 0–100. Each bar is that input's sub-score; the figure is the points it added to the 100-point composite (weight × sub-score).
- ARV discount +15.0/15.0
- Cash flow +14.7/30.0
- Schools +6.7/10.0
- DSCR +4.5/10.0
- Rent growth +3.7/5.0
- 1% rule +3.5/10.0
- Livability +3.4/5.0
- Condition / age +2.5/5.0
- Appreciation +0.0/10.0
$450,000
🖨 Deal sheet 📄 Offer letter ✓ Due diligence
Multi-family units
County records classify this as Multi-Family (2-4 Unit). Listing-text estimate: 1 unit. estimate disagrees with records
Listing remarks
Coastal living meets flexibility at 35 Fort Hill Ave. Ideally located on a tucked-away street just minutes from the heart of Old Orchard Beach, this multi-unit property offers a unique opportunity to enjoy the Maine lifestyle while maximizing its potential. The property features two separate living spaces, including a generously sized 3-bedroom unit and an additional 1-bedroom unit with bonus space--perfect for extended guests, rental income, or creating a setup that suits your needs. Whether you're envisioning summer getaways, year-round living, or a smart income-producing property, the layout offers options. Spend your days at the beach, stroll to nearby shops and restaurants, and return
Key facts
- 1-bedroom unit
- Bonus space
- Multi-unit property
Tags
Property features AI
Exterior
- Parking: 1–4 off-street parking spaces; No garage
- Utilities: Public sewer; Electric with circuit breakers
- Home design: Ranch-style property; Above-grade finished area 1,368; Below-grade finished area 792
- Construction: Building total area 2,160
- Exterior features: Shingle roof; Shed(s) on the property; Public water
Interior
- Bedrooms: Property contains 2 total units
- Flooring: Vinyl flooring; Wood flooring
- Bathrooms: Two full bathrooms
- Heating & cooling: Baseboard heat; Heat pump for heating and cooling
- Interior features: Vinyl and wood flooring; Exterior and interior basement entries
Neighborhood map
What this means for you Summary
Snapshot
- This is a 5-bed/2.0-bath multifamily listed at $450k.
Deal economics
- At list price, monthly cash flow is $118 ($1k/yr) — positive.
- The deal already cash-flows at list — no discount required.
- To meet the 1% rule (rent ≥ 1% of price), the offer needs to be $384k (14.6% below list).
- Recommended offer: $384k (14.6% below list) — sets the bar for 1% rule.
- Cap rate 6.6% vs local median 2.1% in Old Orchard Beach — top-decile yield for the area; either an underpriced asset or a hidden risk that comps aren't pricing in. Stress-test before assuming the spread holds.
Location & tenants
- Location reads 68/100 on livability (#88 in ME) — a middle-class / working-renter tenant base. Strengths: crime A+, housing A+, cost of living B+; Watch: schools D, amenities F, commute F.
- RSU 23 (suburban): math 78% / reading 80% proficiency, ranked #87 of 112 in ME (top 78%) — strong family-tenant draw, lease renewals of 3-5y typical.
- Market conditions: Rents rising fast (+4.9%/yr); 171 active listings in the ZIP; 1,386 units permitted in York County in 2024 (338 in 5+ unit buildings).
- At $3,841/mo this rent would consume 77% of the median local household income ($60k/yr) (locally 441% of renters already pay >50% of income on rent) — very limited rent-growth headroom before tenants either downsize or default.
Forward outlook
- Local home prices are declining (-3.0%/yr); year-one equity from $3k of loan paydown is wiped out by about $14k of value loss. Plan a longer hold.
Negotiation context
- Only 4 days on market — expect competitive offers; lowballing is unlikely to land.
- 2 sale attempts with the ask held roughly flat each time — persistent listings suggest the price (not the market) is what's stuck; bring a comps-based counter.
Risks & watch-outs
- Climate carrying-cost: major flood risk; major wind risk, 68% chance of damaging wind over 30y — expect insurance premiums to compound above CPI over the hold.
Questions for the listing agent
- Is there a deadline driving the sale (1031 exchange, divorce, estate, relocation)? That informs how much negotiation room exists.
- Schools are D-rated, which usually means shorter tenancies and higher turnover. Who's the typical renter profile here, and what's been the actual vacancy rate?
- What's the average days-on-market for RENTAL listings here right now (not sales)? A rising rental-DOM trend means longer vacancies and softer asking-rent achievability than the comps imply.
- What's the recent tenant-quality profile in this submarket — average credit score on applications, eviction rate, late-payment / NSF rate, and stable-employment percentage? A property-management company in the area should have these aggregated.
- How much new apartment / multifamily construction is in the pipeline within 1–3 miles? Heavy new supply (>2% of stock underway) typically softens rents 12–24 months out; light construction supports rent growth.
Investment metrics
- 1% rule
- 0.85% ✗
- Cap rate
- 6.61%
- Cash-on-cash
- 1.12%
- DSCR
- 1.05
- GRM
- 9.8
CMA / ARV
- ARV (median comp)
- $594,019
- List price
- $450,000
- Delta
- -24.24%
- Verdict
- UNDERPRICED
- Comps
- 20 within 1.0 mi
Show comp detail 1 sale within ~0.75 mi
| Address | Dist | Beds/Ba | Sqft | Sold | Price | $/sf | Match |
|---|---|---|---|---|---|---|---|
| 18 Hampton Ave | 0.61mi | 4/2.0 (-1) | 1,440 (+5%) | 10mo | $635,000 | $441 | 49 |
Match score weights: distance 35% · size 25% · config 20% · recency 20%. Top-matched comps best support the ARV.
Projected returns pro-forma
-3.0% appreciation · 4.93% rent growth · sell at horizon
- IRR
- -12.5%
- Equity multiple
- 0.54×
- Total profit
- $-57,871
- Equity at exit
- $67,096
- IRR
- -0.9%
- Equity multiple
- 0.93×
- Total profit
- $-8,522
- Equity at exit
- $38,908
Cash invested: $126,000 (down + closing). Projections, not guarantees.
Landlord ↔ Tenant lean methodology
- Overall (STATE)
- 41 Moderately Tenant-Leaning
- State Maine
- 41 Moderately Tenant-Leaning · D+2
- County
- — inherits STATE
- City
- — inherits STATE
ZIP-level market 04064
- Home prices YoY
- -11.6%
- Rents YoY
- 4.9%
- Active inventory
- 171
- Price-to-rent
- 17.4×
Monthly cashflow live
- Estimated rent
- $3,841 medium interval (Pro) →
- Mortgage (P&I)
- −$2,360
- Tax from tax record
- −$369 /mo · $4,430/yr
- Insurance
- −$188
- HOA
- −$0
- Vacancy / Maint / Mgmt
- −$807
- Net cashflow
- $118
Break-even live
2-unit breakdown (identical units grouped — click to expand)
| Units | Beds | Baths | Est. rent |
|---|---|---|---|
| 1× unit | 3 | 1 | $2,154 |
| 1× unit | 1 | 1 | $1,687 |
| Total (2 units) | $3,841 | ||
UW: 25.0% down · 7.5% · 30yr · 1.5% tax · 5.0% vac · 8.0% maint · 8.0% mgmt
Financing live
Cash to close
- Down payment
- $112,500
- Closing costs
- $13,500
- Reserves months
- —
- Total cash needed
- —
Loan-product check · same deal, 3 products live
Conventional
25% down · 7.5% · 30yr
- Down + closing
- —
- Monthly P&I
- —
- Monthly cashflow
- —
- DSCR
- —
- Eligible?
- —
Personal DTI + credit; lowest rate.
DSCR
20% down · 8.5% · 30yr
- Down + closing
- —
- Monthly P&I
- —
- Monthly cashflow
- —
- DSCR
- —
- Eligible?
- —
No personal income docs; deal must DSCR.
Hard money
10% down · 12.0% · 12mo
- Down + closing
- —
- Monthly P&I
- —
- Monthly cashflow
- —
- DSCR
- —
- Eligible?
- —
Short-term bridge; refi at stabilization.
Listing history 2 events
-
2026-05-05status Pending 961-char remark
-
2026-05-01$450,000 Active 961-char remark
ⓘ Source: listings_history table (triggers on properties + properties_extension) + one-shot
backfill from property_details.listing_events for pre-trigger history.
Tax reassessment forecast ME · Partial reset (capped growth)
- Current annual tax
- $4,430 · $369/mo
- Projected year-2 tax
- $5,275 · $440/mo
- Expected delta
- +$845/yr (+$70/mo · 19.1%)
ⓘ Screening estimate from a state-policy table — verify with the county assessor before closing.
Climate risk First Street
- Flood 6/10 Major FEMA zone X · 72% chance over 30 yrs
- Wildfire 3/10 Moderate
- Heat 4/10 Moderate 7 d/yr ≥87°F today · 18 d/yr by 30 yrs out
- Wind 6/10 Major 68% chance of damaging wind over 30 yrs
- Air quality 2/10 Low 1 unhealthy d/yr today · 1 by 30 yrs out
Nearby sold comps map
Loading sold comps map…
Walkable amenities ~0.75 mi
Loading nearby amenities…
Taxation est. · year 1
- Rental income
- $46,092
- − Mortgage interest
- −$25,207
- − Property taxes
- −$4,430
- − Insurance
- −$2,250
- − Repairs & maintenance
- −$3,687
- − Management
- −$3,687
- − Depreciation
- −$13,091
- Taxable loss
- −$6,261
- Est. tax savings @ 24.0%
- +$1,503
- After-tax cash flow
- $2,917/yr
For passive investors: Depreciation is non-cash, so a rental often shows a tax loss while cash-flowing — sheltering income. Rental losses are passive: they offset passive income freely, and up to $25,000/yr can offset ordinary (W-2) income if you actively participate and your MAGI is under $100k (phasing out to $0 by $150k); unused losses carry forward. On sale, claimed depreciation is recaptured at up to 25%, and gains may owe capital-gains tax (a 1031 exchange can defer both). Figures are a year-1 estimate at your 24.0% rate — not tax advice; consult a CPA.
Schools (NCES district)
- District
- RSU 23
- NCES district ID
- 2314784
- Math proficiency
- 78% ▲ 51.00%
- Reading proficiency
- 80% ▲ 27.00%
- Median HH income
- $49,630
- Composite
- 66.79/100
- National rank
- #406
- State rank
- #87 of 112 in ME
Livability — Old Orchard Beach
- Score
- 68/100
- State rank
- #88
- US rank
- #9943
Category grades
Schools grade is shown separately in the Schools card above.
Census & demographics
- Census place
- Old Orchard Beach, ME
- County
- York County · 80,026 people
- City population
- 8,632
- Metro
- Portland-South Portland, ME
- Population (ZIP)
- 8,632
- Household income
- $59,887
- Rent vs Own
- Severe rent burden
- 441.0
Population outlook (York County) Hauer SSP2
- Today (2025)
- 209,961 people
- By 2030
- 212,816 · +1.4%
- By 2040
- 214,360 · +2.1%
- By 2050
- 210,350 · +0.2%
- By 2075
- 201,686 · -3.9%
- By 2100
- 183,392 · -12.7%
Race, ethnicity, and origin ACS 2023
- Neighborhood character
- Predominantly White (90%)
- Race & ethnicity
- White 90% Two or more races 6% Hispanic / Latino 3% Black 1% Native American 1%
- Common ancestry
- Lithuanian 9% Slovak 7% Romanian 3%
- Foreign-born
- 6% · Canada
- Languages at home
- 91% English-only · French/Haitian/Cajun 6% Russian/Polish/Slavic 1% Other Indo-European 1%
Political lean MEDSL · York
- 2024 margin
- D (+10.5) · D 54.3% · R 43.8% · Other 1.9%
- 2008→2024 swing
- -10.1pp toward R · 2008: 20.5pp · 2024: 10.5pp
- All cycles
- 2024: D+10.5 2020: D+12.6 2016: D+4.8 2012: D+16.4 2008: D+20.5
Not yet ingested
- Civics
- —
Market trends
- HPI YoY
- ▼ -64.32%
- Current HPI
- 489.543
- Rent YoY
- ▲ 4.93%
- Metro
- Portland-South Portland, ME
- State GDP YoY
- —
- F500 in state
- 0
Price history
-7.4% since first listed5 events — show timeline
- 2026-06-12 Sold (MLS) $440,000 MREIS
- 2026-05-05 Pending — MREIS
- 2026-05-01 Listed $450,000 MREIS
- 2026-04-03 Delisted — MREIS
- 2026-03-05 Listed $475,000 MREIS
Property tax history
+4.4%/yrLatest (2024): $4,430 · +11.2% YoY. Source: county tax records.
Cash-flow waterfall
monthlySold comps — $/sqft
last 12 mo · ≤1 miLoading sold comps…