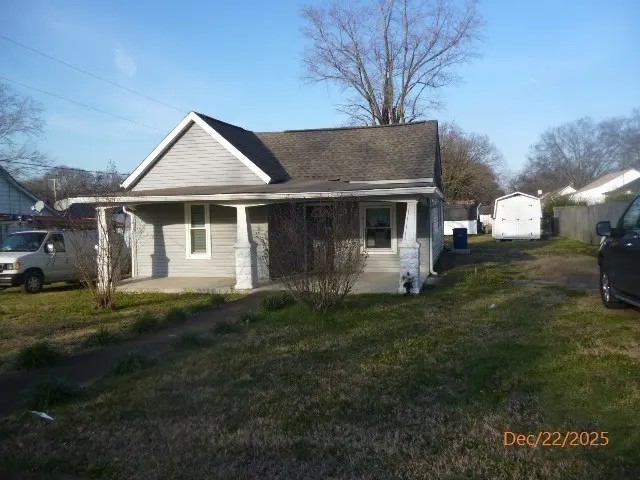
110 2nd Ave · Columbia, TN
Flood risk 5/10 · Moderate
- FEMA flood zone
- X (shaded)
- Chance of flooding over 30 yrs
- 0.24%
- Est. flood insurance / yr
- $507 – $1,088
Fire risk 3/10 · Minor
- Est. fire insurance / yr
- $949 – $1,763
Heat risk 6/10 · Moderate
- Hot days now (above 106°F)
- 7 days/yr
- Hot days in 30 yrs
- 19 days/yr
Wind risk 4/10 · Minor
- Chance of severe wind over 30 yrs
- 14.0%
Air-quality risk 1/10 · Minimal
- Unhealthy air days now
- 0 days/yr
- Unhealthy air days in 30 yrs
- 0 days/yr
Risk factors via First Street. Map © Google.
Why this score? — see what drove the C grade
The composite is a weighted blend of 9 inputs, each scored 0–100. Each bar is that input's sub-score; the figure is the points it added to the 100-point composite (weight × sub-score).
- Cash flow +22.7/30.0
- ARV discount +15.0/15.0
- DSCR +7.3/10.0
- 1% rule +4.7/10.0
- Livability +3.2/5.0
- Rent growth +2.5/5.0
- Condition / age +2.5/5.0
- Schools +1.8/10.0
- Appreciation +0.0/10.0
$135,900
🖨 Deal sheet (PDF) 📄 Offer letter ✓ Due diligence
Listing remarks MLS
Home has been renovated to include new windows, doors, flooring, cabinetry, light fixtures, paint. Large covered front porch provides good curb appeal. Walking distance to town.
Key facts
- Renovated
- New doors
- New flooring
Tags
Neighborhood map
What this means for you Summary
Snapshot
- This is a 3-bed/1.0-bath single-family listed at $136k.
Deal economics
- At list price, monthly cash flow is $234 ($3k/yr) — positive.
- The deal already cash-flows at list — no discount required.
- To meet the 1% rule (rent ≥ 1% of price), the offer needs to be $132k (3.1% below list).
- Recommended offer: $124k (9.0% below list) — sets the bar for market timing.
- Cap rate 8.4% vs local median 2.8% in Columbia — top-decile yield for the area; either an underpriced asset or a hidden risk that comps aren't pricing in. Stress-test before assuming the spread holds.
Location & tenants
- Location reads 63/100 on livability (#207 in TN) — a middle-class / working-renter tenant base. Strengths: cost of living A+, housing A+; Watch: employment C-, health & safety C-, crime F.
- Maury County (town): math 19% / reading 21% proficiency, ranked #108 of 139 in TN (top 78%) — low school quality limits family demand, transient renter base, plan for 1-2y turnover.
- Zoned schools: Riverside Elementary (math 12% / reading 12%, grade F, #786 of 952 statewide, top 84%, 429 students, 0% FRL); E. A. Cox Middle School (math 6% / reading 7%, grade F, #284 of 333 statewide, top 86%, 656 students, 0% FRL); Columbia Central High School (math 7% / reading 27%, grade F, #225 of 332 statewide, top 69%, 1,474 students, 0% FRL) — zoned schools average 0% FRL vs 48% district-wide (48 pts lower); this property's tenant base skews higher-income than the district average.
- Market conditions: 146 active listings in the ZIP; 13 comparable units currently listed for rent nearby; rentals at typical pace (median 22d on market — plan ~3-4 weeks tenant-placement turnaround); 1,650 units permitted in Maury County in 2024 (60 in 5+ unit buildings).
Forward outlook
- Local home prices are declining (-3.0%/yr); year-one equity from $940 of loan paydown is wiped out by about $4k of value loss. Plan a longer hold.
- Maury County population projected at +34% by 2050 — long-run rental-demand tailwind backs the buy-and-hold thesis.
Negotiation context
- It's been on market 117 days — a 9% lower offer ($124k) is reasonable based on typical stale-listing flexibility.
- 5 sale attempts since 12y ago; this cycle's ask has dropped $40k (23%) from the opening price — seller is motivated, your offer sets the floor, not the list.
Risks & watch-outs
- Watch-outs: built in 1900 — expect roof / HVAC / electrical / plumbing capex.
- Climate carrying-cost: moderate flood risk; extreme-heat days projected 7→19/yr by 2055 (HVAC capex compounding) — expect insurance premiums to compound above CPI over the hold.
Questions for the listing agent
- It's been on market 117 days. Have you received any prior offers? Is the seller open to a 9% concession, seller financing, or rate buy-down credit?
- Built in 1900 — when were the roof, HVAC, electrical panel, plumbing, and water heater last replaced?
- Why hasn't it sold? Are there any deal-killer items the seller is aware of (foundation, flood, title, zoning, code violations)?
- Is there a deadline driving the sale (1031 exchange, divorce, estate, relocation)? That informs how much negotiation room exists.
- Schools are F-rated, which usually means shorter tenancies and higher turnover. Who's the typical renter profile here, and what's been the actual vacancy rate?
- Crime grade is F in this area — have there been break-ins, vandalism, or insurance claims at this property in the last 3 years? What carrier currently insures it and at what premium?
- What's the average days-on-market for RENTAL listings here right now (not sales)? A rising rental-DOM trend means longer vacancies and softer asking-rent achievability than the comps imply.
- What's the recent tenant-quality profile in this submarket — average credit score on applications, eviction rate, late-payment / NSF rate, and stable-employment percentage? A property-management company in the area should have these aggregated.
- How much new for-sale + rental construction is in the pipeline within 1–3 miles? Heavy new supply typically softens prices + rents 12–24 months out; constrained supply supports both.
Investment metrics
- 1% rule
- 0.97% ✗
- Cap rate
- 8.36%
- Cash-on-cash
- 7.38%
- DSCR
- 1.33
- GRM
- 8.6
CMA / ARV
- ARV (median comp)
- $270,528
- List price
- $135,900
- Delta
- -49.76%
- Verdict
- UNDERPRICED
- Comps
- 20 within 1.0 mi
Show comp detail 12 sales within ~0.75 mi
| Address | Dist | Beds/Ba | Sqft | Sold | Price | $/sf | Match |
|---|---|---|---|---|---|---|---|
| 304 5th Ave | 0.29mi | 3/1.0 | 1,070 (+8%) | 11mo | $275,000 | $257 | 64 |
| 700 Fleming St | 0.56mi | 3/1.5 | 1,008 (+2%) | 7mo | $240,000 | $238 | 63 |
| 418 W 3rd St | 0.54mi | 2/1.0 (-1) | 976 (-2%) | 9mo | $157,000 | $161 | 60 |
| 511 E 8th St | 0.49mi | 3/2.0 | 1,075 (+8%) | 3mo | $52,000 | $48 | 56 |
| 808 Woodside St | 0.44mi | 2/1.0 (-1) | 1,072 (+8%) | 8mo | $75,000 | $70 | 54 |
| 515 E 8th St | 0.50mi | 2/1.0 (-1) | 1,064 (+7%) | 7mo | $225,000 | $211 | 54 |
| 709 E 9th St | 0.68mi | 3/2.0 | 1,080 (+9%) | 7mo | $245,000 | $227 | 44 |
| 817 E End St | 0.53mi | 2/1.0 (-1) | 910 (-8%) | 16mo | $207,500 | $228 | 43 |
| 108 Westview Dr | 0.66mi | 3/1.0 | 1,086 (+10%) | 13mo | $234,500 | $216 | 42 |
| 10261/2 Bridge St | 0.72mi | 3/2.0 | 1,107 (+12%) | 4mo | $85,000 | $77 | 40 |
| 411 Moore Dr | 0.71mi | 2/1.0 (-1) | 1,122 (+13%) | 2mo | $222,000 | $198 | 38 |
| 1006 Bridge St | 0.60mi | 3/2.0 | 1,123 (+13%) | 18mo | $283,500 | $252 | 31 |
Match score weights: distance 35% · size 25% · config 20% · recency 20%. Top-matched comps best support the ARV.
Projected returns pro-forma
-3.0% appreciation · 3.0% rent growth · sell at horizon
- IRR
- -5.1%
- Equity multiple
- 0.81×
- Total profit
- $-7,185
- Equity at exit
- $20,263
- IRR
- 4.6%
- Equity multiple
- 1.33×
- Total profit
- $12,676
- Equity at exit
- $11,750
Cash invested: $38,052 (down + closing). Projections, not guarantees.
Landlord ↔ Tenant lean methodology
- Overall (STATE)
- 87 Strongly Landlord-Friendly
- State Tennessee
- 87 Strongly Landlord-Friendly · R+13
- County
- — inherits STATE
- City
- — inherits STATE
ZIP-level market 38474
- Home prices YoY
- -5.5%
- Active inventory
- 146
- Price-to-rent
- 8.6×
Monthly cashflow live
- Estimated rent
- $1,317 high interval (Pro) →
- Mortgage (P&I)
- −$713
- Tax from tax record
- −$37 /mo · $445/yr
- Insurance
- −$57
- HOA
- −$0
- Vacancy / Maint / Mgmt
- −$277
- Net cashflow
- $234
Break-even live
Sensitivity live
| Price | -10% $311 | -5% $272 | +0% $234 | +5% $195 | +10% $157 |
|---|---|---|---|---|---|
| Rent | -10% $130 | -5% $182 | +0% $234 | +5% $286 | +10% $338 |
| Rate | -1.0pp $302 | -0.5pp $268 | base $234 | +0.5pp $199 | +1.0pp $163 |
UW: 25.0% down · 7.5% · 30yr · 1.5% tax · 5.0% vac · 8.0% maint · 8.0% mgmt
Financing live
Cash to close
- Down payment
- $33,975
- Closing costs
- $4,077
- Reserves months
- —
- Total cash needed
- —
Loan-product check · same deal, 3 products live
Conventional
25% down · 7.5% · 30yr
- Down + closing
- —
- Monthly P&I
- —
- Monthly cashflow
- —
- DSCR
- —
- Eligible?
- —
Personal DTI + credit; lowest rate.
DSCR
20% down · 8.5% · 30yr
- Down + closing
- —
- Monthly P&I
- —
- Monthly cashflow
- —
- DSCR
- —
- Eligible?
- —
No personal income docs; deal must DSCR.
Hard money
10% down · 12.0% · 12mo
- Down + closing
- —
- Monthly P&I
- —
- Monthly cashflow
- —
- DSCR
- —
- Eligible?
- —
Short-term bridge; refi at stabilization.
Rent comps 13 comps
| Address | Beds | Baths | Sqft | Rent | $/sqft | DOM | Units | Dist |
|---|---|---|---|---|---|---|---|---|
| 203 Stewart St Unit a Columbia, TN | 2.0 | 1.0 | 850 | $1,200 | $1.41 | 22d | 1 | 0.13mi |
| 700 Fleming St Columbia, TN | 3.0 | 1.5 | 1008 | $1,650 | $1.64 | 9d | 1 | 0.54mi |
| 908 Mapleash Ave Columbia, TN | 3.0 | 2.0 | 1112 | $1,750 | $1.57 | 19d | 1 | 0.55mi |
| 208 Hill St Columbia, TN | 2.0 | 1.0 | 901 | $1,450 | $1.61 | 25d | 1 | 0.61mi |
| 100 Rainbow Cir Columbia, TN | 2.0 | 1.0 | 1036 | $890 | $0.86 | 6d | 1 | 0.88mi |
| 103 Naydonlin Dr Unit B Columbia, TN | 2.0 | 1.0 | 712 | $1,100 | $1.54 | 45d | 1 | 0.90mi |
| 1214 School St Columbia, TN | 2.0 | 1.0 | 1036 | $1,300 | $1.25 | 25d | 1 | 1.05mi |
| 109 Cloverdale Dr Unit B Columbia, TN | 2.0 | 1.0 | 800 | $1,199 | $1.50 | 45d | 1 | 1.10mi |
| 1510 Whatley St Columbia, TN | 2.0 | 1.0 | 832 | $1,050 | $1.26 | 14d | 1 | 1.20mi |
| 109 E 15th St Columbia, TN | 2.0 | 1.0 | 812 | $1,500 | $1.85 | 45d | 1 | 1.24mi |
| 100 Stonebridge Way Columbia, TN | 2.0–3.0 | 2.0 | 1067 | $1,485 | $1.39 | 3d | 4 | 1.41mi |
| 314 E 18th St Columbia, TN | 3.0 | 1.0 | 988 | $999 | $1.01 | 16d | 1 | 1.47mi |
| 1901 Cherry St Columbia, TN | 2.0 | 1.0 | 676 | $1,650 | $2.44 | 45d | 1 | 1.50mi |
Listing history 24 events
-
2026-06-02status $135,900 Pending 117 DOM
-
2026-06-01days on market $135,900 Active Under Contract 117 DOM
-
2026-05-31days on market $135,900 Active Under Contract 116 DOM
-
2026-05-14historical Active Under Contract 177-char remark
Show marketing remark (177 chars)
Home has been renovated to include new windows, doors, flooring, cabinetry, light fixtures, paint. Large covered front porch provides good curb appeal. Walking distance to town.
-
2026-05-12price $135,900 177-char remark
Show marketing remark (177 chars)
Home has been renovated to include new windows, doors, flooring, cabinetry, light fixtures, paint. Large covered front porch provides good curb appeal. Walking distance to town.
-
2026-04-08price $155,900 177-char remark
Show marketing remark (177 chars)
Home has been renovated to include new windows, doors, flooring, cabinetry, light fixtures, paint. Large covered front porch provides good curb appeal. Walking distance to town.
-
2026-03-12price $165,900 177-char remark
Show marketing remark (177 chars)
Home has been renovated to include new windows, doors, flooring, cabinetry, light fixtures, paint. Large covered front porch provides good curb appeal. Walking distance to town.
-
2026-02-04$175,900 Active 177-char remark
Show marketing remark (177 chars)
Home has been renovated to include new windows, doors, flooring, cabinetry, light fixtures, paint. Large covered front porch provides good curb appeal. Walking distance to town.
-
2022-11-28soldstatus $199,999
-
2022-11-21soldstatus $199,999 Closed 339-char remark
Show marketing remark (339 chars)
REDUCED! Circa 1894 Cottage Style home recently renovated. Features: Original hardwood floors refinished, new flooring in kitchen & bath, new paint, light fixtures, & siding, 9ft plus ceilings in most of home, Roof & new plumbing 5 yrs ago .Large covered sitting front porch & patio on back. Storage building. Cellar .
-
2022-10-20historical Active Under Contract 339-char remark
Show marketing remark (339 chars)
REDUCED! Circa 1894 Cottage Style home recently renovated. Features: Original hardwood floors refinished, new flooring in kitchen & bath, new paint, light fixtures, & siding, 9ft plus ceilings in most of home, Roof & new plumbing 5 yrs ago .Large covered sitting front porch & patio on back. Storage building. Cellar .
-
2022-10-13price $199,900 339-char remark
Show marketing remark (339 chars)
REDUCED! Circa 1894 Cottage Style home recently renovated. Features: Original hardwood floors refinished, new flooring in kitchen & bath, new paint, light fixtures, & siding, 9ft plus ceilings in most of home, Roof & new plumbing 5 yrs ago .Large covered sitting front porch & patio on back. Storage building. Cellar .
-
2022-09-28price $209,900 339-char remark
Show marketing remark (339 chars)
REDUCED! Circa 1894 Cottage Style home recently renovated. Features: Original hardwood floors refinished, new flooring in kitchen & bath, new paint, light fixtures, & siding, 9ft plus ceilings in most of home, Roof & new plumbing 5 yrs ago .Large covered sitting front porch & patio on back. Storage building. Cellar .
-
2022-09-20price $219,000 339-char remark
Show marketing remark (339 chars)
REDUCED! Circa 1894 Cottage Style home recently renovated. Features: Original hardwood floors refinished, new flooring in kitchen & bath, new paint, light fixtures, & siding, 9ft plus ceilings in most of home, Roof & new plumbing 5 yrs ago .Large covered sitting front porch & patio on back. Storage building. Cellar .
-
2022-09-15price $223,000 339-char remark
Show marketing remark (339 chars)
REDUCED! Circa 1894 Cottage Style home recently renovated. Features: Original hardwood floors refinished, new flooring in kitchen & bath, new paint, light fixtures, & siding, 9ft plus ceilings in most of home, Roof & new plumbing 5 yrs ago .Large covered sitting front porch & patio on back. Storage building. Cellar .
-
2022-09-06$225,000 Active 339-char remark
Show marketing remark (339 chars)
REDUCED! Circa 1894 Cottage Style home recently renovated. Features: Original hardwood floors refinished, new flooring in kitchen & bath, new paint, light fixtures, & siding, 9ft plus ceilings in most of home, Roof & new plumbing 5 yrs ago .Large covered sitting front porch & patio on back. Storage building. Cellar .
-
2022-03-24soldstatus $85,000 Closed
-
2022-03-24soldstatus $85,000
-
2022-02-28historical
-
2022-02-28$89,900
-
2015-03-20soldstatus $27,000 Closed
-
2015-03-12status Pending
-
2015-01-06$27,900 Active
-
2014-05-07$27,900
ⓘ Source: listings_history table (triggers on properties + properties_extension) + one-shot
backfill from property_details.listing_events for pre-trigger history.
Tax reassessment forecast TN · Resets to sale price
- Current annual tax
- $445 · $37/mo
- Projected year-2 tax
- $965 · $80/mo
- Expected delta
- +$520/yr (+$43/mo · 116.8%)
ⓘ Screening estimate from a state-policy table — verify with the county assessor before closing.
Climate risk First Street
- Flood 5/10 Major FEMA zone X (shaded) · 24% chance over 30 yrs
- Wildfire 3/10 Moderate
- Heat 6/10 Major 7 d/yr ≥106°F today · 19 d/yr by 30 yrs out
- Wind 4/10 Moderate 14% chance of damaging wind over 30 yrs
- Air quality 1/10 Low 0 unhealthy d/yr today · 0 by 30 yrs out
Nearby sold comps map
Loading sold comps map…
Walkable amenities ~0.75 mi
Loading nearby amenities…
Taxation est. · year 1
- Rental income
- $15,802
- − Mortgage interest
- −$7,613
- − Property taxes
- −$445
- − Insurance
- −$680
- − Repairs & maintenance
- −$1,264
- − Management
- −$1,264
- − Depreciation
- −$3,953
- Taxable income
- $583
- Est. tax owed @ 24.0%
- −$140
- After-tax cash flow
- $2,667/yr
For passive investors: Depreciation is non-cash, so a rental often shows a tax loss while cash-flowing — sheltering income. Rental losses are passive: they offset passive income freely, and up to $25,000/yr can offset ordinary (W-2) income if you actively participate and your MAGI is under $100k (phasing out to $0 by $150k); unused losses carry forward. On sale, claimed depreciation is recaptured at up to 25%, and gains may owe capital-gains tax (a 1031 exchange can defer both). Figures are a year-1 estimate at your 24.0% rate — not tax advice; consult a CPA.
Schools (NCES district)
- District
- Maury County
- NCES district ID
- 4702760
- Math proficiency
- 19% ▼ -5.00%
- Reading proficiency
- 21% ▼ -4.00%
- Median HH income
- $47,668
- Composite
- 17.69/100
- National rank
- #9024
- State rank
- #108 of 139 in TN
Livability — Columbia
- Score
- 63/100
- State rank
- #207
- US rank
- #16090
Category grades
Schools grade is shown separately in the Schools card above.
Census & demographics
- Census place
- Columbia, TN
- City population
- 67,482
- Population (ZIP)
- 9,336
Population outlook (Maury County) Hauer SSP2
- Today (2025)
- 102,894 people
- By 2030
- 110,269 · +7.2%
- By 2040
- 124,426 · +20.9%
- By 2050
- 137,543 · +33.7%
- By 2075
- 167,438 · +62.7%
- By 2100
- 184,489 · +79.3%
Race, ethnicity, and origin ACS 2023
- Neighborhood character
- Predominantly White (79%)
- Race & ethnicity
- White 79% Black 15% Two or more races 6%
- Common ancestry
- Italian 2% Lithuanian 1% Serbian 1%
- Foreign-born
- 0% · Canada
Political lean MEDSL · Maury
- 2024 margin
- Solid R (+44.6) · D 27.1% · R 71.8% · Other 1.1%
- 2008→2024 swing
- -6.2pp toward R · 2008: -38.4pp · 2024: -44.6pp
- All cycles
- 2024: R+44.6 2020: R+36.5 2016: R+39.2 2012: R+26.9 2008: R+38.4
Not yet ingested
- Civics
- —
Market trends
- HPI YoY
- ▼ -22.21%
- Current HPI
- 383.7754
- Rent YoY
- —
- Metro
- —
- State GDP YoY
- ▲ 2.78%
- F500 in state
- 22
Industry mix (Fortune 500 HQ in TN)
| Industry | F500 HQs | Revenue |
|---|---|---|
| Healthcare | 3 | $91B |
|
||
| Retail | 3 | $72B |
|
||
| Transportation / Logistics | 1 | $88B |
|
||
| Paper / Packaging | 1 | $19B |
|
||
| Insurance | 1 | $13B |
|
||
| Energy | 1 | $12B |
|
||
Price history
+387.1% since first listed21 events — show timeline
- 2026-05-14 Contingent — REALTRACS as Distributed by MLS Grid
- 2026-05-12 Price Changed $135,900 REALTRACS as Distributed by MLS Grid
- 2026-04-08 Price Changed $155,900 REALTRACS as Distributed by MLS Grid
- 2026-03-12 Price Changed $165,900 REALTRACS as Distributed by MLS Grid
- 2026-02-04 Listed $175,900 REALTRACS as Distributed by MLS Grid
- 2022-11-28 Sold (Public Records) $199,999 Public Records
- 2022-11-21 Sold (MLS) $199,999 REALTRACS as Distributed by MLS Grid
- 2022-10-20 Contingent — REALTRACS as Distributed by MLS Grid
- 2022-10-13 Price Changed $199,900 REALTRACS as Distributed by MLS Grid
- 2022-09-28 Price Changed $209,900 REALTRACS as Distributed by MLS Grid
- 2022-09-20 Price Changed $219,000 REALTRACS as Distributed by MLS Grid
- 2022-09-15 Price Changed $223,000 REALTRACS as Distributed by MLS Grid
- 2022-09-06 Listed $225,000 REALTRACS as Distributed by MLS Grid
- 2022-03-24 Sold (Public Records) $85,000 Public Records
- 2022-03-24 Sold (MLS) $85,000 REALTRACS as Distributed by MLS Grid
- 2022-02-28 Listing Removed — REALTRACS as Distributed by MLS Grid
- 2022-02-28 Listed $89,900 REALTRACS as Distributed by MLS Grid
- 2015-03-20 Sold (MLS) $27,000 REALTRACS as Distributed by MLS Grid
- 2015-03-12 Pending — REALTRACS as Distributed by MLS Grid
- 2015-01-06 Listed $27,900 REALTRACS as Distributed by MLS Grid
- 2014-05-07 Listed $27,900 REALTRACS as Distributed by MLS Grid
Property tax history
-0.7%/yrLatest (2025): $445 · -47.0% YoY. Source: county tax records.
Cash-flow waterfall
monthlySold comps — $/sqft
last 12 mo · ≤1 miLoading sold comps…