 🏷️ Likely Rental
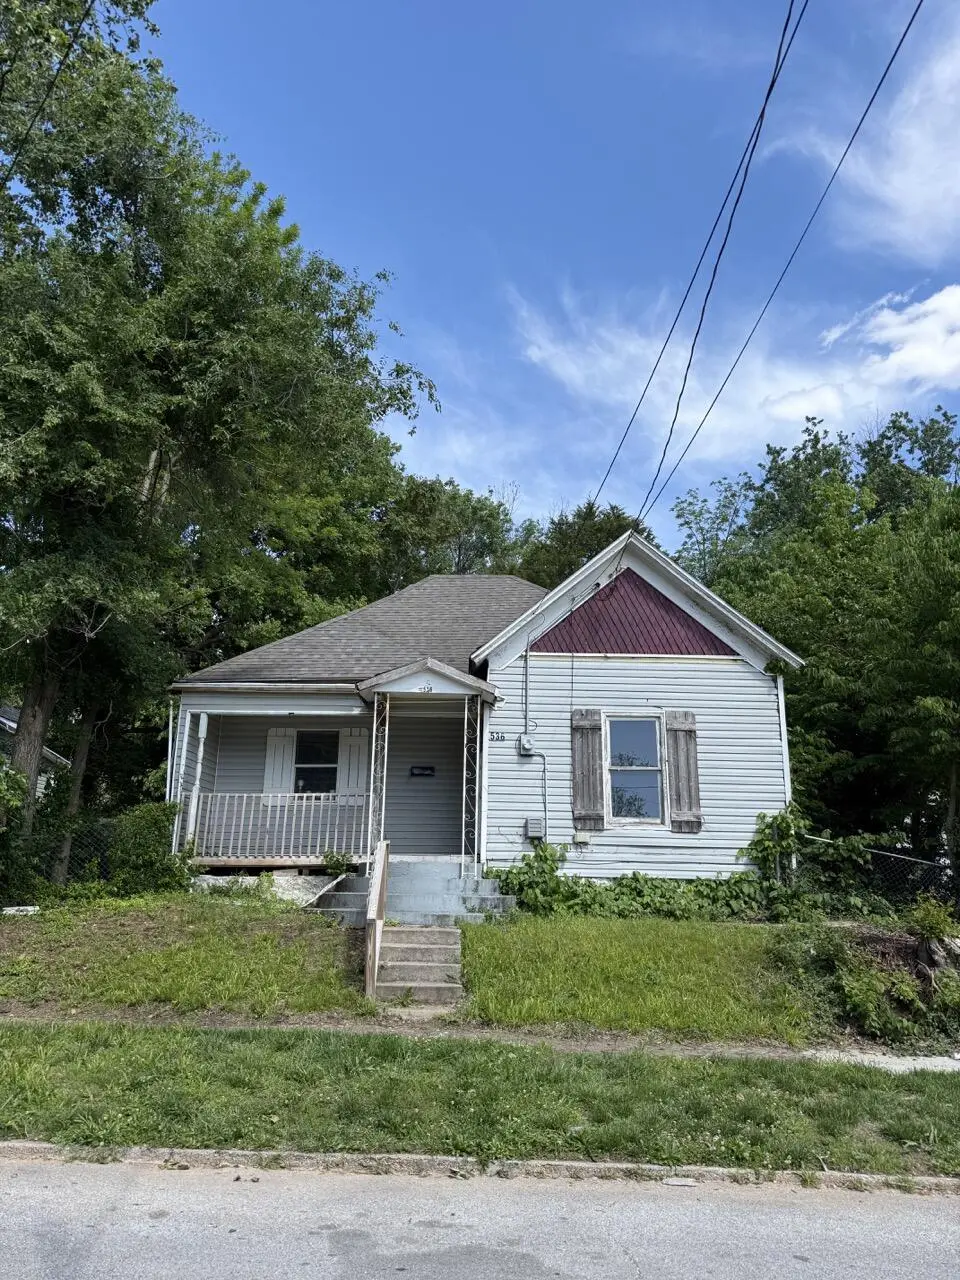
536 S Broadway Ave · Springfield, MO
Flood risk 1/10 · Minimal
- FEMA flood zone
- X (unshaded)
- Chance of flooding over 30 yrs
- 0.0%
- Est. flood insurance / yr
- $507 – $1,088
Fire risk 1/10 · Minimal
- Est. fire insurance / yr
- $1,054 – $1,958
Heat risk 5/10 · Moderate
- Hot days now (above 104°F)
- 7 days/yr
- Hot days in 30 yrs
- 19 days/yr
Wind risk 2/10 · Minimal
- Chance of severe wind over 30 yrs
- —
Air-quality risk 2/10 · Minimal
- Unhealthy air days now
- 1 days/yr
- Unhealthy air days in 30 yrs
- 2 days/yr
Risk factors via First Street. Map © Google.
Why this score? — see what drove the C+ grade
The composite is a weighted blend of 9 inputs, each scored 0–100. Each bar is that input's sub-score; the figure is the points it added to the 100-point composite (weight × sub-score).
- Cash flow +23.6/30.0
- ARV discount +15.0/15.0
- DSCR +7.6/10.0
- 1% rule +5.0/10.0
- Livability +3.8/5.0
- Rent growth +3.5/5.0
- Schools +3.2/10.0
- Condition / age +2.5/5.0
- Appreciation +0.0/10.0
$100,000
🖨 Deal sheet (PDF) 📄 Offer letter ✓ Due diligence
Listing remarks
Investor opportunity with tenant already in place in a convenient Springfield location. This 2 bed, 1 bath home offers immediate rental income potential with easy access to downtown, shopping, dining, and local amenities. Functional layout with strong long-term upside for investors looking to expand their portfolio. Sold as-is.
Key facts
- Local amenities
- 3,920 sq ft lot
- Built 1906
Tags
Property features AI
Finance
- Other: No additional financial amenities provided
- Financial info: No investor or rental income details provided
- HOA & community: No HOA details provided
Exterior
- Parking: No parking details provided
- Security: No security details provided
- Utilities: Public water; Public sewer
- Home design: Single-family residence; Residential property; One story
- Construction: No construction material, roof, or foundation details provided; Built area above grade: 975
- Exterior features: Lot approximately 0.09 acres
Interior
- Kitchen: No specific kitchen appliance details provided
- Bedrooms: Bedrooms on main level
- Flooring: No flooring details provided
- Bathrooms: 1 full bathroom
- Heating & cooling: Has heating; Other type of heating; No central cooling
- Interior features: One-level layout
- Laundry & utility: No laundry/utility details provided
Neighborhood map
What this means for you Summary
Snapshot
- This is a 2-bed/1.0-bath single-family listed at $100k.
Deal economics
- At list price, monthly cash flow is $188 ($2k/yr) — positive.
- The deal already cash-flows at list — no discount required.
- Meets the 1% rule at list price ($1k rent vs $100k).
- Recommended offer: $97k (3.0% below list) — sets the bar for market timing.
- Cap rate 8.5% vs local median 4.6% in Springfield — top-decile yield for the area; either an underpriced asset or a hidden risk that comps aren't pricing in. Stress-test before assuming the spread holds.
Location & tenants
- Location reads 75/100 on livability (#57 in MO, #4,121 nationally) — a middle-class / working-renter tenant base. Strengths: commute A+, cost of living A+, housing A+; Watch: crime F, employment F.
- Springfield R-XII (urban): math 32% / reading 46% proficiency, ranked #174 of 324 in MO (top 54%) — families likely to look elsewhere, expect single-tenant / working-renter base with shorter leases.
- Zoned schools: Mcgregor Elem. (math 12% / reading 17%, grade F, #993 of 1,115 statewide, top 90%, 271 students, 90% FRL); Parkview High (math 11% / reading 40%, grade F, #433 of 521 statewide, top 83%, 1,234 students, 62% FRL) — zoned schools average 76% FRL vs 46% district-wide (30 pts higher); higher-poverty schools than district average — tighter screening recommended.
- Zoned-school proficiency averages 20% at this address vs 39% district-wide (-19 pts) — the specific schools serving this property underperform the Springfield R-XII average; the district grade overstates school quality for this exact location.
- Market conditions: Rents rising fast (+4.2%/yr); 86 active listings in the ZIP; 40 comparable units currently listed for rent nearby; rentals at typical pace (median 24d on market — plan ~3-4 weeks tenant-placement turnaround); 42% of comp listings sitting > 30 days — soft ceiling on asking rent; lower-income renter base — watch delinquency; 1,302 units permitted in Greene County in 2024 (250 in 5+ unit buildings).
Forward outlook
- Local home prices are declining (-3.0%/yr); year-one equity from $691 of loan paydown is wiped out by about $3k of value loss. Plan a longer hold.
- Greene County population projected at +25% by 2050 — long-run rental-demand tailwind backs the buy-and-hold thesis.
Negotiation context
- It's been on market 35 days — a 3% lower offer ($97k) is reasonable based on typical stale-listing flexibility.
- 4 sale attempts since 10y ago with the ask held roughly flat each time — persistent listings suggest the price (not the market) is what's stuck; bring a comps-based counter.
- Current owner paid $36k; list at $100k implies a 178% gain — meaningful room to come down on a strong offer.
Risks & watch-outs
- Watch-outs: built in 1906 — expect roof / HVAC / electrical / plumbing capex.
- Climate carrying-cost: extreme-heat days projected 7→19/yr by 2055 (HVAC capex compounding) — expect insurance premiums to compound above CPI over the hold.
Questions for the listing agent
- It's been on market 35 days. Have you received any prior offers? Is the seller open to a 3% concession, seller financing, or rate buy-down credit?
- Built in 1906 — when were the roof, HVAC, electrical panel, plumbing, and water heater last replaced?
- Is there a deadline driving the sale (1031 exchange, divorce, estate, relocation)? That informs how much negotiation room exists.
- Crime grade is F in this area — have there been break-ins, vandalism, or insurance claims at this property in the last 3 years? What carrier currently insures it and at what premium?
- What's the average days-on-market for RENTAL listings here right now (not sales)? A rising rental-DOM trend means longer vacancies and softer asking-rent achievability than the comps imply.
- What's the recent tenant-quality profile in this submarket — average credit score on applications, eviction rate, late-payment / NSF rate, and stable-employment percentage? A property-management company in the area should have these aggregated.
- How much new for-sale + rental construction is in the pipeline within 1–3 miles? Heavy new supply typically softens prices + rents 12–24 months out; constrained supply supports both.
Investment metrics
- 1% rule
- 1.00% ✓
- Cap rate
- 8.55%
- Cash-on-cash
- 8.05%
- DSCR
- 1.36
- GRM
- 8.3
CMA / ARV
- ARV (median comp)
- $126,525
- List price
- $100,000
- Delta
- -20.96%
- Verdict
- UNDERPRICED
- Comps
- 20 within 1.0 mi
Show comp detail 12 sales within ~0.75 mi
| Address | Dist | Beds/Ba | Sqft | Sold | Price | $/sf | Match |
|---|---|---|---|---|---|---|---|
| 925 W Mount Vernon St | 0.03mi | 2/1.0 | 990 (+2%) | 6mo | $129,900 | $131 | 91 |
| 735 S Missouri Ave | 0.24mi | 2/1.0 | 904 (-7%) | 0mo | $140,000 | $155 | 76 |
| 864 S Main Ave | 0.51mi | 2/1.0 | 968 (-1%) | 2mo | $182,000 | $188 | 74 |
| 920 S Douglas Ave | 0.49mi | 3/1.0 (+1) | 956 (-2%) | 1mo | $139,900 | $146 | 68 |
| 1206 W Elm St | 0.22mi | 3/2.0 (+1) | 1,020 (+5%) | 7mo | $115,000 | $113 | 68 |
| 421 S Fort Ave | 0.30mi | 3/1.0 (+1) | 1,034 (+6%) | 6mo | $80,000 | $77 | 66 |
| 936 S Douglas Ave | 0.52mi | 3/1.5 (+1) | 1,000 (+3%) | 2mo | $89,000 | $89 | 63 |
| 437 S Nettleton Ave | 0.44mi | 2/1.0 | 1,074 (+10%) | 1mo | $55,000 | $51 | 62 |
| 900 S Missouri Ave | 0.43mi | 3/2.0 (+1) | 1,050 (+8%) | 2mo | $160,000 | $152 | 57 |
| 646 S Fort Ave | 0.27mi | 3/2.0 (+1) | 1,116 (+14%) | 2mo | $169,900 | $152 | 53 |
| 942 S Market Ave | 0.63mi | 2/1.0 | 884 (-9%) | 6mo | $139,000 | $157 | 50 |
| 1530 W Lombard St | 0.64mi | 2/1.0 | 840 (-14%) | 1mo | $145,000 | $173 | 46 |
Match score weights: distance 35% · size 25% · config 20% · recency 20%. Top-matched comps best support the ARV.
Projected returns pro-forma
-3.0% appreciation · 4.17% rent growth · sell at horizon
- IRR
- -2.9%
- Equity multiple
- 0.89×
- Total profit
- $-3,087
- Equity at exit
- $14,910
- IRR
- 7.9%
- Equity multiple
- 1.63×
- Total profit
- $17,576
- Equity at exit
- $8,646
Cash invested: $28,000 (down + closing). Projections, not guarantees.
Landlord ↔ Tenant lean methodology
- Overall (STATE)
- 81 Strongly Landlord-Friendly
- State Missouri
- 81 Strongly Landlord-Friendly · R+10
- County
- — inherits STATE
- City
- — inherits STATE
ZIP-level market 65806
- Home prices YoY
- -11.7%
- Rents YoY
- 4.2%
- Active inventory
- 86
- Price-to-rent
- 8.3×
Monthly cashflow live
- Estimated rent
- $1,002 high interval (Pro) →
- Mortgage (P&I)
- −$524
- Tax from tax record
- −$38 /mo · $455/yr
- Insurance
- −$42
- HOA
- −$0
- Vacancy / Maint / Mgmt
- −$210
- Net cashflow
- $188
Break-even live
Sensitivity live
| Price | -10% $244 | -5% $216 | +0% $188 | +5% $160 | +10% $131 |
|---|---|---|---|---|---|
| Rent | -10% $109 | -5% $148 | +0% $188 | +5% $227 | +10% $267 |
| Rate | -1.0pp $238 | -0.5pp $213 | base $188 | +0.5pp $162 | +1.0pp $136 |
UW: 25.0% down · 7.5% · 30yr · 1.5% tax · 5.0% vac · 8.0% maint · 8.0% mgmt
Financing live
Cash to close
- Down payment
- $25,000
- Closing costs
- $3,000
- Reserves months
- —
- Total cash needed
- —
Loan-product check · same deal, 3 products live
Conventional
25% down · 7.5% · 30yr
- Down + closing
- —
- Monthly P&I
- —
- Monthly cashflow
- —
- DSCR
- —
- Eligible?
- —
Personal DTI + credit; lowest rate.
DSCR
20% down · 8.5% · 30yr
- Down + closing
- —
- Monthly P&I
- —
- Monthly cashflow
- —
- DSCR
- —
- Eligible?
- —
No personal income docs; deal must DSCR.
Hard money
10% down · 12.0% · 12mo
- Down + closing
- —
- Monthly P&I
- —
- Monthly cashflow
- —
- DSCR
- —
- Eligible?
- —
Short-term bridge; refi at stabilization.
Rent comps 40 comps
| Address | Beds | Baths | Sqft | Rent | $/sqft | DOM | Units | Dist |
|---|---|---|---|---|---|---|---|---|
| 513 S Broadway Ave Springfield, MO | 2.0 | 1.0 | 800 | $855 | $1.07 | 44d | 1 | 0.04mi |
| 930 W Harrison St Springfield, MO | 3.0 | 2.0 | 1046 | $1,150 | $1.10 | 14d | 1 | 0.13mi |
| 865 S Douglas Ave Springfield, MO | 2.0 | 2.0 | 850 | $895 | $1.05 | 14d | 4 | 0.17mi |
| 1200 W Walnut St Springfield, MO | 2.0 | 2.0 | 1000 | $995 | $0.99 | 14d | 3 | 0.24mi |
| 1036 W Monroe Ter Springfield, MO | 2.0 | 1.0 | 812 | $795 | $0.98 | 24d | 1 | 0.29mi |
| 733 W College St Springfield, MO | 1.0 | 1.0 | 700 | $750 | $1.07 | 14d | 1 | 0.30mi |
| 627 S Fort Ave Springfield, MO | 2.0 | 1.0 | 880 | $895 | $1.02 | 24d | 1 | 0.30mi |
| 535 W Walnut St Springfield, MO | 2.0 | 2.0 | 1096 | $1,495 | $1.36 | 44d | 1 | 0.39mi |
| 847 S Grant Ave Springfield, MO | 2.0 | 1.0 | 1080 | $815 | $0.75 | 44d | 1 | 0.45mi |
| 211 S Market Ave Springfield, MO | 2.0–4.0 | 1.0–2.0 | 1442 | $1,425 | $0.99 | 24d | 5 | 0.46mi |
| 211 S Market Ave Springfield, MO | 2.0–4.0 | 1.0–2.0 | 1442 | $1,425 | $0.99 | 21d | 5 | 0.46mi |
| 430 W Pershing St Springfield, MO | 2.0 | 2.0 | 765 | $1,195 | $1.56 | 14d | 1 | 0.49mi |
| 305 S Campbell Ave Unit 208 Springfield, MO | 1.0 | 1.0 | 649 | $975 | $1.50 | 14d | 1 | 0.51mi |
| 235 N Market Ave Springfield, MO | 1.0–4.0 | 1.0–2.0 | 1350 | $1,267 | $0.94 | 14d | 4 | 0.51mi |
| 235 N Market Ave Springfield, MO | 1.0–4.0 | 1.0–2.0 | 1350 | $1,267 | $0.94 | 24d | 5 | 0.51mi |
| 301 W State St Unit D Springfield, MO | 1.0 | 1.0 | 570 | $875 | $1.54 | 24d | 1 | 0.55mi |
| 209 W McDaniel St Unit 209-207 Springfield, MO | 1.0 | 1.0 | 700 | $950 | $1.36 | 44d | 1 | 0.61mi |
| 741 South Ave Unit 5 Springfield, MO | 1.0 | 1.0 | 950 | $750 | $0.79 | 44d | 1 | 0.62mi |
| 505 W Grand St Springfield, MO | 1.0–2.0 | 1.0–2.0 | 996 | $1,395 | $1.40 | 14d | 1 | 0.63mi |
| 138 Park Central Sq Springfield, MO | 1.0–2.0 | 1.0–2.0 | 1083 | $2,489 | $2.30 | 14d | 8 | 0.63mi |
| 755 South Ave Unit 2 Springfield, MO | 1.0 | 1.0 | 600 | $850 | $1.42 | 24d | 1 | 0.64mi |
| 433 W Grand St Unit C Springfield, MO | 2.0 | 1.0 | 1023 | $1,295 | $1.27 | 44d | 1 | 0.66mi |
| 806 South Ave Springfield, MO | 1.0 | 1.0 | 670 | $1,085 | $1.62 | 14d | 3 | 0.69mi |
| 1044 S Main Ave Springfield, MO | 2.0 | 1.0 | 1089 | $1,050 | $0.96 | 44d | 1 | 0.71mi |
| 901 South Ave Springfield, MO | 2.0–3.0 | 1.0–2.0 | 695 | $825 | $1.19 | 44d | 1 | 0.72mi |
| 309 S Jefferson Ave Unit 211 Springfield, MO | 2.0 | 2.0 | 762 | $767 | $1.01 | 44d | 1 | 0.73mi |
| 1740 W Olive St Springfield, MO | 3.0 | 1.0 | 736 | $1,195 | $1.62 | 14d | 1 | 0.76mi |
| 813 W Poplar St Unit 813 Springfield, MO | 2.0 | 1.0 | 560 | $795 | $1.42 | 14d | 1 | 0.76mi |
| 1112 S Grant Ave Springfield, MO | 1.0 | 1.0 | 800 | $1,095 | $1.37 | 44d | 1 | 0.78mi |
| 1911 W Elm St Springfield, MO | 2.0 | 1.0 | 580 | $875 | $1.51 | 44d | 1 | 0.81mi |
| 810 W Catalpa St Apt 302 Springfield, MO | 2.0 | 1.0 | 806 | $664 | $0.82 | 24d | 1 | 0.82mi |
| 810 W Catalpa St Apt 316 Springfield, MO | 1.0 | 1.0 | 581 | $551 | $0.95 | 24d | 1 | 0.82mi |
| 511 E Cherry St Unit 2 Springfield, MO | 1.0 | 1.0 | 700 | $850 | $1.21 | 44d | 1 | 0.84mi |
| 815 N Grant Ave Unit A Springfield, MO | 2.0 | 1.0 | 801 | $625 | $0.78 | 44d | 1 | 0.85mi |
| 533 Bear Blvd Unit 111 Springfield, MO | 1.0 | 1.0 | 1100 | $649 | $0.59 | 44d | 1 | 0.88mi |
| 647 W Central St Springfield, MO | 3.0 | 1.0 | 882 | $1,050 | $1.19 | 24d | 1 | 0.91mi |
| 627 Bear Blvd Springfield, MO | 2.0 | 2.0 | 943 | $1,400 | $1.48 | 44d | 2 | 0.97mi |
| 916 N Kansas Expy Springfield, MO | 1.0 | 1.0 | 573 | $595 | $1.04 | 44d | 1 | 1.04mi |
| 2204 W Madison St Springfield, MO | 3.0 | 1.0 | 960 | $1,095 | $1.14 | 14d | 1 | 1.12mi |
| 522 N Park Ave Springfield, MO | 1.0 | 1.0 | 608 | $950 | $1.56 | 44d | 1 | 1.17mi |
Listing history 20 events
-
2026-06-18days on market $100,000 Active 35 DOM
-
2026-06-17days on market $100,000 Active 34 DOM
-
2026-06-16days on market $100,000 Active 33 DOM
-
2026-06-15days on market $100,000 Active 32 DOM
-
2026-06-14days on market $100,000 Active 30 DOM
-
2026-06-10days on market $100,000 Active 27 DOM
-
2026-06-09days on market $100,000 Active 26 DOM
-
2026-06-08days on market $100,000 Active 25 DOM
-
2026-06-07days on market $100,000 Active 24 DOM
-
2026-06-03days on market $100,000 Active 20 DOM
-
2026-06-02days on market $100,000 Active 19 DOM
-
2026-06-01days on market $100,000 Active 18 DOM
-
2026-05-31days on market $100,000 Active 17 DOM
-
2026-05-30days on market $100,000 Active 16 DOM
-
2026-05-14$100,000 Active 329-char remark
-
2024-03-31historical $895
-
2024-03-20$895
-
2021-03-12soldstatus $36,000
-
2017-06-19$459,900
-
2016-07-29$81,136
ⓘ Source: listings_history table (triggers on properties + properties_extension) + one-shot
backfill from property_details.listing_events for pre-trigger history.
Tax reassessment forecast MO · Resets to sale price
- Current annual tax
- $455 · $38/mo
- Projected year-2 tax
- $970 · $81/mo
- Expected delta
- +$515/yr (+$43/mo · 113.0%)
ⓘ Screening estimate from a state-policy table — verify with the county assessor before closing.
Climate risk First Street
- Flood 1/10 Low FEMA zone X (unshaded) · 0% chance over 30 yrs
- Wildfire 1/10 Low
- Heat 5/10 Major 7 d/yr ≥104°F today · 19 d/yr by 30 yrs out
- Wind 2/10 Low
- Air quality 2/10 Low 1 unhealthy d/yr today · 2 by 30 yrs out
Nearby sold comps map
Loading sold comps map…
Walkable amenities ~0.75 mi
Loading nearby amenities…
Taxation est. · year 1
- Rental income
- $12,028
- − Mortgage interest
- −$5,602
- − Property taxes
- −$455
- − Insurance
- −$500
- − Repairs & maintenance
- −$962
- − Management
- −$962
- − Depreciation
- −$2,909
- Taxable income
- $637
- Est. tax owed @ 24.0%
- −$153
- After-tax cash flow
- $2,101/yr
For passive investors: Depreciation is non-cash, so a rental often shows a tax loss while cash-flowing — sheltering income. Rental losses are passive: they offset passive income freely, and up to $25,000/yr can offset ordinary (W-2) income if you actively participate and your MAGI is under $100k (phasing out to $0 by $150k); unused losses carry forward. On sale, claimed depreciation is recaptured at up to 25%, and gains may owe capital-gains tax (a 1031 exchange can defer both). Figures are a year-1 estimate at your 24.0% rate — not tax advice; consult a CPA.
Schools (NCES district)
- District
- Springfield R-XII
- NCES district ID
- 2928860
- Math proficiency
- 32% ▼ -2.00%
- Reading proficiency
- 46% ▼ -3.00%
- Median HH income
- $37,886
- Composite
- 32.45/100
- National rank
- #5717
- State rank
- #174 of 324 in MO
Livability — Springfield
- Score
- 75/100
- State rank
- #57
- US rank
- #4121
Category grades
Schools grade is shown separately in the Schools card above.
Census & demographics
- Census place
- Springfield, MO
- County
- Greene County · 244,327 people
- City population
- 223,044
- Metro
- Springfield, MO
- Population (ZIP)
- 13,692
- Household income
- $28,165
- Rent vs Own
- Severe rent burden
- 1966.0
Population outlook (Greene County) Hauer SSP2
- Today (2025)
- 319,054 people
- By 2030
- 335,135 · +5.0%
- By 2040
- 366,186 · +14.8%
- By 2050
- 397,431 · +24.6%
- By 2075
- 477,035 · +49.5%
- By 2100
- 520,828 · +63.2%
Race, ethnicity, and origin ACS 2023
- Neighborhood character
- Predominantly White (75%)
- Race & ethnicity
- White 75% Two or more races 8% Hispanic / Latino 7% Black 6% Asian 3%
- Hispanic origin (detail)
- Mexican 4%
- Common ancestry
- Slovak 2% Italian 1% Scotch-Irish 1%
- Foreign-born
- 7% · Canada, China, Vietnam
- Languages at home
- 91% English-only · Spanish 4% Other Indo-European 2% Other Asian/Pacific 1%
Political lean MEDSL · Greene
- 2024 margin
- Strong R (+20.8) · D 38.9% · R 59.7% · Other 1.4%
- 2008→2024 swing
- -5.0pp toward R · 2008: -15.8pp · 2024: -20.8pp
- All cycles
- 2024: R+20.8 2020: R+20.1 2016: R+27.4 2012: R+24.4 2008: R+15.8
Not yet ingested
- Civics
- —
Market trends
- HPI YoY
- ▼ -27.72%
- Current HPI
- 208.8156
- Rent YoY
- ▲ 4.17%
- Metro
- Springfield, MO
- State GDP YoY
- ▲ 1.84%
- F500 in state
- 20
Industry mix (Fortune 500 HQ in MO)
| Industry | F500 HQs | Revenue |
|---|---|---|
| Healthcare | 1 | $163B |
|
||
| Insurance | 1 | $21B |
|
||
| Industrial Technology | 1 | $17B |
|
||
| Retail | 1 | $16B |
|
||
| Industrial Distribution | 1 | $10B |
|
||
| Utilities | 1 | $9B |
|
||
Price history
+23.2% since first listed6 events — show timeline
- 2026-05-14 Listed $100,000 SOMO
- 2024-03-31 Rental Removed $895 APPFOLIO
- 2024-03-20 Listed for Rent $895 APPFOLIO
- 2021-03-12 Sold (Public Records) $36,000 Public Records
- 2017-06-19 Listed $459,900 SOMO
- 2016-07-29 Listed $81,136 SOMO
Property tax history
+0.7%/yrLatest (2025): $455 · +24.1% YoY. Source: county tax records.
Cash-flow waterfall
monthlySold comps — $/sqft
last 12 mo · ≤1 miLoading sold comps…