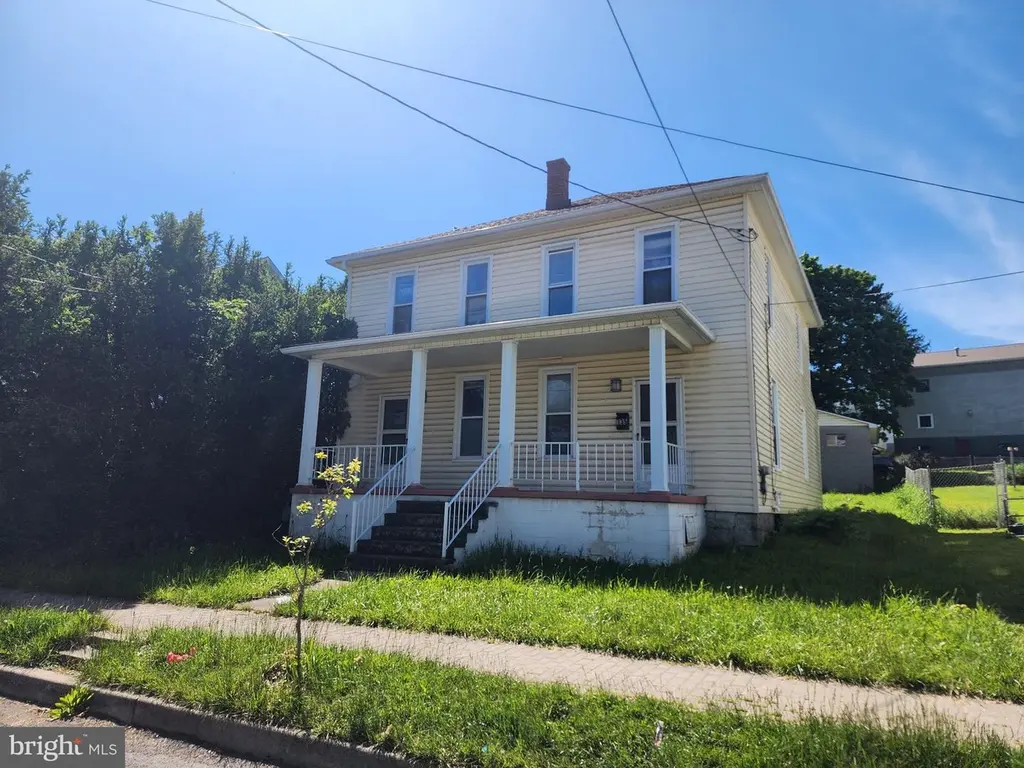
135-137 Center St · Frostburg, MD
Flood risk 1/10 · Minimal
- FEMA flood zone
- X (unshaded)
- Chance of flooding over 30 yrs
- 0.0%
- Est. flood insurance / yr
- $473 – $860
Fire risk 1/10 · Minimal
- Est. fire insurance / yr
- $755 – $1,403
Heat risk 3/10 · Minor
- Hot days now (above 91°F)
- 8 days/yr
- Hot days in 30 yrs
- 19 days/yr
Wind risk 2/10 · Minimal
- Chance of severe wind over 30 yrs
- —
Air-quality risk 2/10 · Minimal
- Unhealthy air days now
- 0 days/yr
- Unhealthy air days in 30 yrs
- 1 days/yr
Risk factors via First Street. Map © Google.
Why this score? — see what drove the C grade
The composite is a weighted blend of 9 inputs, each scored 0–100. Each bar is that input's sub-score; the figure is the points it added to the 100-point composite (weight × sub-score).
- Cash flow +20.8/30.0
- ARV discount +15.0/15.0
- DSCR +6.6/10.0
- 1% rule +5.0/10.0
- Livability +4.4/5.0
- Rent growth +2.5/5.0
- Condition / age +2.5/5.0
- Schools +1.9/10.0
- Appreciation +0.0/10.0
$119,900
🖨 Deal sheet 📄 Offer letter ✓ Due diligence
Listing remarks
Great duplex in Frostburg ready for a new owner. Each side has 2 bedrooms and a bath upstairs. The 135 side has an extra bathroom off of the kitchen. Both units are plumbed for laundry in the main level. The siding has been updated but needs cleaned. All appliances convey. There is an amazing 2 car garage in the back yard that will need some improvements, but is very solid. This unit has been maintained with the city of Frostburg and should be in compliance with rental regulations. Check with the city to confirm.
Key facts
- Updated siding
- Extra bathroom
- Plumbed for laundry
Tags
Property features AI
Finance
- Other: Fee simple ownership; Pets allowed with no pet restrictions; Above-grade finished area approximately 2,170 (assessor source)
Exterior
- Parking: Detached oversized rear-entry garage with 2 garage spaces; Alley access
- Utilities: Public water; Public sewer; Natural gas service
- Home design: Detached property; Framed construction
- Construction: Stone foundation; Frame construction; Year built: estimated
- Exterior features: Not in a federal flood zone; Annually paid ground rent; No tidal water
Interior
- Bedrooms: Four bedrooms on the upper level
- Bathrooms: Three full bathrooms (two on upper level, one on main level)
- Heating & cooling: 90% efficiency forced air heating; Natural gas heating and hot water
- Interior features: Basement present (partial, dirt floor); Two or more access exits; 32+ inch wide doors
Neighborhood map
What this means for you Summary
Snapshot
- This is a 4-bed/2.0-bath single-family listed at $120k.
Deal economics
- At list price, monthly cash flow is $164 ($2k/yr) — positive.
- The deal already cash-flows at list — no discount required.
- Meets the 1% rule at list price ($1k rent vs $120k).
- Recommended offer: $116k (3.0% below list) — sets the bar for market timing.
- Cap rate 7.9% vs local median 4.2% in Frostburg — top-decile yield for the area; either an underpriced asset or a hidden risk that comps aren't pricing in. Stress-test before assuming the spread holds.
Location & tenants
- Location reads 87/100 on livability (#7 in MD, #287 nationally) — a professional / high-income tenant draw. Strengths: crime A+, amenities A+, cost of living A+; Watch: employment F.
- Allegany County Public Schools (other): math 15% / reading 30% proficiency, ranked #18 of 24 in MD (top 75%) — low school quality limits family demand, transient renter base, plan for 1-2y turnover.
- Zoned schools: Beall Elementary (math 19% / reading 30%, grade F, #260 of 860 statewide, top 33%, 451 students, 63% FRL); Mount Savage Middle (math 15% / reading 38%, grade F, #86 of 225 statewide, top 40%, 425 students, 54% FRL); Mountain Ridge High School (math 32% / reading 72%, grade D+, #100 of 222 statewide, top 47%, 736 students, 48% FRL).
- Market conditions: 102 active listings in the ZIP; 1 comparable units currently listed for rent nearby; 24 units permitted in Allegany County in 2024 (0 in 5+ unit buildings).
Forward outlook
- Local home prices are declining (-3.0%/yr); year-one equity from $829 of loan paydown is wiped out by about $4k of value loss. Plan a longer hold.
- Allegany County population projected at -14% by 2050 — secular population decline; favor cash flow + early exit over multi-decade hold.
Negotiation context
- It's been on market 37 days — a 3% lower offer ($116k) is reasonable based on typical stale-listing flexibility.
- 3 sale attempts since 30y ago with the ask held roughly flat each time — persistent listings suggest the price (not the market) is what's stuck; bring a comps-based counter.
- Current owner paid $72k; list at $120k implies a 65% gain — meaningful room to come down on a strong offer.
Risks & watch-outs
- Watch-outs: built in 1930 — expect roof / HVAC / electrical / plumbing capex.
Questions for the listing agent
- It's been on market 37 days. Have you received any prior offers? Is the seller open to a 3% concession, seller financing, or rate buy-down credit?
- Built in 1930 — when were the roof, HVAC, electrical panel, plumbing, and water heater last replaced?
- Is there a deadline driving the sale (1031 exchange, divorce, estate, relocation)? That informs how much negotiation room exists.
- What's the average days-on-market for RENTAL listings here right now (not sales)? A rising rental-DOM trend means longer vacancies and softer asking-rent achievability than the comps imply.
- What's the recent tenant-quality profile in this submarket — average credit score on applications, eviction rate, late-payment / NSF rate, and stable-employment percentage? A property-management company in the area should have these aggregated.
- How much new for-sale + rental construction is in the pipeline within 1–3 miles? Heavy new supply typically softens prices + rents 12–24 months out; constrained supply supports both.
Investment metrics
- 1% rule
- 1.00% ✓
- Cap rate
- 7.94%
- Cash-on-cash
- 5.87%
- DSCR
- 1.26
- GRM
- 8.3
CMA / ARV
- ARV (median comp)
- $153,166
- List price
- $119,900
- Delta
- -21.72%
- Verdict
- UNDERPRICED
- Comps
- 20 within 1.0 mi
Show comp detail 12 sales within ~0.75 mi
| Address | Dist | Beds/Ba | Sqft | Sold | Price | $/sf | Match |
|---|---|---|---|---|---|---|---|
| 108 Wood St | 0.08mi | 4/1.5 | 2,303 (+6%) | 7mo | $185,000 | $80 | 78 |
| 73 Hill St | 0.22mi | 4/2.0 | 2,342 (+8%) | 8mo | $110,000 | $47 | 70 |
| 93 Washington St | 0.39mi | 3/1.5 (-1) | 2,080 (-4%) | 2mo | $180,000 | $87 | 66 |
| 51 W Main St | 0.41mi | 5/2.0 (+1) | 2,316 (+7%) | 0mo | $145,000 | $63 | 64 |
| 153 Bowery St | 0.23mi | 5/2.0 (+1) | 1,920 (-12%) | 6mo | $130,000 | $68 | 60 |
| 174 Spring St | 0.45mi | 5/2.0 (+1) | 2,016 (-7%) | 3mo | $165,000 | $82 | 60 |
| 102 Maple St | 0.14mi | 5/2.0 (+1) | 1,904 (-12%) | 10mo | $150,000 | $79 | 60 |
| 160 Washington St | 0.62mi | 3/2.0 (-1) | 1,985 (-8%) | 2mo | $260,000 | $131 | 50 |
| 256 E Main St | 0.49mi | 3/1.0 (-1) | 1,916 (-12%) | 3mo | $199,900 | $104 | 46 |
| 98 Braddock Rd | 0.48mi | 3/1.0 (-1) | 1,886 (-13%) | 14mo | $200,000 | $106 | 35 |
| 109 Main St | 0.60mi | 5/2.0 (+1) | 1,856 (-14%) | 16mo | $150,000 | $81 | 30 |
| 151 Frost Ave | 0.70mi | 3/2.0 (-1) | 2,480 (+14%) | 20mo | $220,500 | $89 | 22 |
Match score weights: distance 35% · size 25% · config 20% · recency 20%. Top-matched comps best support the ARV.
Projected returns pro-forma
-3.0% appreciation · 3.0% rent growth · sell at horizon
- IRR
- -7.2%
- Equity multiple
- 0.73×
- Total profit
- $-8,985
- Equity at exit
- $17,877
- IRR
- 2.3%
- Equity multiple
- 1.17×
- Total profit
- $5,597
- Equity at exit
- $10,367
Cash invested: $33,572 (down + closing). Projections, not guarantees.
Landlord ↔ Tenant lean methodology
- Overall (STATE)
- 27 Tenant-Leaning
- State Maryland
- 27 Tenant-Leaning · D+14
- County
- — inherits STATE
- City
- — inherits STATE
ZIP-level market 21532
- Home prices YoY
- -24.2%
- Active inventory
- 102
- Price-to-rent
- 8.3×
Monthly cashflow live
- Estimated rent
- $1,200 medium interval (Pro) →
- Mortgage (P&I)
- −$629
- Tax from tax record
- −$105 /mo · $1,262/yr
- Insurance
- −$50
- HOA
- −$0
- Vacancy / Maint / Mgmt
- −$252
- Net cashflow
- $164
Break-even live
UW: 25.0% down · 7.5% · 30yr · 1.5% tax · 5.0% vac · 8.0% maint · 8.0% mgmt
Financing live
Cash to close
- Down payment
- $29,975
- Closing costs
- $3,597
- Reserves months
- —
- Total cash needed
- —
Loan-product check · same deal, 3 products live
Conventional
25% down · 7.5% · 30yr
- Down + closing
- —
- Monthly P&I
- —
- Monthly cashflow
- —
- DSCR
- —
- Eligible?
- —
Personal DTI + credit; lowest rate.
DSCR
20% down · 8.5% · 30yr
- Down + closing
- —
- Monthly P&I
- —
- Monthly cashflow
- —
- DSCR
- —
- Eligible?
- —
No personal income docs; deal must DSCR.
Hard money
10% down · 12.0% · 12mo
- Down + closing
- —
- Monthly P&I
- —
- Monthly cashflow
- —
- DSCR
- —
- Eligible?
- —
Short-term bridge; refi at stabilization.
Rent comps 1 comps
| Address | Beds | Baths | Sqft | Rent | $/sqft | DOM | Units | Dist |
|---|---|---|---|---|---|---|---|---|
| 2 Bob Cat Ct Frostburg, MD | 2.0–4.0 | 1.0–2.0 | 965 | $1,200 | $1.24 | 43d | 6 | 0.61mi |
Listing history 20 events
-
2026-06-19days on market $119,900 Active 37 DOM
-
2026-06-18days on market $119,900 Active 36 DOM
-
2026-06-17days on market $119,900 Active 35 DOM
-
2026-06-16days on market $119,900 Active 34 DOM
-
2026-06-15days on market $119,900 Active 33 DOM
-
2026-06-14days on market $119,900 Active 31 DOM
-
2026-06-12days on market $119,900 Active 30 DOM
-
2026-06-09days on market $119,900 Active 27 DOM
-
2026-06-08days on market $119,900 Active 26 DOM
-
2026-06-07days on market $119,900 Active 25 DOM
-
2026-06-02days on market $119,900 Active 20 DOM
-
2026-06-01days on market $119,900 Active 19 DOM
-
2026-05-31days on market $119,900 Active 18 DOM
-
2026-05-30days on market $119,900 Active 17 DOM
-
2026-05-13$119,900 Active 518-char remark
-
2025-10-31historical
-
2025-06-11$129,900 Active
-
1996-07-30soldstatus $72,500
-
1996-02-14$80,000
-
1989-09-05soldstatus $58,000
ⓘ Source: listings_history table (triggers on properties + properties_extension) + one-shot
backfill from property_details.listing_events for pre-trigger history.
Tax reassessment forecast MD · Partial reset (capped growth)
- Current annual tax
- $1,262 · $105/mo
- Projected year-2 tax
- $1,284 · $107/mo
- Expected delta
- +$23/yr (+$2/mo · 1.8%)
ⓘ Screening estimate from a state-policy table — verify with the county assessor before closing.
Climate risk First Street
- Flood 1/10 Low FEMA zone X (unshaded) · 0% chance over 30 yrs
- Wildfire 1/10 Low
- Heat 3/10 Moderate 8 d/yr ≥91°F today · 19 d/yr by 30 yrs out
- Wind 2/10 Low
- Air quality 2/10 Low 0 unhealthy d/yr today · 1 by 30 yrs out
Nearby sold comps map
Loading sold comps map…
Walkable amenities ~0.75 mi
Loading nearby amenities…
Taxation est. · year 1
- Rental income
- $14,400
- − Mortgage interest
- −$6,716
- − Property taxes
- −$1,262
- − Insurance
- −$600
- − Repairs & maintenance
- −$1,152
- − Management
- −$1,152
- − Depreciation
- −$3,488
- Taxable income
- $30
- Est. tax owed @ 24.0%
- −$7
- After-tax cash flow
- $1,962/yr
For passive investors: Depreciation is non-cash, so a rental often shows a tax loss while cash-flowing — sheltering income. Rental losses are passive: they offset passive income freely, and up to $25,000/yr can offset ordinary (W-2) income if you actively participate and your MAGI is under $100k (phasing out to $0 by $150k); unused losses carry forward. On sale, claimed depreciation is recaptured at up to 25%, and gains may owe capital-gains tax (a 1031 exchange can defer both). Figures are a year-1 estimate at your 24.0% rate — not tax advice; consult a CPA.
Schools (NCES district)
- District
- Allegany County Public Schools
- NCES district ID
- 2400030
- Math proficiency
- 15% ▼ -26.00%
- Reading proficiency
- 30% ▼ -20.00%
- Median HH income
- $39,760
- Composite
- 18.95/100
- National rank
- #8854
- State rank
- #18 of 24 in MD
Livability — Frostburg
- Score
- 87/100
- State rank
- #7
- US rank
- #287
Category grades
Schools grade is shown separately in the Schools card above.
Census & demographics
- Census place
- Frostburg, MD
- Population (ZIP)
- 13,123
Population outlook (Allegany County) Hauer SSP2
- Today (2025)
- 68,778 people
- By 2030
- 66,766 · -2.9%
- By 2040
- 62,784 · -8.7%
- By 2050
- 59,179 · -14.0%
- By 2075
- 50,732 · -26.2%
- By 2100
- 40,837 · -40.6%
Race, ethnicity, and origin ACS 2023
- Neighborhood character
- Predominantly White (89%)
- Race & ethnicity
- White 89% Black 6% Two or more races 2% Hispanic / Latino 2% Asian 2%
- Common ancestry
- Slovak 5% Romanian 2% Italian 1%
- Foreign-born
- 3% · Canada, China
- Languages at home
- 96% English-only · Spanish 2% Chinese 1%
Political lean MEDSL · Allegany
- 2024 margin
- Solid R (+40.3) · D 28.9% · R 69.2% · Other 2.0%
- 2008→2024 swing
- -14.4pp toward R · 2008: -25.9pp · 2024: -40.3pp
- All cycles
- 2024: R+40.3 2020: R+38.3 2016: R+48.0 2012: R+32.9 2008: R+25.9
Not yet ingested
- Civics
- —
Market trends
- HPI YoY
- ▼ -78.31%
- Current HPI
- 244.5937
- Rent YoY
- —
- Metro
- —
- State GDP YoY
- ▲ 2.97%
- F500 in state
- 12
Industry mix (Fortune 500 HQ in MD)
| Industry | F500 HQs | Revenue |
|---|---|---|
| Aerospace / Defense | 1 | $71B |
|
||
| Utilities | 1 | $25B |
|
||
| Hotels | 1 | $24B |
|
||
| Consumer Goods | 1 | $7B |
|
||
| Real Estate | 1 | $6B |
|
||
| Chemicals | 1 | $2B |
|
||
Price history
+106.7% since first listed6 events — show timeline
- 2026-05-13 Listed $119,900 BRIGHT MLS
- 2025-10-31 Listing Removed — BRIGHT MLS
- 2025-06-11 Listed $129,900 BRIGHT MLS
- 1996-07-30 Sold (MLS) $72,500 MRIS
- 1996-02-14 Listed $80,000 MRIS
- 1989-09-05 Sold (Public Records) $58,000 Public Records
Property tax history
+0.8%/yrLatest (2025): $1,262 · +4.8% YoY. Source: county tax records.
Cash-flow waterfall
monthlySold comps — $/sqft
last 12 mo · ≤1 miLoading sold comps…