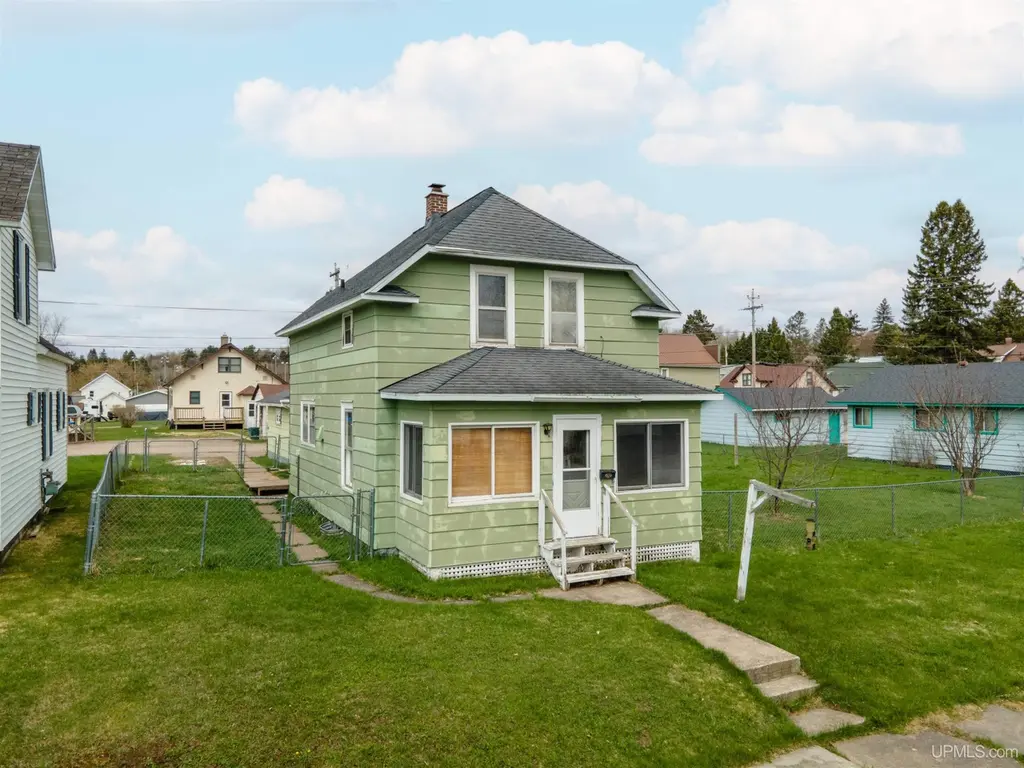
1119 N 1st Ave · Iron River, MI
Flood risk No data
- FEMA flood zone
- —
- Chance of flooding over 30 yrs
- —
- Est. flood insurance / yr
- —
Fire risk No data
- Est. fire insurance / yr
- —
Heat risk No data
- Hot days now (above threshold)
- —
- Hot days in 30 yrs
- —
Wind risk No data
- Chance of severe wind over 30 yrs
- —
Air-quality risk No data
- Unhealthy air days now
- —
- Unhealthy air days in 30 yrs
- —
Risk factors via First Street. Map © Google.
Why this score? — see what drove the C grade
The composite is a weighted blend of 9 inputs, each scored 0–100. Each bar is that input's sub-score; the figure is the points it added to the 100-point composite (weight × sub-score).
- Cash flow +27.1/30.0
- DSCR +9.4/10.0
- 1% rule +6.6/10.0
- Livability +3.7/5.0
- Schools +3.5/10.0
- Rent growth +2.5/5.0
- Condition / age +2.5/5.0
- ARV discount +2.1/15.0
- Appreciation +0.0/10.0
$95,000
🖨 Deal sheet 📄 Offer letter ✓ Due diligence
Listing remarks MLS
This 3 bedroom, 1.5 bath home is perfectly positioned just minutes from downtown on a sprawling double lot complete with an insulated 2-car detached garage. The main floor invites you in with a sun-drenched porch that flows seamlessly into spacious living and dining rooms, a bright kitchen, handy half-bath, and versatile back entry pantry. Upstairs, three cozy bedrooms provide a peaceful retreat alongside a full bathroom, while the expansive basement offers endless storage and dedicated laundry space.
Key facts
- Insulated garage
- Sun-drenched porch
- Double lot
Tags
Neighborhood map
What this means for you Summary
Snapshot
- This is a 3-bed/1.5-bath single-family listed at $95k.
Deal economics
- At list price, monthly cash flow is $269 ($3k/yr) — positive.
- The deal already cash-flows at list — no discount required.
- Meets the 1% rule at list price ($1k rent vs $95k).
- Recommended offer: $92k (3.0% below list) — sets the bar for market timing.
- Cap rate 9.7% vs local median 5.6% in Iron River — top-decile yield for the area; either an underpriced asset or a hidden risk that comps aren't pricing in. Stress-test before assuming the spread holds.
Location & tenants
- Location reads 73/100 on livability (#206 in MI) — a middle-class / working-renter tenant base. Strengths: cost of living A+, housing A+, health & safety A+; Watch: schools D, amenities F, commute F.
- West Iron County Public Schools (town): math 38% / reading 46% proficiency, ranked #204 of 540 in MI (top 38%) — families likely to look elsewhere, expect single-tenant / working-renter base with shorter leases.
- Market conditions: 131 active listings in the ZIP; 156 units permitted in Iron County in 2024 (0 in 5+ unit buildings).
Forward outlook
- Local home prices are declining (-3.0%/yr); year-one equity from $657 of loan paydown is wiped out by about $3k of value loss. Plan a longer hold.
- Iron County population projected at -26% by 2050 — secular population decline; favor cash flow + early exit over multi-decade hold.
- At projected returns (-3.0% appreciation + 3.0% rent growth), your $27k cash investment doubles in ~10 years — after that, you're playing with house money.
Negotiation context
- It's been on market 36 days — a 3% lower offer ($92k) is reasonable based on typical stale-listing flexibility.
- 4 sale attempts since 9y ago with the ask held roughly flat each time — persistent listings suggest the price (not the market) is what's stuck; bring a comps-based counter.
Risks & watch-outs
- Watch-outs: built in 1948 — expect roof / HVAC / electrical / plumbing capex.
Questions for the listing agent
- It's been on market 36 days. Have you received any prior offers? Is the seller open to a 3% concession, seller financing, or rate buy-down credit?
- Built in 1948 — when were the roof, HVAC, electrical panel, plumbing, and water heater last replaced?
- Is there a deadline driving the sale (1031 exchange, divorce, estate, relocation)? That informs how much negotiation room exists.
- Schools are D-rated, which usually means shorter tenancies and higher turnover. Who's the typical renter profile here, and what's been the actual vacancy rate?
- What's the average days-on-market for RENTAL listings here right now (not sales)? A rising rental-DOM trend means longer vacancies and softer asking-rent achievability than the comps imply.
- What's the recent tenant-quality profile in this submarket — average credit score on applications, eviction rate, late-payment / NSF rate, and stable-employment percentage? A property-management company in the area should have these aggregated.
- How much new for-sale + rental construction is in the pipeline within 1–3 miles? Heavy new supply typically softens prices + rents 12–24 months out; constrained supply supports both.
Investment metrics
- 1% rule
- 1.16% ✓
- Cap rate
- 9.69%
- Cash-on-cash
- 12.15%
- DSCR
- 1.54
- GRM
- 7.2
CMA / ARV
- ARV (median comp)
- $84,793
- List price
- $95,000
- Delta
- 12.04%
- Verdict
- OVERPRICED
- Comps
- 20 within 1.0 mi
Show comp detail 9 sales within ~0.75 mi
| Address | Dist | Beds/Ba | Sqft | Sold | Price | $/sf | Match |
|---|---|---|---|---|---|---|---|
| 1113 N River Ave | 0.06mi | 4/1.5 (+1) | 1,152 (+2%) | 5mo | $60,000 | $52 | 84 |
| 1211 N Second Ave | 0.07mi | 4/1.5 (+1) | 1,170 (+4%) | 13mo | $45,000 | $38 | 75 |
| 628 N 7th Ave | 0.45mi | 3/1.0 | 1,103 (-2%) | 1mo | $34,000 | $31 | 73 |
| 1309 N 1st Ave | 0.12mi | 4/1.0 (+1) | 1,075 (-5%) | 13mo | $125,000 | $116 | 69 |
| 1120 N 1st Ave | 0.03mi | 4/1.0 (+1) | 1,092 (-3%) | 22mo | $69,500 | $64 | 68 |
| 1406 N 2nd Ave | 0.18mi | 4/1.0 (+1) | 1,037 (-8%) | 10mo | $159,750 | $154 | 63 |
| 828 N 5th Ave | 0.27mi | 4/2.0 (+1) | 1,192 (+6%) | 22mo | $65,900 | $55 | 53 |
| 729 W Maple St | 0.67mi | 3/2.0 | 1,248 (+11%) | 2mo | $163,500 | $131 | 47 |
| 216 N 9th Ave | 0.74mi | 3/1.0 | 1,228 (+9%) | 18mo | $89,900 | $73 | 34 |
Match score weights: distance 35% · size 25% · config 20% · recency 20%. Top-matched comps best support the ARV.
Projected returns pro-forma
-3.0% appreciation · 3.0% rent growth · sell at horizon
- IRR
- 1.7%
- Equity multiple
- 1.07×
- Total profit
- $1,737
- Equity at exit
- $14,165
- IRR
- 11.3%
- Equity multiple
- 1.88×
- Total profit
- $23,517
- Equity at exit
- $8,214
Cash invested: $26,600 (down + closing). Projections, not guarantees.
Landlord ↔ Tenant lean methodology
- Overall (STATE)
- 62 Landlord-Friendly
- State Michigan
- 62 Landlord-Friendly · EVEN
- County
- — inherits STATE
- City
- — inherits STATE
ZIP-level market 49935
- Home prices YoY
- -28.7%
- Active inventory
- 131
- Price-to-rent
- 7.2×
Monthly cashflow live
- Estimated rent
- $1,098 medium interval (Pro) →
- Mortgage (P&I)
- −$498
- Tax from tax record
- −$60 /mo · $721/yr
- Insurance
- −$40
- HOA
- −$0
- Vacancy / Maint / Mgmt
- −$230
- Net cashflow
- $269
Break-even live
UW: 25.0% down · 7.5% · 30yr · 1.5% tax · 5.0% vac · 8.0% maint · 8.0% mgmt
Financing live
Cash to close
- Down payment
- $23,750
- Closing costs
- $2,850
- Reserves months
- —
- Total cash needed
- —
Loan-product check · same deal, 3 products live
Conventional
25% down · 7.5% · 30yr
- Down + closing
- —
- Monthly P&I
- —
- Monthly cashflow
- —
- DSCR
- —
- Eligible?
- —
Personal DTI + credit; lowest rate.
DSCR
20% down · 8.5% · 30yr
- Down + closing
- —
- Monthly P&I
- —
- Monthly cashflow
- —
- DSCR
- —
- Eligible?
- —
No personal income docs; deal must DSCR.
Hard money
10% down · 12.0% · 12mo
- Down + closing
- —
- Monthly P&I
- —
- Monthly cashflow
- —
- DSCR
- —
- Eligible?
- —
Short-term bridge; refi at stabilization.
Listing history 20 events
-
2026-06-18days on market $95,000 Active 36 DOM
-
2026-06-17days on market $95,000 Active 35 DOM
-
2026-06-16days on market $95,000 Active 34 DOM
-
2026-06-15days on market $95,000 Active 33 DOM
-
2026-06-13days on market $95,000 Active 31 DOM
-
2026-06-12days on market $95,000 Active 30 DOM
-
2026-06-09days on market $95,000 Active 27 DOM
-
2026-06-08days on market $95,000 Active 26 DOM
-
2026-06-07days on market $95,000 Active 25 DOM
-
2026-06-07days on market $95,000 Active 24 DOM
-
2026-06-04days on market $95,000 Active 21 DOM
-
2026-06-02days on market $95,000 Active 20 DOM
-
2026-06-01days on market $95,000 Active 19 DOM
-
2026-05-31days on market $95,000 Active 18 DOM
-
2026-05-31days on market $95,000 Active 17 DOM
-
2026-05-13$95,000 Active 506-char remark
Show marketing remark (506 chars)
This 3 bedroom, 1.5 bath home is perfectly positioned just minutes from downtown on a sprawling double lot complete with an insulated 2-car detached garage. The main floor invites you in with a sun-drenched porch that flows seamlessly into spacious living and dining rooms, a bright kitchen, handy half-bath, and versatile back entry pantry. Upstairs, three cozy bedrooms provide a peaceful retreat alongside a full bathroom, while the expansive basement offers endless storage and dedicated laundry space.
-
2017-05-12historical
-
2017-03-16$58,000
ⓘ Source: listings_history table (triggers on properties + properties_extension) + one-shot
backfill from property_details.listing_events for pre-trigger history.
Tax reassessment forecast MI · Partial reset (capped growth)
- Current annual tax
- $721 · $60/mo
- Projected year-2 tax
- $1,092 · $91/mo
- Expected delta
- +$371/yr (+$31/mo · 51.5%)
ⓘ Screening estimate from a state-policy table — verify with the county assessor before closing.
Nearby sold comps map
Loading sold comps map…
Walkable amenities ~0.75 mi
Loading nearby amenities…
Taxation est. · year 1
- Rental income
- $13,171
- − Mortgage interest
- −$5,321
- − Property taxes
- −$721
- − Insurance
- −$475
- − Repairs & maintenance
- −$1,054
- − Management
- −$1,054
- − Depreciation
- −$2,764
- Taxable income
- $1,783
- Est. tax owed @ 24.0%
- −$428
- After-tax cash flow
- $2,803/yr
For passive investors: Depreciation is non-cash, so a rental often shows a tax loss while cash-flowing — sheltering income. Rental losses are passive: they offset passive income freely, and up to $25,000/yr can offset ordinary (W-2) income if you actively participate and your MAGI is under $100k (phasing out to $0 by $150k); unused losses carry forward. On sale, claimed depreciation is recaptured at up to 25%, and gains may owe capital-gains tax (a 1031 exchange can defer both). Figures are a year-1 estimate at your 24.0% rate — not tax advice; consult a CPA.
Schools (NCES district)
- District
- West Iron County Public Schools
- NCES district ID
- 2632910
- Math proficiency
- 38% ▲ 2.00%
- Reading proficiency
- 46% ▲ 1.00%
- Median HH income
- $33,390
- Composite
- 34.54/100
- National rank
- #5175
- State rank
- #204 of 540 in MI
Livability — Iron River
- Score
- 73/100
- State rank
- #206
- US rank
- #5207
Category grades
Schools grade is shown separately in the Schools card above.
Census & demographics
- Census place
- Iron River, MI
- Population (ZIP)
- 5,969
Population outlook (Iron County) Hauer SSP2
- Today (2025)
- 10,485 people
- By 2030
- 9,914 · -5.4%
- By 2040
- 8,698 · -17.0%
- By 2050
- 7,742 · -26.2%
- By 2075
- 6,485 · -38.1%
- By 2100
- 5,396 · -48.5%
Race, ethnicity, and origin ACS 2023
- Neighborhood character
- Predominantly White (94%)
- Race & ethnicity
- White 94% Hispanic / Latino 2% Two or more races 2% Native American 1%
- Common ancestry
- Romanian 10% Lithuanian 6% Portuguese 5%
- Foreign-born
- 1% · Canada, Jamaica, China
- Languages at home
- 98% English-only · Spanish 1%
Political lean MEDSL · Iron
- 2024 margin
- Strong R (+29.3) · D 34.7% · R 64.0% · Other 1.2%
- 2008→2024 swing
- -31.5pp toward R · 2008: 2.1pp · 2024: -29.3pp
- All cycles
- 2024: R+29.3 2020: R+25.4 2016: R+28.3 2012: R+9.0 2008: D+2.1
Not yet ingested
- Civics
- —
Market trends
- HPI YoY
- ▼ -90.38%
- Current HPI
- 224.8101
- Rent YoY
- —
- Metro
- —
- State GDP YoY
- ▲ 1.37%
- F500 in state
- 28
Industry mix (Fortune 500 HQ in MI)
| Industry | F500 HQs | Revenue |
|---|---|---|
| Automotive Parts | 3 | $48B |
|
||
| Automotive | 2 | $372B |
|
||
| Chemicals | 1 | $45B |
|
||
| Automotive Retail | 1 | $29B |
|
||
| Healthcare / Medical Devices | 1 | $23B |
|
||
| Automotive Technology | 1 | $20B |
|
||
Price history
+63.8% since first listed5 events — show timeline
- 2026-05-13 Listed $95,000 GNMLS
- 2026-05-13 Listed $95,000 UPAR
- 2026-05-13 Listed $95,000 MiRealSource-MiMLS
- 2017-05-12 Listing Removed — MiRealSource-MiMLS
- 2017-03-16 Listed $58,000 MiRealSource-MiMLS
Property tax history
-1.8%/yrLatest (2025): $721 · -17.7% YoY. Source: county tax records.
Cash-flow waterfall
monthlySold comps — $/sqft
last 12 mo · ≤1 miLoading sold comps…