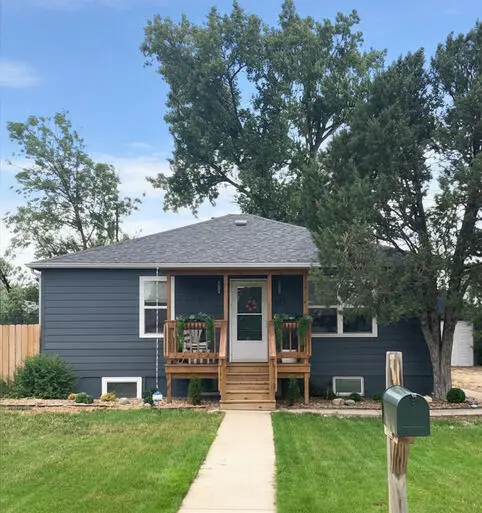
310 Hill St · Wolf Point, MT
Flood risk 1/10 · Minimal
- FEMA flood zone
- X (unshaded)
- Chance of flooding over 30 yrs
- 0.0%
- Est. flood insurance / yr
- $473 – $860
Fire risk 9/10 · Severe
- Est. fire insurance / yr
- $918 – $1,706
Heat risk 3/10 · Minor
- Hot days now (above 99°F)
- 7 days/yr
- Hot days in 30 yrs
- 13 days/yr
Wind risk 1/10 · Minimal
- Chance of severe wind over 30 yrs
- —
Air-quality risk 3/10 · Minor
- Unhealthy air days now
- 3 days/yr
- Unhealthy air days in 30 yrs
- 3 days/yr
Risk factors via First Street. Map © Google.
Why this score? — see what drove the D grade
The composite is a weighted blend of 9 inputs, each scored 0–100. Each bar is that input's sub-score; the figure is the points it added to the 100-point composite (weight × sub-score).
- Cash flow +9.8/30.0
- Appreciation +7.9/10.0
- ARV discount +7.5/15.0
- Livability +3.7/5.0
- DSCR +2.8/10.0
- Rent growth +2.5/5.0
- Condition / age +2.5/5.0
- 1% rule +2.2/10.0
- Schools +1.6/10.0
$185,000
🖨 Deal sheet (PDF) 📄 Offer letter ✓ Due diligence
Key facts
- Ring cameras
- Updated lighting
- Fenced backyard
Tags
Property features AI
Finance
- Financial info: Annual tax amount: $1,418
Exterior
- Parking: Detached or attached 1-car garage
- Home design: Single-family residence
- Construction: Residential construction
- Exterior features: Lot approximately 8,400 sq ft
Interior
- Bathrooms: Two full bathrooms
- Interior features: Full basement
Neighborhood map
What this means for you Summary
Snapshot
- This is a 4-bed/2.0-bath single-family listed at $185k.
Deal economics
- At list price, monthly cash flow is $-117 ($-1k/yr) — negative.
- To cash-flow at today's rent, offer at most $164k (11.2% below list).
- To meet the 1% rule (rent ≥ 1% of price), the offer needs to be $133k (28.3% below list).
- Recommended offer: $133k (28.3% below list) — sets the bar for 1% rule.
Location & tenants
- Location reads 74/100 on livability (#34 in MT, #4,379 nationally) — a middle-class / working-renter tenant base. Strengths: cost of living A+, housing A+, health & safety A+; Watch: schools F, amenities D-, employment F.
- Wolf Point H S (town): math 11% / reading 20% proficiency, ranked #271 of 339 in MT (top 80%) — low school quality limits family demand, transient renter base, plan for 1-2y turnover.
- Market conditions: 26 active listings in the ZIP.
Forward outlook
- In year one you build about $12k of equity ($1k loan paydown + $11k appreciation (5.9% local appreciation)).
- Roosevelt County population projected at +41% by 2050 — long-run rental-demand tailwind backs the buy-and-hold thesis.
- By year 3, paydown + projected appreciation supports a ~$30k cash-out refi (75% LTV) — recoverable capital for the next deal without selling this one.
Negotiation context
- Only 6 days on market — expect competitive offers; lowballing is unlikely to land.
Risks & watch-outs
- Watch-outs: built in 1951 — expect roof / HVAC / electrical / plumbing capex.
- Climate carrying-cost: severe wildfire risk — expect insurance premiums to compound above CPI over the hold.
Questions for the listing agent
- What do current leases actually rent for vs. the listed asking? Can we see a recent rent roll and the last 12 months of T-12 income?
- Built in 1951 — when were the roof, HVAC, electrical panel, plumbing, and water heater last replaced?
- Is there a deadline driving the sale (1031 exchange, divorce, estate, relocation)? That informs how much negotiation room exists.
- Schools are F-rated, which usually means shorter tenancies and higher turnover. Who's the typical renter profile here, and what's been the actual vacancy rate?
- The area grade is low — what's the realistic commute time and amenity access for the typical tenant pool here? Any planned neighborhood developments (good or bad) we should know about?
- What's the average days-on-market for RENTAL listings here right now (not sales)? A rising rental-DOM trend means longer vacancies and softer asking-rent achievability than the comps imply.
- What's the recent tenant-quality profile in this submarket — average credit score on applications, eviction rate, late-payment / NSF rate, and stable-employment percentage? A property-management company in the area should have these aggregated.
- How much new for-sale + rental construction is in the pipeline within 1–3 miles? Heavy new supply typically softens prices + rents 12–24 months out; constrained supply supports both.
Investment metrics
- 1% rule
- 0.72% ✗
- Cap rate
- 5.53%
- Cash-on-cash
- -2.71%
- DSCR
- 0.88
- GRM
- 11.6
CMA / ARV
No comps found within radius.
Projected returns pro-forma
5.89% appreciation · 3.0% rent growth · sell at horizon
- IRR
- 12.9%
- Equity multiple
- 1.86×
- Total profit
- $44,715
- Equity at exit
- $115,017
- IRR
- 13.5%
- Equity multiple
- 3.66×
- Total profit
- $137,579
- Equity at exit
- $207,481
Cash invested: $51,800 (down + closing). Projections, not guarantees.
Landlord ↔ Tenant lean methodology
- Overall (STATE)
- 82 Strongly Landlord-Friendly
- State Montana
- 82 Strongly Landlord-Friendly · R+11
- County
- — inherits STATE
- City
- — inherits STATE
ZIP-level market 59201
- Home prices YoY
- 3.2%
- Active inventory
- 26
- Price-to-rent
- 11.6×
Monthly cashflow live
- Estimated rent
- $1,327 medium interval (Pro) →
- Mortgage (P&I)
- −$970
- Tax from tax record
- −$118 /mo · $1,418/yr
- Insurance
- −$77
- HOA
- −$0
- Vacancy / Maint / Mgmt
- −$279
- Net cashflow
- $-117
Break-even live
Sensitivity live
| Price | -10% $-12 | -5% $-65 | +0% $-117 | +5% $-169 | +10% $-222 |
|---|---|---|---|---|---|
| Rent | -10% $-222 | -5% $-169 | +0% $-117 | +5% $-64 | +10% $-12 |
| Rate | -1.0pp $-24 | -0.5pp $-70 | base $-117 | +0.5pp $-165 | +1.0pp $-214 |
UW: 25.0% down · 7.5% · 30yr · 1.5% tax · 5.0% vac · 8.0% maint · 8.0% mgmt
Financing live
Cash to close
- Down payment
- $46,250
- Closing costs
- $5,550
- Reserves months
- —
- Total cash needed
- —
Loan-product check · same deal, 3 products live
Conventional
25% down · 7.5% · 30yr
- Down + closing
- —
- Monthly P&I
- —
- Monthly cashflow
- —
- DSCR
- —
- Eligible?
- —
Personal DTI + credit; lowest rate.
DSCR
20% down · 8.5% · 30yr
- Down + closing
- —
- Monthly P&I
- —
- Monthly cashflow
- —
- DSCR
- —
- Eligible?
- —
No personal income docs; deal must DSCR.
Hard money
10% down · 12.0% · 12mo
- Down + closing
- —
- Monthly P&I
- —
- Monthly cashflow
- —
- DSCR
- —
- Eligible?
- —
Short-term bridge; refi at stabilization.
Listing history 1 events
-
2026-06-07$185,000 Pending 6 DOM
ⓘ Source: listings_history table (triggers on properties + properties_extension) + one-shot
backfill from property_details.listing_events for pre-trigger history.
Tax reassessment forecast MT · Resets to sale price
- Current annual tax
- $1,418 · $118/mo
- Projected year-2 tax
- $1,554 · $130/mo
- Expected delta
- +$136/yr (+$11/mo · 9.6%)
ⓘ Screening estimate from a state-policy table — verify with the county assessor before closing.
Climate risk First Street
- Flood 1/10 Low FEMA zone X (unshaded) · 0% chance over 30 yrs
- Wildfire 9/10 Extreme
- Heat 3/10 Moderate 7 d/yr ≥99°F today · 13 d/yr by 30 yrs out
- Wind 1/10 Low
- Air quality 3/10 Moderate 3 unhealthy d/yr today · 3 by 30 yrs out
Nearby sold comps map
Loading sold comps map…
Walkable amenities ~0.75 mi
Loading nearby amenities…
Taxation est. · year 1
- Rental income
- $15,926
- − Mortgage interest
- −$10,363
- − Property taxes
- −$1,418
- − Insurance
- −$925
- − Repairs & maintenance
- −$1,274
- − Management
- −$1,274
- − Depreciation
- −$5,382
- Taxable loss
- −$4,709
- Est. tax savings @ 24.0%
- +$1,130
- After-tax cash flow
- $-273/yr
For passive investors: Depreciation is non-cash, so a rental often shows a tax loss while cash-flowing — sheltering income. Rental losses are passive: they offset passive income freely, and up to $25,000/yr can offset ordinary (W-2) income if you actively participate and your MAGI is under $100k (phasing out to $0 by $150k); unused losses carry forward. On sale, claimed depreciation is recaptured at up to 25%, and gains may owe capital-gains tax (a 1031 exchange can defer both). Figures are a year-1 estimate at your 24.0% rate — not tax advice; consult a CPA.
Schools (NCES district)
- District
- Wolf Point H S
- NCES district ID
- 3028620
- Math proficiency
- 11% ▲ 11.00%
- Reading proficiency
- 20% ▬ 0.00%
- Median HH income
- $36,527
- Composite
- 16.31/100
- National rank
- #14269
- State rank
- #271 of 339 in MT
Livability — Wolf Point
- Score
- 74/100
- State rank
- #34
- US rank
- #4379
Category grades
Schools grade is shown separately in the Schools card above.
Census & demographics
- Census place
- Wolf Point, MT
- Population (ZIP)
- 5,345
Population outlook (Roosevelt County) Hauer SSP2
- Today (2025)
- 13,449 people
- By 2030
- 14,496 · +7.8%
- By 2040
- 16,710 · +24.2%
- By 2050
- 18,950 · +40.9%
- By 2075
- 24,541 · +82.5%
- By 2100
- 27,573 · +105.0%
Race, ethnicity, and origin ACS 2023
- Neighborhood character
- Highly diverse neighborhood (Simpson 0.90)
- Race & ethnicity
- Native American 56% White 32% Two or more races 11% Hispanic / Latino 4% Asian 2%
- Common ancestry
- Portuguese 5% Italian 3% Scottish 2%
- Foreign-born
- 2% · Vietnam, Canada, China
- Languages at home
- 97% English-only · German/W. Germanic 1%
Political lean MEDSL · Roosevelt
- 2024 margin
- Lean R (+9.6) · D 42.9% · R 52.5% · Other 4.6%
- 2008→2024 swing
- -35.9pp toward R · 2008: 26.3pp · 2024: -9.6pp
- All cycles
- 2024: R+9.6 2020: R+2.1 2016: R+6.3 2012: D+15.0 2008: D+26.3
Not yet ingested
- Civics
- —
Market trends
- HPI YoY
- ▲ 5.89%
- Current HPI
- 188.8516
- Rent YoY
- —
- Metro
- —
- State GDP YoY
- ▲ 3.41%
- F500 in state
- 2
Industry mix (Fortune 500 HQ in MT)
| Industry | F500 HQs | Revenue |
|---|---|---|
| Technology / Analytics | 1 | $2B |
|
||
Price history
3 events — show timeline
- 2026-06-05 Pending — HHLMLS
- 2026-05-17 Listed $185,000 HHLMLS
- 2004-11-01 Sold (Public Records) — Public Records
Property tax history
-0.7%/yrLatest (2025): $1,418 · -30.1% YoY. Source: county tax records.
Cash-flow waterfall
monthlySold comps — $/sqft
last 12 mo · ≤1 miLoading sold comps…