435 E Gardena Blvd #10 · Carson, CA
Flood risk 1/10 · Minimal
- FEMA flood zone
- X (unshaded)
- Chance of flooding over 30 yrs
- 0.0%
- Est. flood insurance / yr
- $507 – $1,088
Fire risk 1/10 · Minimal
- Est. fire insurance / yr
- $659 – $1,223
Heat risk 4/10 · Minor
- Hot days now (above 87°F)
- 6 days/yr
- Hot days in 30 yrs
- 19 days/yr
Wind risk 1/10 · Minimal
- Chance of severe wind over 30 yrs
- —
Air-quality risk 5/10 · Moderate
- Unhealthy air days now
- 7 days/yr
- Unhealthy air days in 30 yrs
- 7 days/yr
Risk factors via First Street. Map © Google.
Why this score? — see what drove the C- grade
The composite is a weighted blend of 9 inputs, each scored 0–100. Each bar is that input's sub-score; the figure is the points it added to the 100-point composite (weight × sub-score).
- Cash flow +20.4/30.0
- ARV discount +7.5/15.0
- DSCR +6.5/10.0
- 1% rule +5.4/10.0
- Schools +3.6/10.0
- Livability +3.4/5.0
- Rent growth +2.5/5.0
- Condition / age +2.5/5.0
- Appreciation +0.0/10.0
$295,000
🖨 Deal sheet 📄 Offer letter ✓ Due diligence
Listing remarks
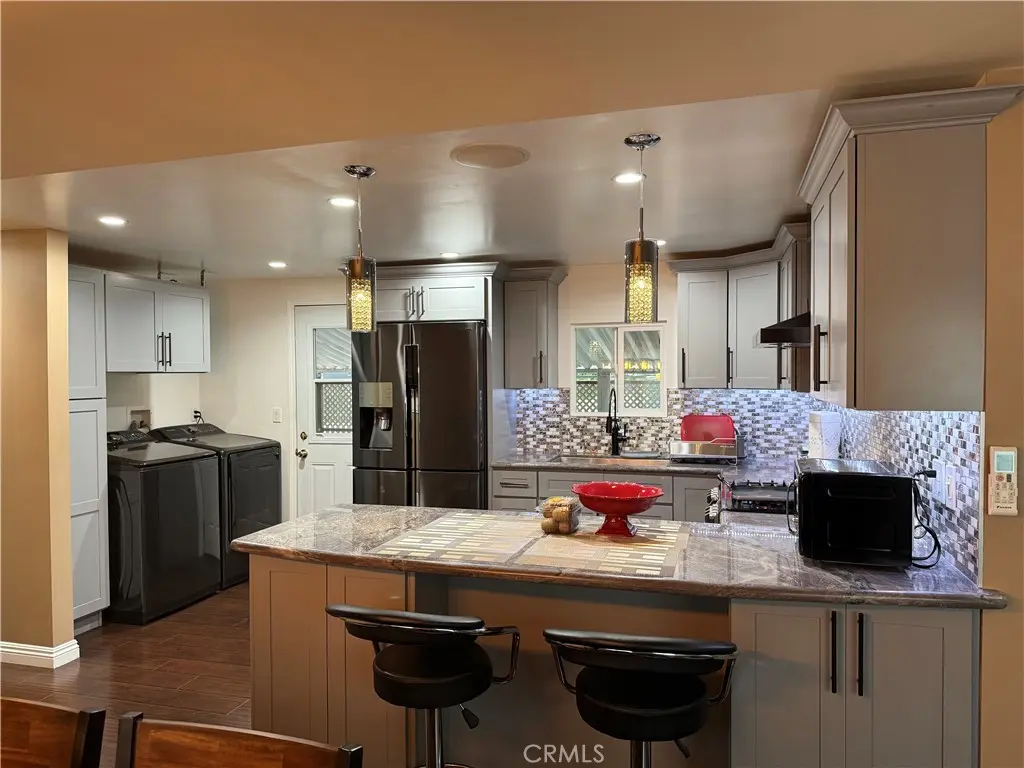
READY TO MOVE IN HOUSE !! WELCOME TO RANCHO DOMINGUEZ MOBILE ESTATES. THE PLACE THAT YOU CAN LIVE WITH A VERY LOW SPACE RENT AT THE RENT CONTROL PARK. THIS PROPERTY BELONGS TO THE CITY OF CARSON -EVEN THOUGH THE ZIP CODE INDICATES GARDENA- WHICH IS WHY IT IS SUBJECT TO RENT CONTROL… IN THIS GREAT LOCATION CLOSE TO FREEWAYS 110,405,91, CAL STATE DOMINGUEZ HILLS , DIGNITY HEALTH SPORTS PARK ( HOUSE OF THE LA GALAX ) AND MANY MORE RESTAURANTS AND SHOPPING CENTERS. THIS HOUSE OFFERS 2 BEDROOMS AND 2 BATHROOMS BOTH COMPLETELY REMODELED AS WELL AS THE KITCHEN WITH GRANITE COUNTERTOPS!! MAKE THIS HOUSE YOUR NEW HOME!!
Key facts
- Remodeled kitchen
- Granite countertops
- 2 garage spots
Tags
Property features AI
Finance
- Other: Land lease amount: monthly; Location: On Gardena Blvd between Main St and Avalon Blvd
- Financial info: Land lease (monthly)
- HOA & community: Part of association; Park name: Rancho Dominguez MHP, LLC; Manager approval required; Pets allowed with breed restrictions
Exterior
- Parking: Carport; 2 parking spaces (includes 2 garage/carport spaces)
- Security: Accessible via 2+ exits; Parking accessibility
- Utilities: District/public water; Public sewer; Water available and connected; Sewer available and connected; Electricity available and connected; Natural gas available and connected
- Home design: Single-story; Entry at main level; Mobile home remains on lot; Mobile dimensions approximately 10' x 52'; Double body type (multi-section)
- Construction: Shingle roof; Year built source: other
- Exterior features: Community pool; 2 sheds; Corner lot; Near public transit; Close to clubhouse; Street lighting
Interior
- Kitchen: Remodeled kitchen; Granite countertops; Gas range; Refrigerator; Water softener; Gas water heater
- Bedrooms: All bedrooms on main level; Walk-in closet(s)
- Flooring: Laminate flooring
- Bathrooms: 2 full bathrooms; Remodeled bathrooms; Shower(s)
- Heating & cooling: Electric heating; Electric cooling
- Interior features: Pantry; Recessed lighting; Storage space; Double pane windows; Granite counters; Remodeled interior elements; Exhaust fan(s)
- Laundry & utility: Inside laundry; Washer hookup; Gas dryer hookup
Neighborhood map
What this means for you Summary
Snapshot
- This is a 2-bed/2.0-bath manufactured listed at $295k.
Deal economics
- At list price, monthly cash flow is $381 ($5k/yr) — positive.
- The deal already cash-flows at list — no discount required.
- Meets the 1% rule at list price ($3k rent vs $295k).
- Recommended offer: $286k (3.0% below list) — sets the bar for market timing.
- Cap rate 7.8% vs local median 3.2% in Carson — top-decile yield for the area; either an underpriced asset or a hidden risk that comps aren't pricing in. Stress-test before assuming the spread holds.
Location & tenants
- Location reads 67/100 on livability (#309 in CA) — a middle-class / working-renter tenant base. Strengths: commute A+, employment A+, housing A-; Watch: health & safety C-, schools D+, crime F.
- Los Angeles Unified (urban): math 29% / reading 54% proficiency, ranked #223 of 517 in CA (top 43%) — families likely to look elsewhere, expect single-tenant / working-renter base with shorter leases; 67% free/reduced lunch — lower-income household profile, screen leases tightly.
- Market conditions: 25 active listings in the ZIP; 13 comparable units currently listed for rent nearby; rentals at typical pace (median 25d on market — plan ~3-4 weeks tenant-placement turnaround); 19,697 units permitted in Los Angeles County in 2024 (9,426 in 5+ unit buildings).
Forward outlook
- Local home prices are declining (-3.0%/yr); year-one equity from $2k of loan paydown is wiped out by about $9k of value loss. Plan a longer hold.
- Los Angeles County population projected at +9% by 2050 — modest demand growth; plan on rents tracking national, not racing it.
Negotiation context
- It's been on market 31 days — a 3% lower offer ($286k) is reasonable based on typical stale-listing flexibility.
- 9 sale attempts since 18y ago; this cycle's ask has dropped $34k (10%) from the opening price — seller is motivated, your offer sets the floor, not the list.
Questions for the listing agent
- It's been on market 31 days. Have you received any prior offers? Is the seller open to a 3% concession, seller financing, or rate buy-down credit?
- Built in 1978 — when were the roof, HVAC, electrical panel, plumbing, and water heater last replaced?
- Is there a deadline driving the sale (1031 exchange, divorce, estate, relocation)? That informs how much negotiation room exists.
- Schools are D-rated, which usually means shorter tenancies and higher turnover. Who's the typical renter profile here, and what's been the actual vacancy rate?
- Crime grade is F in this area — have there been break-ins, vandalism, or insurance claims at this property in the last 3 years? What carrier currently insures it and at what premium?
- What's the average days-on-market for RENTAL listings here right now (not sales)? A rising rental-DOM trend means longer vacancies and softer asking-rent achievability than the comps imply.
- What's the recent tenant-quality profile in this submarket — average credit score on applications, eviction rate, late-payment / NSF rate, and stable-employment percentage? A property-management company in the area should have these aggregated.
- How much new for-sale + rental construction is in the pipeline within 1–3 miles? Heavy new supply typically softens prices + rents 12–24 months out; constrained supply supports both.
Investment metrics
- 1% rule
- 1.04% ✓
- Cap rate
- 7.84%
- Cash-on-cash
- 5.54%
- DSCR
- 1.25
- GRM
- 8.0
CMA / ARV
No comps found within radius.
Projected returns pro-forma
-3.0% appreciation · 3.0% rent growth · sell at horizon
- IRR
- -7.7%
- Equity multiple
- 0.72×
- Total profit
- $-23,475
- Equity at exit
- $43,985
- IRR
- 1.9%
- Equity multiple
- 1.13×
- Total profit
- $11,012
- Equity at exit
- $25,506
Cash invested: $82,600 (down + closing). Projections, not guarantees.
Landlord ↔ Tenant lean methodology
- Overall (STATE)
- 18 Strongly Tenant-Friendly
- State California
- 18 Strongly Tenant-Friendly · D+13
- County
- — inherits STATE
- City
- — inherits STATE
ZIP-level market 90248
- Active inventory
- 25
- Price-to-rent
- 8.0×
Monthly cashflow live
- Estimated rent
- $3,063 high interval (Pro) →
- Mortgage (P&I)
- −$1,547
- Tax est. 1.5%
- −$369 /mo · $4,425/yr
- Insurance
- −$123
- HOA
- −$0
- Vacancy / Maint / Mgmt
- −$643
- Net cashflow
- $381
Break-even live
UW: 25.0% down · 7.5% · 30yr · 1.5% tax · 5.0% vac · 8.0% maint · 8.0% mgmt
Financing live
Cash to close
- Down payment
- $73,750
- Closing costs
- $8,850
- Reserves months
- —
- Total cash needed
- —
Loan-product check · same deal, 3 products live
Conventional
25% down · 7.5% · 30yr
- Down + closing
- —
- Monthly P&I
- —
- Monthly cashflow
- —
- DSCR
- —
- Eligible?
- —
Personal DTI + credit; lowest rate.
DSCR
20% down · 8.5% · 30yr
- Down + closing
- —
- Monthly P&I
- —
- Monthly cashflow
- —
- DSCR
- —
- Eligible?
- —
No personal income docs; deal must DSCR.
Hard money
10% down · 12.0% · 12mo
- Down + closing
- —
- Monthly P&I
- —
- Monthly cashflow
- —
- DSCR
- —
- Eligible?
- —
Short-term bridge; refi at stabilization.
Rent comps 13 comps
| Address | Beds | Baths | Sqft | Rent | $/sqft | DOM | Units | Dist |
|---|---|---|---|---|---|---|---|---|
| 435 E Gardena Blvd Spc 9 Gardena, CA | 3.0 | 1.5 | 912 | $3,000 | $3.29 | 5d | 1 | 0.05mi |
| 16306 Haskins Ln Carson, CA | 3.0 | 2.0 | 918 | $3,500 | $3.81 | 17d | 1 | 0.44mi |
| 515 W Gardena Blvd #18 Gardena, CA | 3.0 | 2.0 | 1235 | $4,500 | $3.64 | 43d | 1 | 0.88mi |
| 16523 S Denver Ave Gardena, CA | 2.0 | 1.5 | 1200 | $2,450 | $2.04 | 43d | 1 | 0.92mi |
| 1107 S Central Ave Unit C Compton, CA | 2.0 | 1.0 | 750 | $1,975 | $2.63 | 19d | 1 | 1.08mi |
| 2315 W Compton Blvd Apt B Compton, CA | 2.0 | 1.0 | 800 | $1,750 | $2.19 | 43d | 1 | 1.21mi |
| 860 W 165th Pl Apt 201 Gardena, CA | 2.0 | 2.0 | 925 | $2,395 | $2.59 | 43d | 1 | 1.33mi |
| 16920 S Vermont Ave Gardena, CA | 2.0 | 1.5 | 1100 | $2,795 | $2.54 | 24d | 1 | 1.35mi |
| 16920 S Vermont Ave Unit D Gardena, CA | 2.0 | 1.5 | 1100 | $2,795 | $2.54 | 19d | 1 | 1.35mi |
| 16935 S Vermont Ave Gardena, CA | 2.0 | 1.0 | 850 | $2,295 | $2.70 | 24d | 1 | 1.39mi |
| 1040 W 165th Pl Unit 1 Gardena, CA | 3.0 | 3.0 | 1500 | $4,500 | $3.00 | 5d | 1 | 1.42mi |
| 1029 W 160th St Gardena, CA | 3.0 | 2.0 | 1248 | $4,150 | $3.33 | 43d | 1 | 1.46mi |
| 14707 S Denver Ave Gardena, CA | 3.0 | 2.0 | 1072 | $3,700 | $3.45 | 20d | 1 | 1.49mi |
Listing history 28 events
-
2026-06-18days on market $295,000 Active 31 DOM
-
2026-06-17days on market $295,000 Active 30 DOM
-
2026-06-16days on market $295,000 Active 29 DOM
-
2026-06-15days on market $295,000 Active 28 DOM
-
2026-06-13days on market $295,000 Active 26 DOM
-
2026-06-09days on market $295,000 Active 22 DOM
-
2026-06-08days on market $295,000 Active 21 DOM
-
2026-06-07days on market $295,000 Active 20 DOM
-
2026-06-04days on market $295,000 Active 17 DOM
-
2026-06-03days on market $295,000 Active 16 DOM
-
2026-06-02days on market $295,000 Active 15 DOM
-
2026-06-01days on market $295,000 Active 14 DOM
-
2026-05-31pricedays on market $295,000 Active 13 DOM
-
2026-05-23status Active
-
2026-05-21status Active
-
2026-05-16$329,000 Active
-
2026-03-30status Active
-
2026-03-22status Active
-
2026-03-19historical Active Under Contract
-
2026-03-04$285,000 Active
-
2026-01-16historical
-
2025-10-23status Active
-
2025-10-23price $315,000
-
2025-09-02historical
-
2025-08-11$349,000 Active
-
2009-05-07historical
-
2009-03-05price $47,000
-
2008-12-08$67,000
ⓘ Source: listings_history table (triggers on properties + properties_extension) + one-shot
backfill from property_details.listing_events for pre-trigger history.
Climate risk First Street
- Flood 1/10 Low FEMA zone X (unshaded) · 0% chance over 30 yrs
- Wildfire 1/10 Low
- Heat 4/10 Moderate 6 d/yr ≥87°F today · 19 d/yr by 30 yrs out
- Wind 1/10 Low
- Air quality 5/10 Major 7 unhealthy d/yr today · 7 by 30 yrs out
Nearby sold comps map
Loading sold comps map…
Walkable amenities ~0.75 mi
Loading nearby amenities…
Taxation est. · year 1
- Rental income
- $36,758
- − Mortgage interest
- −$16,525
- − Property taxes
- −$4,425
- − Insurance
- −$1,475
- − Repairs & maintenance
- −$2,941
- − Management
- −$2,941
- − Depreciation
- −$8,582
- Taxable loss
- −$129
- Est. tax savings @ 24.0%
- +$31
- After-tax cash flow
- $4,606/yr
For passive investors: Depreciation is non-cash, so a rental often shows a tax loss while cash-flowing — sheltering income. Rental losses are passive: they offset passive income freely, and up to $25,000/yr can offset ordinary (W-2) income if you actively participate and your MAGI is under $100k (phasing out to $0 by $150k); unused losses carry forward. On sale, claimed depreciation is recaptured at up to 25%, and gains may owe capital-gains tax (a 1031 exchange can defer both). Figures are a year-1 estimate at your 24.0% rate — not tax advice; consult a CPA.
Schools (NCES district)
- District
- Los Angeles Unified
- NCES district ID
- 0622710
- Math proficiency
- 29% ▼ -4.00%
- Reading proficiency
- 54% ▲ 10.00%
- Median HH income
- $50,403
- Composite
- 35.67/100
- National rank
- #4875
- State rank
- #223 of 517 in CA
Livability — Carson
- Score
- 67/100
- State rank
- #309
- US rank
- #10410
Category grades
Schools grade is shown separately in the Schools card above.
Census & demographics
- Census place
- Carson, CA
- City population
- 57,397
- Population (ZIP)
- 11,144
Population outlook (Los Angeles County) Hauer SSP2
- Today (2025)
- 10,940,515 people
- By 2030
- 11,256,481 · +2.9%
- By 2040
- 11,729,929 · +7.2%
- By 2050
- 11,948,407 · +9.2%
- By 2075
- 11,818,114 · +8.0%
- By 2100
- 10,842,928 · -0.9%
Race, ethnicity, and origin ACS 2023
- Neighborhood character
- Highly diverse neighborhood (Simpson 0.75)
- Race & ethnicity
- Asian 32% Hispanic / Latino 31% Black 21% Two or more races 12% White 7%
- Hispanic origin (detail)
- Mexican 20% Puerto Rican 2%
- Common ancestry
- British 1%
- Foreign-born
- 37% · Canada, South Korea, Vietnam
- Languages at home
- 53% English-only · Spanish 25% Other Asian/Pacific 10% Tagalog/Filipino 6%
Political lean MEDSL · Los Angeles
- 2024 margin
- Solid D (+32.9) · D 64.8% · R 31.9% · Other 3.3%
- 2008→2024 swing
- -7.4pp toward R · 2008: 40.4pp · 2024: 32.9pp
- All cycles
- 2024: D+32.9 2020: D+44.2 2016: D+48.0 2012: D+40.0 2008: D+40.4
Not yet ingested
- Civics
- —
Market trends
- HPI YoY
- ▼ -318.63%
- Current HPI
- 409.9768
- Rent YoY
- —
- Metro
- —
- State GDP YoY
- ▲ 3.21%
- F500 in state
- 116
Industry mix (Fortune 500 HQ in CA)
| Industry | F500 HQs | Revenue |
|---|---|---|
| Technology | 27 | $1,492B |
|
||
| Financial Services | 3 | $174B |
|
||
| Retail | 3 | $44B |
|
||
| Insurance | 3 | $26B |
|
||
| Media / Entertainment | 2 | $115B |
|
||
| Pharmaceuticals / Biotech | 2 | $62B |
|
||
Price history
+391.0% since first listed15 events — show timeline
- 2026-05-23 Relisted — CRMLS
- 2026-05-21 Relisted — CRMLS
- 2026-05-16 Listed $329,000 CRMLS
- 2026-03-30 Relisted — CRMLS
- 2026-03-22 Relisted — CRMLS
- 2026-03-19 Contingent — CRMLS
- 2026-03-04 Listed $285,000 CRMLS
- 2026-01-16 Listing Removed — CRMLS
- 2025-10-23 Relisted — CRMLS
- 2025-10-23 Price Changed $315,000 CRMLS
- 2025-09-02 Listing Removed — CRMLS
- 2025-08-11 Listed $349,000 CRMLS
- 2009-05-07 Listing Removed — CRMLS
- 2009-03-05 Price Changed $47,000 CRMLS
- 2008-12-08 Listed $67,000 CRMLS
Cash-flow waterfall
monthlySold comps — $/sqft
last 12 mo · ≤1 miLoading sold comps…