1900 Bay Area Blvd Unit N237 · Houston, TX
Flood risk 6/10 · Moderate
- FEMA flood zone
- X (unshaded)
- Chance of flooding over 30 yrs
- 0.72%
- Est. flood insurance / yr
- $507 – $1,088
Fire risk 2/10 · Minimal
- Est. fire insurance / yr
- $1,222 – $2,270
Heat risk 10/10 · Severe
- Hot days now (above 107°F)
- 7 days/yr
- Hot days in 30 yrs
- 25 days/yr
Wind risk 9/10 · Severe
- Chance of severe wind over 30 yrs
- 99.0%
Air-quality risk 2/10 · Minimal
- Unhealthy air days now
- 1 days/yr
- Unhealthy air days in 30 yrs
- 1 days/yr
Risk factors via First Street. Map © Google.
Why this score? — see what drove the D grade
The composite is a weighted blend of 9 inputs, each scored 0–100. Each bar is that input's sub-score; the figure is the points it added to the 100-point composite (weight × sub-score).
- Cash flow +7.6/30.0
- ARV discount +7.5/15.0
- 1% rule +7.2/10.0
- Schools +4.6/10.0
- Appreciation +4.4/10.0
- Livability +3.7/5.0
- Rent growth +3.0/5.0
- Condition / age +2.5/5.0
- DSCR +1.8/10.0
$98,000
🖨 Deal sheet (PDF) 📄 Offer letter ✓ Due diligence
Listing remarks
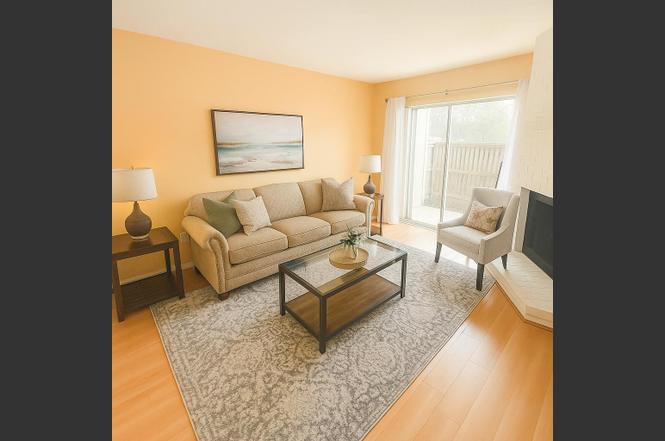
Rare opportunity to own in the Bay Area/NASA corridor for under $100K. This updated 1-bedroom, 1-bath condo offers low-maintenance living with strong rental potential, making it ideal for investors, first-time buyers, or anyone looking for an affordable entry into the Clear Lake market. Conveniently located near NASA, UH-Clear Lake, shopping, dining, and major commuter routes, the unit features an efficient layout, virtual staging to showcase furniture placement, and access to community amenities. The spacious living area and private bedroom layout provide comfortable everyday living, while the HOA covers exterior maintenance for simplified ownership. Whether used as a primary residence or
Key facts
- Prime location
- Great school system
- $386 HOA
Tags
Property features AI
Finance
- Other: Full ownership
- Financial info: Lease considered
- HOA & community: Association: University Trace Condominium Ass; Monthly association fee; Association amenities include clubhouse, fitness center, pool, trash; Association fee covers clubhouse, common areas, structure maintenance, recreation facilities, sewer, trash, water
Exterior
- Parking: Carport; Assigned parking; Additional parking
- Utilities: Public water; Public sewer
- Home design: Residential property; Faces north; 2 stories; Entry level on first floor
- Construction: Built in 1975; Slab foundation; Shingle and wood roof; Construction materials: Unknown
- Exterior features: Balcony; Deck; Patio; Storage
Interior
- Kitchen: Double oven; Electric cooktop; Dishwasher; Disposal; Refrigerator
- Bedrooms: Primary bedroom on the first floor; Additional bedroom on the first floor; 2 possible bedrooms
- Flooring: Engineered hardwood; Tile
- Bathrooms: 2 full bathrooms
- Heating & cooling: Central heating (electric); Central air conditioning (electric)
- Interior features: Pantry; Tub with shower; Ceiling fan(s); Wood-burning fireplace (1)
- Laundry & utility: Washer and dryer included; Laundry in utility room; Electric and gas dryer hookups; Common area laundry available
Neighborhood map
What this means for you Summary
Snapshot
- This is a 2-bed/2.0-bath condo listed at $98k.
Deal economics
- At list price, monthly cash flow is $-115 ($-1k/yr) — negative.
- To cash-flow at today's rent, offer at most $81k (17.1% below list).
- Meets the 1% rule at list price ($1k rent vs $98k).
- Recommended offer: $81k (17.1% below list) — sets the bar for cash-flow.
- Cap rate 4.9% vs local median 3.2% in Houston — top-decile yield for the area; either an underpriced asset or a hidden risk that comps aren't pricing in. Stress-test before assuming the spread holds.
Location & tenants
- Location reads 74/100 on livability (#184 in TX, #4,771 nationally) — a middle-class / working-renter tenant base. Strengths: amenities A+, cost of living A+, housing A+; Watch: crime F.
- Clear Creek ISD (suburban): math 48% / reading 54% proficiency, ranked #114 of 826 in TX (top 14%) — acceptable for families but not a draw, mixed tenant base, ~2y average lease.
- Zoned schools: Falcon Pass El (math 52% / reading 56%, grade C, #664 of 4,322 statewide, top 16%, 573 students, 41% FRL); Space Center Int (math 31% / reading 44%, grade F, #736 of 1,662 statewide, top 45%, 827 students, 57% FRL); Clear Creek H S (math 51% / reading 54%, grade C-, #444 of 1,632 statewide, top 27%, 2,400 students, 0% FRL).
- Market conditions: Rents rising (+1.9%/yr); 134 active listings in the ZIP; 40 comparable units currently listed for rent nearby; rentals at typical pace (median 24d on market — plan ~3-4 weeks tenant-placement turnaround); 29,883 units permitted in Harris County in 2024 (8,621 in 5+ unit buildings).
Forward outlook
- Local home prices are declining (-1.2%/yr); year-one equity from $678 of loan paydown is wiped out by about $1k of value loss. Plan a longer hold.
- Harris County population projected at +47% by 2050 — long-run rental-demand tailwind backs the buy-and-hold thesis.
Negotiation context
- It's been on market 398 days — a 12% lower offer ($86k) is reasonable based on typical stale-listing flexibility.
- 10 sale attempts since 2y ago; this cycle's ask is 6777% above the opening price — seller raised mid-cycle; expect resistance to lowballs.
Risks & watch-outs
- Watch-outs: HOA is 32% of rent.
- Climate carrying-cost: major flood risk; severe wind risk, 99% chance of damaging wind over 30y; extreme-heat days projected 7→25/yr by 2055 (HVAC capex compounding) — expect insurance premiums to compound above CPI over the hold.
Questions for the listing agent
- What do current leases actually rent for vs. the listed asking? Can we see a recent rent roll and the last 12 months of T-12 income?
- It's been on market 398 days. Have you received any prior offers? Is the seller open to a 17% concession, seller financing, or rate buy-down credit?
- Built in 1975 — when were the roof, HVAC, electrical panel, plumbing, and water heater last replaced?
- What does the HOA fee cover, when was the last increase, and are there any pending special assessments or reserve-fund shortfalls?
- Any open or pending special assessments — roof, HVAC, plumbing, elevator, façade? What's the per-unit balance and payoff schedule, and is the seller paying it off at close or rolling it to the buyer?
- Why hasn't it sold? Are there any deal-killer items the seller is aware of (foundation, flood, title, zoning, code violations)?
- Is there a deadline driving the sale (1031 exchange, divorce, estate, relocation)? That informs how much negotiation room exists.
- Schools are D-rated, which usually means shorter tenancies and higher turnover. Who's the typical renter profile here, and what's been the actual vacancy rate?
- Crime grade is F in this area — have there been break-ins, vandalism, or insurance claims at this property in the last 3 years? What carrier currently insures it and at what premium?
- The area grade is low — what's the realistic commute time and amenity access for the typical tenant pool here? Any planned neighborhood developments (good or bad) we should know about?
- What's the average days-on-market for RENTAL listings here right now (not sales)? A rising rental-DOM trend means longer vacancies and softer asking-rent achievability than the comps imply.
- What's the recent tenant-quality profile in this submarket — average credit score on applications, eviction rate, late-payment / NSF rate, and stable-employment percentage? A property-management company in the area should have these aggregated.
- How much new apartment / multifamily construction is in the pipeline within 1–3 miles? Heavy new supply (>2% of stock underway) typically softens rents 12–24 months out; light construction supports rent growth.
Investment metrics
- 1% rule
- 1.22% ✓
- Cap rate
- 4.88%
- Cash-on-cash
- -5.05%
- DSCR
- 0.78
- GRM
- 6.8
CMA / ARV
No comps found within radius.
Projected returns pro-forma
-1.22% appreciation · 1.92% rent growth · sell at horizon
- IRR
- -14.7%
- Equity multiple
- 0.39×
- Total profit
- $-16,730
- Equity at exit
- $22,634
- IRR
- -9.3%
- Equity multiple
- 0.23×
- Total profit
- $-21,179
- Equity at exit
- $22,907
Cash invested: $27,440 (down + closing). Projections, not guarantees.
Landlord ↔ Tenant lean methodology
- Overall (STATE)
- 87 Strongly Landlord-Friendly
- State Texas
- 87 Strongly Landlord-Friendly · R+5
- County
- — inherits STATE
- City
- — inherits STATE
ZIP-level market 77058
- Home prices YoY
- -0.5%
- Rents YoY
- 1.9%
- Active inventory
- 134
- Price-to-rent
- 6.8×
Monthly cashflow live
- Estimated rent
- $1,200 high interval (Pro) →
- Mortgage (P&I)
- −$514
- Tax est. 1.5%
- −$122 /mo · $1,470/yr
- Insurance
- −$41
- HOA
- −$386
- Vacancy / Maint / Mgmt
- −$252
- Net cashflow
- $-115
Break-even live
Sensitivity live
| Price | -10% $-48 | -5% $-82 | +0% $-115 | +5% $-149 | +10% $-183 |
|---|---|---|---|---|---|
| Rent | -10% $-210 | -5% $-163 | +0% $-115 | +5% $-68 | +10% $-21 |
| Rate | -1.0pp $-66 | -0.5pp $-91 | base $-115 | +0.5pp $-141 | +1.0pp $-167 |
UW: 25.0% down · 7.5% · 30yr · 1.5% tax · 5.0% vac · 8.0% maint · 8.0% mgmt
Financing live
Cash to close
- Down payment
- $24,500
- Closing costs
- $2,940
- Reserves months
- —
- Total cash needed
- —
Loan-product check · same deal, 3 products live
Conventional
25% down · 7.5% · 30yr
- Down + closing
- —
- Monthly P&I
- —
- Monthly cashflow
- —
- DSCR
- —
- Eligible?
- —
Personal DTI + credit; lowest rate.
DSCR
20% down · 8.5% · 30yr
- Down + closing
- —
- Monthly P&I
- —
- Monthly cashflow
- —
- DSCR
- —
- Eligible?
- —
No personal income docs; deal must DSCR.
Hard money
10% down · 12.0% · 12mo
- Down + closing
- —
- Monthly P&I
- —
- Monthly cashflow
- —
- DSCR
- —
- Eligible?
- —
Short-term bridge; refi at stabilization.
Rent comps 40 comps
| Address | Beds | Baths | Sqft | Rent | $/sqft | DOM | Units | Dist |
|---|---|---|---|---|---|---|---|---|
| 2000 Bay Area Blvd Houston, TX | 2.0 | 1.0–2.0 | 841 | $1,764 | $2.10 | 0d | 18 | 0.13mi |
| 1707 Gemini St Houston, TX | 2.0 | 2.0 | 946 | $1,109 | $1.17 | 45d | 1 | 0.14mi |
| 1707 Gemini St Houston, TX | 1.0 | 1.0 | 652 | $940 | $1.44 | 20d | 1 | 0.14mi |
| 1707 Gemini St Houston, TX | 1.0 | 1.0 | 652 | $940 | $1.44 | 22d | 1 | 0.14mi |
| 1730 Bay Area Blvd Houston, TX | 1.0 | 1.0 | 761 | $981 | $1.29 | 45d | 1 | 0.15mi |
| 1730 Bay Area Blvd Houston, TX | 1.0 | 1.0 | 761 | $981 | $1.29 | 23d | 1 | 0.15mi |
| 1730 Bay Area Blvd Houston, TX | 2.0 | 2.0 | 938 | $1,266 | $1.35 | 26d | 1 | 0.15mi |
| 1620 Bay Area Blvd Houston, TX | 2.0 | 1.0–2.0 | 685 | $1,475 | $2.15 | 0d | 23 | 0.19mi |
| 1500 Bay Area Blvd Unit R195 Houston, TX | 2.0 | 2.0 | 850 | $1,100 | $1.29 | 26d | 1 | 0.39mi |
| 1500 Bay Area Blvd Houston, TX | 2.0 | 2.0 | 850 | $1,250 | $1.47 | 45d | 1 | 0.39mi |
| 1424 Gemini St Houston, TX | 1.0 | 1.0 | 730 | $1,254 | $1.72 | 20d | 1 | 0.44mi |
| 16200 Center Blvd Unit 422 Houston, TX | 2.0 | 2.0 | 975 | $1,002 | $1.03 | 9d | 1 | 0.46mi |
| 16200 Center Blvd Unit 16251 Houston, TX | 1.0 | 1.0 | 682 | $833 | $1.22 | 45d | 1 | 0.46mi |
| 16200 Center Blvd Unit 2047 Houston, TX | 2.0 | 2.0 | 975 | $986 | $1.01 | 0d | 1 | 0.46mi |
| 16200 Center Blvd Unit 16221 Houston, TX | 1.0 | 1.0 | 682 | $838 | $1.23 | 14d | 1 | 0.46mi |
| 16200 Center Blvd Unit 16257 Houston, TX | 2.0 | 2.0 | 975 | $1,112 | $1.14 | 45d | 1 | 0.46mi |
| 16200 Center Blvd Unit 424 Houston, TX | 2.0 | 2.0 | 975 | $1,002 | $1.03 | 7d | 1 | 0.46mi |
| 1245 Bay Area Blvd Houston, TX | 2.0 | 2.0 | 850 | $1,062 | $1.25 | 26d | 1 | 0.47mi |
| 16100 Center Blvd Unit 16151 Houston, TX | 1.0 | 1.0 | 678 | $925 | $1.36 | 45d | 1 | 0.49mi |
| 16100 Center Blvd Unit 16157 Houston, TX | 2.0 | 2.0 | 903 | $1,319 | $1.46 | 45d | 1 | 0.49mi |
| 16106 Center Blvd Spc Center Houston, TX | 1.0 | 1.0 | 687 | $920 | $1.34 | 45d | 1 | 0.50mi |
| 16100 Center Blvd Spc Center Houston, TX | 1.0–2.0 | 1.0–2.0 | 812 | $1,411 | $1.74 | 3d | 12 | 0.51mi |
| 1306 Gemini St Houston, TX | 1.0 | 1.0 | 660 | $1,180 | $1.79 | 45d | 1 | 0.54mi |
| 306 Cyberonics Blvd Houston, TX | 1.0 | 1.0 | 700 | $949 | $1.36 | 20d | 1 | 0.61mi |
| 306 Cyberonics Blvd Houston, TX | 1.0 | 1.0 | 700 | $949 | $1.36 | 45d | 1 | 0.61mi |
| 306 Cyberonics Blvd Houston, TX | 2.0 | 2.0 | 1040 | $1,170 | $1.12 | 26d | 1 | 0.61mi |
| 1300 Gemini St Houston, TX | 1.0–2.0 | 1.0–2.0 | 956 | $1,949 | $2.04 | 0d | 30 | 0.61mi |
| 1239 Bay Area Blvd Houston, TX | 1.0 | 1.0 | 670 | $955 | $1.43 | 14d | 1 | 0.62mi |
| 1239 Bay Area Blvd Houston, TX | 2.0 | 1.0 | 800 | $999 | $1.25 | 45d | 1 | 0.62mi |
| 1239 Bay Area Blvd Houston, TX | 1.0 | 1.0 | 670 | $955 | $1.43 | 26d | 1 | 0.62mi |
| 1239 Bay Area Blvd Houston, TX | 2.0 | 1.0 | 800 | $1,099 | $1.37 | 9d | 1 | 0.62mi |
| 2323 Fairwind Dr #105 Houston, TX | 1.0 | 1.0 | 704 | $1,400 | $1.99 | 23d | 1 | 0.64mi |
| 15900 Center Blvd Spc Center Houston, TX | 1.0–3.0 | 1.0–2.5 | 894 | $1,225 | $1.37 | 0d | 9 | 0.67mi |
| 300 Cyberonics Blvd Unit 424 Houston, TX | 2.0 | 2.0 | 1040 | $1,215 | $1.17 | 9d | 1 | 0.69mi |
| 300 Cyberonics Blvd Unit 321 Houston, TX | 1.0 | 1.0 | 700 | $889 | $1.27 | 0d | 1 | 0.69mi |
| 300 Cyberonics Blvd Unit 351 Houston, TX | 1.0 | 1.0 | 700 | $930 | $1.33 | 45d | 1 | 0.69mi |
| 300 Cyberonics Blvd Unit 324 Houston, TX | 1.0 | 1.0 | 700 | $900 | $1.29 | 9d | 1 | 0.69mi |
| 300 Cyberonics Blvd Unit 357 Houston, TX | 2.0 | 2.0 | 1040 | $1,199 | $1.15 | 0d | 1 | 0.69mi |
| 300 Cyberonics Blvd Unit 321 Houston, TX | 1.0 | 1.0 | 700 | $935 | $1.34 | 14d | 1 | 0.69mi |
| 15906 Center BLVD Spc Center Houston, TX | 1.0 | 1.0 | 638 | $881 | $1.38 | 26d | 1 | 0.70mi |
HOA detail condo
- Monthly dues
- $386 · $4,632/yr
- Likely covers
- exterior maint.
- Assessments
- None detected in remarks — confirm with the listing agent.
Listing history 10 events
-
2026-06-21days on market $98,000 Active 398 DOM
-
2026-06-18days on market $98,000 Active 395 DOM
-
2026-06-17days on market $98,000 Active 394 DOM
-
2026-06-16days on market $98,000 Active 393 DOM
-
2026-06-15days on market $98,000 Active 392 DOM
-
2026-06-13days on market $98,000 Active 390 DOM
-
2026-06-13days on market $98,000 Active 389 DOM
-
2026-06-09days on market $98,000 Active 386 DOM
-
2026-06-08remarks 699-char remark
-
2026-06-08$98,000 Active 385 DOM
ⓘ Source: listings_history table (triggers on properties + properties_extension) + one-shot
backfill from property_details.listing_events for pre-trigger history.
Climate risk First Street
- Flood 6/10 Major FEMA zone X (unshaded) · 72% chance over 30 yrs
- Wildfire 2/10 Low
- Heat 10/10 Extreme 7 d/yr ≥107°F today · 25 d/yr by 30 yrs out
- Wind 9/10 Extreme 99% chance of damaging wind over 30 yrs
- Air quality 2/10 Low 1 unhealthy d/yr today · 1 by 30 yrs out
Nearby sold comps map
Loading sold comps map…
Walkable amenities ~0.75 mi
Loading nearby amenities…
Taxation est. · year 1
- Rental income
- $14,397
- − Mortgage interest
- −$5,490
- − Property taxes
- −$1,470
- − Insurance
- −$490
- − Repairs & maintenance
- −$1,152
- − Management
- −$1,152
- − HOA
- −$4,632
- − Depreciation
- −$2,851
- Taxable loss
- −$2,839
- Est. tax savings @ 24.0%
- +$681
- After-tax cash flow
- $-704/yr
For passive investors: Depreciation is non-cash, so a rental often shows a tax loss while cash-flowing — sheltering income. Rental losses are passive: they offset passive income freely, and up to $25,000/yr can offset ordinary (W-2) income if you actively participate and your MAGI is under $100k (phasing out to $0 by $150k); unused losses carry forward. On sale, claimed depreciation is recaptured at up to 25%, and gains may owe capital-gains tax (a 1031 exchange can defer both). Figures are a year-1 estimate at your 24.0% rate — not tax advice; consult a CPA.
Schools (NCES district)
- District
- Clear Creek ISD
- NCES district ID
- 4814280
- Math proficiency
- 48% ▼ -10.00%
- Reading proficiency
- 54% ▼ -4.00%
- Median HH income
- $80,240
- Composite
- 46.49/100
- National rank
- #2431
- State rank
- #114 of 826 in TX
Livability — Houston
- Score
- 74/100
- State rank
- #184
- US rank
- #4771
Category grades
Schools grade is shown separately in the Schools card above.
Census & demographics
- Census place
- Houston, TX
- County
- Harris County · 4,702,590 people
- City population
- 3,226,434
- Metro
- Houston-The Woodlands-Sugar Land, TX
- Population (ZIP)
- 17,850
- Household income
- $68,722
- Rent vs Own
- Severe rent burden
- 1147.0
Population outlook (Harris County) Hauer SSP2
- Today (2025)
- 5,571,493 people
- By 2030
- 6,089,821 · +9.3%
- By 2040
- 7,142,806 · +28.2%
- By 2050
- 8,185,864 · +46.9%
- By 2075
- 10,574,329 · +89.8%
- By 2100
- 12,109,958 · +117.4%
Race, ethnicity, and origin ACS 2023
- Neighborhood character
- Diverse neighborhood (Simpson 0.64)
- Race & ethnicity
- White 55% Hispanic / Latino 21% Two or more races 15% Asian 10% Black 5%
- Hispanic origin (detail)
- Mexican 14% Puerto Rican 1%
- Common ancestry
- Italian 6% Lithuanian 3% Portuguese 2%
- Foreign-born
- 21% · Canada, Vietnam, China
- Languages at home
- 70% English-only · Spanish 15% Other Indo-European 5% Vietnamese 2%
Political lean MEDSL · Harris
- 2024 margin
- Lean D (+5.5) · D 52.0% · R 46.4% · Other 1.6%
- 2008→2024 swing
- +3.9pp toward D · 2008: 1.6pp · 2024: 5.5pp
- All cycles
- 2024: D+5.5 2020: D+13.3 2016: D+12.4 2012: D+0.1 2008: D+1.6
Not yet ingested
- Civics
- —
Market trends
- HPI YoY
- ▼ -1.22%
- Current HPI
- 225.0251
- Rent YoY
- ▲ 1.92%
- Metro
- Houston-The Woodlands-Sugar Land, TX
- State GDP YoY
- ▲ 3.95%
- F500 in state
- 110
Industry mix (Fortune 500 HQ in TX)
| Industry | F500 HQs | Revenue |
|---|---|---|
| Energy | 16 | $1,198B |
|
||
| Technology | 5 | $198B |
|
||
| Engineering / Construction | 4 | $72B |
|
||
| Energy Services | 3 | $60B |
|
||
| Utilities | 3 | $41B |
|
||
| Healthcare | 2 | $330B |
|
||
Price history
-14.8% since first listed27 events — show timeline
- 2026-06-08 Relisted — HARMLS
- 2026-06-03 Price Changed $98,000 HARMLS
- 2026-04-23 Listing Removed — HARMLS
- 2026-02-17 Price Changed $99,900 HARMLS
- 2026-02-17 Price Changed $103,000 HARMLS
- 2025-11-10 Price Changed $104,995 HARMLS
- 2025-09-21 Rental Removed $1,425 HARMLS
- 2025-09-17 Price Changed $105,000 HARMLS
- 2025-07-08 Listed for Rent $1,425 HARMLS
- 2025-06-30 Rental Removed $1,425 HARMLS
- 2025-06-13 Listed for Rent $1,425 HARMLS
- 2025-06-12 Relisted — HARMLS
- 2025-06-11 Listing Removed — HARMLS
- 2025-04-02 Listed $110,000 HARMLS
- 2025-04-02 Coming Soon $110,000 HARMLS
- 2025-04-02 Listing Removed — HARMLS
- 2025-01-30 Relisted — HARMLS
- 2025-01-28 Relisted — HARMLS
- 2025-01-27 Listing Removed — HARMLS
- 2025-01-27 Listing Removed — HARMLS
- 2025-01-22 Price Changed $110,000 HARMLS
- 2025-01-22 Relisted — HARMLS
- 2025-01-22 Relisted — HARMLS
- 2025-01-19 Listing Removed — HARMLS
- 2025-01-19 Listing Removed — HARMLS
- 2024-11-11 Listed $115,000 HARMLS
- 2024-11-08 Coming Soon — HARMLS
Cash-flow waterfall
monthlySold comps — $/sqft
last 12 mo · ≤1 miLoading sold comps…