218 Amelo Ave · Bradenton, FL
Flood risk No data
- FEMA flood zone
- —
- Chance of flooding over 30 yrs
- —
- Est. flood insurance / yr
- —
Fire risk No data
- Est. fire insurance / yr
- —
Heat risk No data
- Hot days now (above threshold)
- —
- Hot days in 30 yrs
- —
Wind risk No data
- Chance of severe wind over 30 yrs
- —
Air-quality risk No data
- Unhealthy air days now
- —
- Unhealthy air days in 30 yrs
- —
Risk factors via First Street. Map © Google.
Why this score? — see what drove the D- grade
The composite is a weighted blend of 9 inputs, each scored 0–100. Each bar is that input's sub-score; the figure is the points it added to the 100-point composite (weight × sub-score).
- Cash flow +12.0/30.0
- Condition / age +5.0/5.0
- Schools +4.4/10.0
- Livability +4.0/5.0
- DSCR +3.6/10.0
- 1% rule +3.5/10.0
- Rent growth +2.5/5.0
- ARV discount +1.9/15.0
- Appreciation +0.0/10.0
$238,000
🖨 Deal sheet (PDF) 📄 Offer letter ✓ Due diligence
Listing remarks
55+ age qualified community. Welcome to Colony Cove, a 55+ age-qualified, active, and vibrant community where you can find yourself in your dream home. We have a rare opportunity for you with expansive lake views, open floor plan 2026 home, (2-bedroom, 2-bath) for sale featuring 1,512 sq. ft. of beautifully designed living space. Located in Ellenton FL, this abode offers the perfect blend of modern amenities and timeless charm. Step inside to find an open-concept floor plan, high ceilings, and upgraded appliances. The island kitchen boasts an impressive amount of countertop space and storage, perfect for both everyday living and entertaining. The spacious owner's suite offers a peaceful ret
Key facts
- Open floor plan
- Lake views
- Island kitchen
Tags
Property features AI
Finance
- Other: Living area approximately 1,512
- Financial info: List price $238,000
Exterior
- Home design: Venice floor plan; Single-family property (spec home)
- Construction: Built 2026 (new construction); Reserve Series from builder
- Exterior features: Rear porch (per plan)
Interior
- Bedrooms: 2 bedrooms
- Bathrooms: 2 full bathrooms
- Interior features: Spec home from the Reserve Series (Venice plan with rear porch)
Neighborhood map
What this means for you Summary
Snapshot
- This is a 2-bed/2.0-bath manufactured listed at $238k. Condition is rated excellent.
Deal economics
- At list price, monthly cash flow is $-55 ($-655/yr) — negative.
- To cash-flow at today's rent, offer at most $230k (3.3% below list).
- To meet the 1% rule (rent ≥ 1% of price), the offer needs to be $201k (15.4% below list).
- Recommended offer: $201k (15.4% below list) — sets the bar for 1% rule.
- Cap rate 6.0% vs local median 3.6% in Bradenton — top-decile yield for the area; either an underpriced asset or a hidden risk that comps aren't pricing in. Stress-test before assuming the spread holds.
Location & tenants
- Location reads 81/100 on livability (#101 in FL, #1,528 nationally) — a professional / high-income tenant draw. Strengths: commute A+, cost of living A+, housing A+; Watch: employment D+, crime D, amenities F.
- Manatee (suburban): math 54% / reading 50% proficiency, ranked #26 of 73 in FL (top 36%) — acceptable for families but not a draw, mixed tenant base, ~2y average lease.
- Zoned schools: Blackburn Elementary School (math 62% / reading 42%, grade C-, #990 of 2,144 statewide, top 48%, 551 students, 78% FRL); Palmetto High School (math 22% / reading 36%, grade F, #456 of 667 statewide, top 68%, 2,100 students, 61% FRL) — zoned schools average 70% FRL vs 51% district-wide (19 pts higher); higher-poverty schools than district average — tighter screening recommended.
- Market conditions: 185 active listings in the ZIP; 12 comparable units currently listed for rent nearby; rentals at typical pace (median 17d on market — plan ~3-4 weeks tenant-placement turnaround); 7,472 units permitted in Manatee County in 2024 (1,782 in 5+ unit buildings).
- This rent runs 38% of the median local income ($64k/yr) — at the standard rent-burdened threshold; future hikes will face affordability resistance.
Forward outlook
- Local home prices are declining (-3.0%/yr); year-one equity from $2k of loan paydown is wiped out by about $7k of value loss. Plan a longer hold.
- Manatee County population projected at +43% by 2050 — long-run rental-demand tailwind backs the buy-and-hold thesis.
Negotiation context
- It's been on market 80 days — a 6% lower offer ($224k) is reasonable based on typical stale-listing flexibility.
Questions for the listing agent
- What do current leases actually rent for vs. the listed asking? Can we see a recent rent roll and the last 12 months of T-12 income?
- It's been on market 80 days. Have you received any prior offers? Is the seller open to a 15% concession, seller financing, or rate buy-down credit?
- Why hasn't it sold? Are there any deal-killer items the seller is aware of (foundation, flood, title, zoning, code violations)?
- Is there a deadline driving the sale (1031 exchange, divorce, estate, relocation)? That informs how much negotiation room exists.
- Crime grade is D in this area — have there been break-ins, vandalism, or insurance claims at this property in the last 3 years? What carrier currently insures it and at what premium?
- The area grade is low — what's the realistic commute time and amenity access for the typical tenant pool here? Any planned neighborhood developments (good or bad) we should know about?
- What's the average days-on-market for RENTAL listings here right now (not sales)? A rising rental-DOM trend means longer vacancies and softer asking-rent achievability than the comps imply.
- What's the recent tenant-quality profile in this submarket — average credit score on applications, eviction rate, late-payment / NSF rate, and stable-employment percentage? A property-management company in the area should have these aggregated.
- How much new for-sale + rental construction is in the pipeline within 1–3 miles? Heavy new supply typically softens prices + rents 12–24 months out; constrained supply supports both.
Investment metrics
- 1% rule
- 0.85% ✗
- Cap rate
- 6.02%
- Cash-on-cash
- -0.98%
- DSCR
- 0.96
- GRM
- 9.9
CMA / ARV
- ARV (on-the-fly)
- $211,680
- Comps found
- 12
Show comp detail 12 sales within ~0.75 mi
| Address | Dist | Beds/Ba | Sqft | Sold | Price | $/sf | Match |
|---|---|---|---|---|---|---|---|
| 99 Meadow Cir | 0.45mi | 2/2.0 | 1,404 (-7%) | 4mo | $120,000 | $85 | 64 |
| 100 Whipporwill Ct | 0.56mi | 2/2.0 | 1,606 (+6%) | 2mo | $150,000 | $93 | 62 |
| 77 Spoonbill Ln | 0.43mi | 2/2.0 | 1,352 (-11%) | 2mo | $140,000 | $104 | 60 |
| 137 Osprey Cir | 0.52mi | 2/2.0 | 1,352 (-11%) | 3mo | $190,000 | $141 | 56 |
| 85 Meadow Cir | 0.50mi | 2/2.0 | 1,620 (+7%) | 11mo | $241,000 | $149 | 56 |
| 51 Partridge Ave | 0.50mi | 2/2.0 | 1,318 (-13%) | 2mo | $233,000 | $177 | 54 |
| 181 Nightingale Cir | 0.63mi | 3/2.0 (+1) | 1,620 (+7%) | 6mo | $190,000 | $117 | 49 |
| 159 Osprey Cir Unit na | 0.55mi | 2/2.0 | 1,296 (-14%) | 4mo | $181,000 | $140 | 47 |
| 93 Meadow Cir | 0.48mi | 2/2.0 | 1,296 (-14%) | 9mo | $127,500 | $98 | 46 |
| 165 Nightingale Cir | 0.60mi | 2/2.0 | 1,720 (+14%) | 7mo | $290,000 | $169 | 44 |
| 158 Nightingale Cir | 0.68mi | 2/2.0 | 1,287 (-15%) | 2mo | $185,000 | $144 | 42 |
| 3113 Dorothy Pl | 0.72mi | 2/2.0 | 1,300 (-14%) | 8mo | $140,000 | $108 | 37 |
Match score weights: distance 35% · size 25% · config 20% · recency 20%. Top-matched comps best support the ARV.
Projected returns pro-forma
-3.0% appreciation · 3.0% rent growth · sell at horizon
- IRR
- -17.9%
- Equity multiple
- 0.37×
- Total profit
- $-42,014
- Equity at exit
- $35,487
- IRR
- -10.1%
- Equity multiple
- 0.39×
- Total profit
- $-40,940
- Equity at exit
- $20,578
Cash invested: $66,640 (down + closing). Projections, not guarantees.
Landlord ↔ Tenant lean methodology
- Overall (STATE)
- 87 Strongly Landlord-Friendly
- State Florida
- 87 Strongly Landlord-Friendly · R+3
- County
- — inherits STATE
- City
- — inherits STATE
ZIP-level market 34222
- Home prices YoY
- -26.9%
- Active inventory
- 185
- Price-to-rent
- 9.9×
Monthly cashflow live
- Estimated rent
- $2,013 high interval (Pro) →
- Mortgage (P&I)
- −$1,248
- Tax est. 1.5%
- −$298 /mo · $3,570/yr
- Insurance
- −$99
- HOA
- −$0
- Vacancy / Maint / Mgmt
- −$423
- Net cashflow
- $-55
Break-even live
Sensitivity live
| Price | -10% $110 | -5% $28 | +0% $-55 | +5% $-137 | +10% $-219 |
|---|---|---|---|---|---|
| Rent | -10% $-214 | -5% $-134 | +0% $-55 | +5% $25 | +10% $104 |
| Rate | -1.0pp $65 | -0.5pp $6 | base $-55 | +0.5pp $-116 | +1.0pp $-179 |
UW: 25.0% down · 7.5% · 30yr · 1.5% tax · 5.0% vac · 8.0% maint · 8.0% mgmt
Financing live
Cash to close
- Down payment
- $59,500
- Closing costs
- $7,140
- Reserves months
- —
- Total cash needed
- —
Loan-product check · same deal, 3 products live
Conventional
25% down · 7.5% · 30yr
- Down + closing
- —
- Monthly P&I
- —
- Monthly cashflow
- —
- DSCR
- —
- Eligible?
- —
Personal DTI + credit; lowest rate.
DSCR
20% down · 8.5% · 30yr
- Down + closing
- —
- Monthly P&I
- —
- Monthly cashflow
- —
- DSCR
- —
- Eligible?
- —
No personal income docs; deal must DSCR.
Hard money
10% down · 12.0% · 12mo
- Down + closing
- —
- Monthly P&I
- —
- Monthly cashflow
- —
- DSCR
- —
- Eligible?
- —
Short-term bridge; refi at stabilization.
Rent comps 12 comps
| Address | Beds | Baths | Sqft | Rent | $/sqft | DOM | Units | Dist |
|---|---|---|---|---|---|---|---|---|
| 482 Outer Dr Unit NA Ellenton, FL | 3.0 | 2.0 | 1400 | $1,600 | $1.14 | 5d | 1 | 0.41mi |
| 5942 Factory Shops Blvd Ellenton, FL | 1.0–3.0 | 1.0–2.0 | 953 | $2,362 | $2.48 | 3d | 67 | 0.90mi |
| 2710 59th Dr E Ellenton, FL | 1.0–3.0 | 1.0–2.0 | 1149 | $2,234 | $1.94 | 4d | 37 | 0.93mi |
| 3119 61st Dr E Ellenton, FL | 3.0 | 2.0 | 1662 | $2,550 | $1.53 | 5d | 1 | 0.98mi |
| 3808 Sunset Dr Ellenton, FL | 3.0 | 2.0 | 1441 | $1,699 | $1.18 | 23d | 1 | 1.04mi |
| 8314 Nancy Ln Ellenton, FL | 2.0 | 2.0 | 1404 | $1,895 | $1.35 | 25d | 1 | 1.08mi |
| 7711 Desoto Dr Ellenton, FL | 2.0 | 2.5 | 1356 | $1,599 | $1.18 | 16d | 1 | 1.14mi |
| 3931 Day Bridge Pl Ellenton, FL | 3.0 | 2.0 | 1250 | $2,295 | $1.84 | 5d | 1 | 1.17mi |
| 1143 Riverscape St Unit A Bradenton, FL | 3.0 | 2.0 | 1748 | $6,500 | $3.72 | 16d | 1 | 1.24mi |
| 3908 Lemonwood Dr N Ellenton, FL | 2.0 | 2.0 | 1400 | $1,750 | $1.25 | 25d | 1 | 1.27mi |
| 6411 Grand Estuary Trl #401 Bradenton, FL | 2.0 | 2.0 | 1156 | $2,325 | $2.01 | 18d | 1 | 1.49mi |
| 4180 Yardly Dr Palmetto, FL | 1.0–3.0 | 1.0–2.0 | 1021 | $2,498 | $2.45 | 5d | 15 | 1.50mi |
Listing history 15 events
-
2026-06-22days on market $238,000 Active 80 DOM
-
2026-06-18days on market $238,000 Active 77 DOM
-
2026-06-17days on market $238,000 Active 76 DOM
-
2026-06-16days on market $238,000 Active 75 DOM
-
2026-06-15days on market $238,000 Active 74 DOM
-
2026-06-13days on market $238,000 Active 72 DOM
-
2026-06-13days on market $238,000 Active 71 DOM
-
2026-06-10days on market $238,000 Active 69 DOM
-
2026-06-09days on market $238,000 Active 68 DOM
-
2026-06-08days on market $238,000 Active 67 DOM
-
2026-06-08days on market $238,000 Active 66 DOM
-
2026-06-03days on market $238,000 Active 62 DOM
-
2026-06-02days on market $238,000 Active 61 DOM
-
2026-06-01days on market $238,000 Active 60 DOM
-
2026-05-31days on market $238,000 Active 59 DOM
ⓘ Source: listings_history table (triggers on properties + properties_extension) + one-shot
backfill from property_details.listing_events for pre-trigger history.
Nearby sold comps map
Loading sold comps map…
Walkable amenities ~0.75 mi
Loading nearby amenities…
Taxation est. · year 1
- Rental income
- $24,154
- − Mortgage interest
- −$13,332
- − Property taxes
- −$3,570
- − Insurance
- −$1,190
- − Repairs & maintenance
- −$1,932
- − Management
- −$1,932
- − Depreciation
- −$6,924
- Taxable loss
- −$4,726
- Est. tax savings @ 24.0%
- +$1,134
- After-tax cash flow
- $479/yr
For passive investors: Depreciation is non-cash, so a rental often shows a tax loss while cash-flowing — sheltering income. Rental losses are passive: they offset passive income freely, and up to $25,000/yr can offset ordinary (W-2) income if you actively participate and your MAGI is under $100k (phasing out to $0 by $150k); unused losses carry forward. On sale, claimed depreciation is recaptured at up to 25%, and gains may owe capital-gains tax (a 1031 exchange can defer both). Figures are a year-1 estimate at your 24.0% rate — not tax advice; consult a CPA.
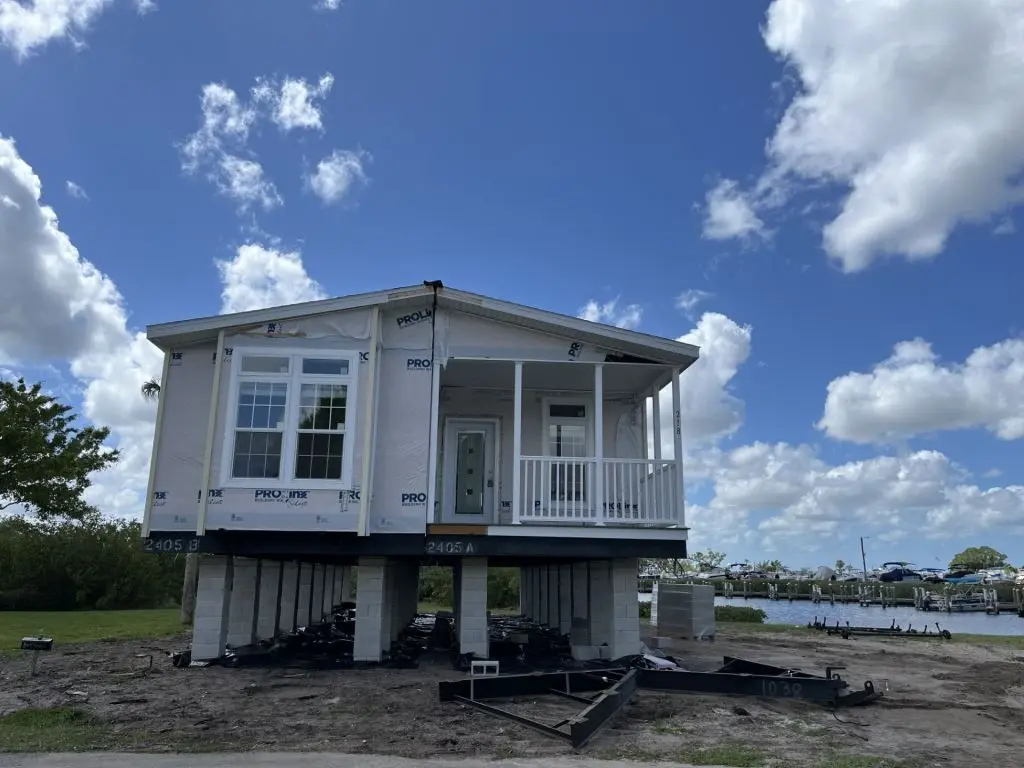
Condition & rehab AI · 2 photos
This 55+ age-qualified home in Colony Cove, Ellenton FL, is move-in ready with new construction and expansive lake views. It offers a perfect blend of modern amenities and timeless charm.
Schools (NCES district)
- District
- Manatee
- NCES district ID
- 1201230
- Math proficiency
- 54% ▼ -6.00%
- Reading proficiency
- 50% ▼ -2.00%
- Median HH income
- $49,607
- Composite
- 44.43/100
- National rank
- #2806
- State rank
- #26 of 73 in FL
Livability — Bradenton
- Score
- 81/100
- State rank
- #101
- US rank
- #1528
Category grades
Schools grade is shown separately in the Schools card above.
Census & demographics
- County
- Manatee County · 416,364 people
- City population
- 227,091
- Metro
- North Port-Sarasota-Bradenton, FL
- Population (ZIP)
- 14,819
- Household income
- $64,355
- Rent vs Own
- Severe rent burden
- 313.0
Population outlook (Manatee County) Hauer SSP2
- Today (2025)
- 447,342 people
- By 2030
- 488,911 · +9.3%
- By 2040
- 567,934 · +27.0%
- By 2050
- 637,995 · +42.6%
- By 2075
- 781,970 · +74.8%
- By 2100
- 848,272 · +89.6%
Race, ethnicity, and origin ACS 2023
- Neighborhood character
- Predominantly White (70%)
- Race & ethnicity
- White 70% Hispanic / Latino 17% Two or more races 13% Black 7% Native American 2% Asian 1%
- Hispanic origin (detail)
- Mexican 8% Puerto Rican 2%
- Common ancestry
- Romanian 3% Slovak 2% Lithuanian 2%
- Foreign-born
- 8% · Canada, Jamaica, Vietnam
- Languages at home
- 88% English-only · Spanish 10% Other Indo-European 1% Vietnamese 1%
Political lean MEDSL · Manatee
- 2024 margin
- Strong R (+23.5) · D 37.9% · R 61.4%
- 2008→2024 swing
- -16.5pp toward R · 2008: -7.0pp · 2024: -23.5pp
- All cycles
- 2024: R+23.5 2020: R+16.1 2016: R+17.1 2012: R+12.5 2008: R+7.0
Not yet ingested
- Civics
- —
Market trends
- HPI YoY
- ▼ -107.75%
- Current HPI
- 293.2597
- Rent YoY
- —
- Metro
- North Port-Sarasota-Bradenton, FL
- State GDP YoY
- ▲ 3.28%
- F500 in state
- 36
Industry mix (Fortune 500 HQ in FL)
| Industry | F500 HQs | Revenue |
|---|---|---|
| Industrial Technology | 2 | $29B |
|
||
| Insurance | 2 | $17B |
|
||
| Retail | 1 | $60B |
|
||
| Technology Distribution | 1 | $58B |
|
||
| Homebuilding | 1 | $35B |
|
||
| Technology Manufacturing | 1 | $35B |
|
||
Cash-flow waterfall
monthlySold comps — $/sqft
last 12 mo · ≤1 miLoading sold comps…