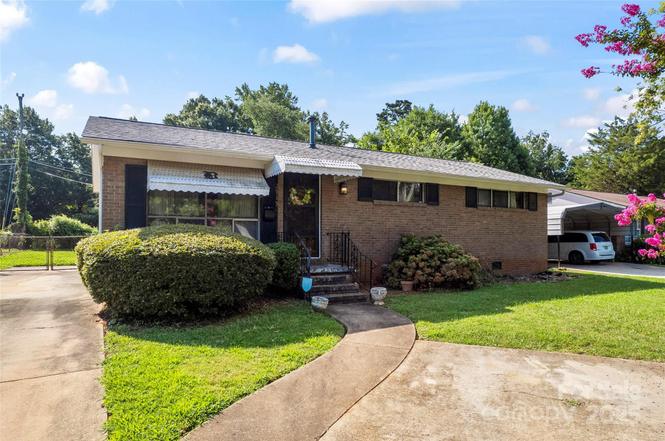
2515 Alleghany St · Charlotte, NC
Flood risk 1/10 · Minimal
- FEMA flood zone
- X (unshaded)
- Chance of flooding over 30 yrs
- 0.0%
- Est. flood insurance / yr
- $507 – $1,088
Fire risk 1/10 · Minimal
- Est. fire insurance / yr
- $906 – $1,684
Heat risk 6/10 · Moderate
- Hot days now (above 103°F)
- 7 days/yr
- Hot days in 30 yrs
- 17 days/yr
Wind risk 5/10 · Moderate
- Chance of severe wind over 30 yrs
- 25.0%
Air-quality risk 3/10 · Minor
- Unhealthy air days now
- 3 days/yr
- Unhealthy air days in 30 yrs
- 4 days/yr
Risk factors via First Street. Map © Google.
Why this score? — see what drove the D+ grade
The composite is a weighted blend of 9 inputs, each scored 0–100. Each bar is that input's sub-score; the figure is the points it added to the 100-point composite (weight × sub-score).
- ARV discount +15.0/15.0
- Cash flow +11.7/30.0
- Livability +3.9/5.0
- Schools +3.8/10.0
- DSCR +3.4/10.0
- Rent growth +2.9/5.0
- 1% rule +2.6/10.0
- Condition / age +2.5/5.0
- Appreciation +0.0/10.0
$239,000
🖨 Deal sheet 📄 Offer letter ✓ Due diligence
Listing remarks
Welcome to 2515 Alleghany Street, a 4-bedroom, 1-bath home located in the heart of Charlotte. This property offers a great opportunity for homeowners or investors looking to add their own style. With solid bones and a functional layout, the home is ready for cosmetic updates to bring a modern touch to its classic charm. Enjoy the spacious, fenced-in backyard—perfect for outdoor entertaining, pets, or gardening. Conveniently located near major highways, dining, and entertainment, this home has the potential to shine with just a little vision and creativity.
Key facts
- Entertainment
- Functional layout
- Fenced-in backyard
Tags
Neighborhood map
What this means for you Summary
Snapshot
- This is a 3-bed/1.0-bath single-family listed at $239k.
Deal economics
- At list price, monthly cash flow is $-70 ($-837/yr) — negative.
- To cash-flow at today's rent, offer at most $227k (5.2% below list).
- To meet the 1% rule (rent ≥ 1% of price), the offer needs to be $181k (24.4% below list).
- Recommended offer: $181k (24.4% below list) — sets the bar for 1% rule.
- Cap rate 5.9% vs local median 3.1% in Charlotte — top-decile yield for the area; either an underpriced asset or a hidden risk that comps aren't pricing in. Stress-test before assuming the spread holds.
Location & tenants
- Location reads 78/100 on livability (#26 in NC, #2,502 nationally) — a middle-class / working-renter tenant base. Strengths: amenities A+, commute A+, housing A+; Watch: schools D+, crime F.
- Charlotte-Mecklenburg Schools (urban): math 42% / reading 46% proficiency, ranked #85 of 178 in NC (top 48%) — families likely to look elsewhere, expect single-tenant / working-renter base with shorter leases.
- Market conditions: Rents rising (+1.5%/yr); 349 active listings in the ZIP; 40 comparable units currently listed for rent nearby; rentals at typical pace (median 17d on market — plan ~3-4 weeks tenant-placement turnaround); 11,969 units permitted in Mecklenburg County in 2024 (5,377 in 5+ unit buildings).
- This rent runs 39% of the median local income ($55k/yr) — at the standard rent-burdened threshold; future hikes will face affordability resistance.
Forward outlook
- Local home prices are declining (-3.0%/yr); year-one equity from $2k of loan paydown is wiped out by about $7k of value loss. Plan a longer hold.
- Mecklenburg County population projected at +53% by 2050 — long-run rental-demand tailwind backs the buy-and-hold thesis.
Negotiation context
- It's been on market 205 days — a 12% lower offer ($210k) is reasonable based on typical stale-listing flexibility.
- Current owner paid $12k; list at $239k implies a 1843% gain — meaningful room to come down on a strong offer.
Risks & watch-outs
- Climate carrying-cost: moderate wind risk, 25% chance of damaging wind over 30y; extreme-heat days projected 7→17/yr by 2055 (HVAC capex compounding) — expect insurance premiums to compound above CPI over the hold.
Questions for the listing agent
- What do current leases actually rent for vs. the listed asking? Can we see a recent rent roll and the last 12 months of T-12 income?
- It's been on market 205 days. Have you received any prior offers? Is the seller open to a 24% concession, seller financing, or rate buy-down credit?
- Built in 1965 — when were the roof, HVAC, electrical panel, plumbing, and water heater last replaced?
- Why hasn't it sold? Are there any deal-killer items the seller is aware of (foundation, flood, title, zoning, code violations)?
- Is there a deadline driving the sale (1031 exchange, divorce, estate, relocation)? That informs how much negotiation room exists.
- Schools are D-rated, which usually means shorter tenancies and higher turnover. Who's the typical renter profile here, and what's been the actual vacancy rate?
- Crime grade is F in this area — have there been break-ins, vandalism, or insurance claims at this property in the last 3 years? What carrier currently insures it and at what premium?
- The area grade is low — what's the realistic commute time and amenity access for the typical tenant pool here? Any planned neighborhood developments (good or bad) we should know about?
- What's the average days-on-market for RENTAL listings here right now (not sales)? A rising rental-DOM trend means longer vacancies and softer asking-rent achievability than the comps imply.
- What's the recent tenant-quality profile in this submarket — average credit score on applications, eviction rate, late-payment / NSF rate, and stable-employment percentage? A property-management company in the area should have these aggregated.
- How much new for-sale + rental construction is in the pipeline within 1–3 miles? Heavy new supply typically softens prices + rents 12–24 months out; constrained supply supports both.
Investment metrics
- 1% rule
- 0.76% ✗
- Cap rate
- 5.94%
- Cash-on-cash
- -1.25%
- DSCR
- 0.94
- GRM
- 11.0
CMA / ARV
- ARV (on-the-fly)
- $384,580
- Comps found
- 10
Show comp detail 10 sales within ~0.75 mi
| Address | Dist | Beds/Ba | Sqft | Sold | Price | $/sf | Match |
|---|---|---|---|---|---|---|---|
| 3951 Whitehall Dr | 0.22mi | 3/1.5 | 1,373 (+2%) | 10mo | $315,000 | $229 | 75 |
| 3624 Simmons St | 0.49mi | 3/1.0 | 1,398 (+4%) | 12mo | $275,000 | $197 | 60 |
| 2409 Thornton Rd | 0.13mi | 4/1.0 (+1) | 1,169 (-13%) | 11mo | $197,000 | $169 | 58 |
| 4021 Paisley Pl | 0.25mi | 3/1.0 | 1,183 (-12%) | 12mo | $339,000 | $287 | 58 |
| 3940 Bristol Dr | 0.35mi | 3/2.0 | 1,224 (-9%) | 23mo | $380,000 | $310 | 46 |
| 3216 Kempton Pl | 0.69mi | 3/2.0 | 1,375 (+3%) | 24mo | $570,000 | $415 | 40 |
| 3615 Kempton Pl | 0.62mi | 3/1.0 | 1,140 (-15%) | 9mo | $345,000 | $303 | 39 |
| 2243 Ashley Rd | 0.73mi | 3/1.0 | 1,148 (-14%) | 6mo | $330,000 | $287 | 37 |
| 2517 Pruitt St | 0.75mi | 3/2.5 | 1,462 (+9%) | 21mo | $342,900 | $235 | 27 |
| 2521 Pruitt St | 0.75mi | 3/2.5 | 1,462 (+9%) | 21mo | $340,000 | $233 | 27 |
Match score weights: distance 35% · size 25% · config 20% · recency 20%. Top-matched comps best support the ARV.
Projected returns pro-forma
-3.0% appreciation · 1.47% rent growth · sell at horizon
- IRR
- -20.0%
- Equity multiple
- 0.31×
- Total profit
- $-45,980
- Equity at exit
- $35,636
- IRR
- -16.2%
- Equity multiple
- 0.15×
- Total profit
- $-56,938
- Equity at exit
- $20,664
Cash invested: $66,920 (down + closing). Projections, not guarantees.
Landlord ↔ Tenant lean methodology
- Overall (STATE)
- 85 Strongly Landlord-Friendly
- State North Carolina
- 85 Strongly Landlord-Friendly · R+3
- County
- — inherits STATE
- City
- — inherits STATE
ZIP-level market 28208
- Home prices YoY
- -33.4%
- Rents YoY
- 1.5%
- Active inventory
- 349
- Price-to-rent
- 11.0×
Monthly cashflow live
- Estimated rent
- $1,807 high interval (Pro) →
- Mortgage (P&I)
- −$1,253
- Tax from tax record
- −$144 /mo · $1,733/yr
- Insurance
- −$100
- HOA
- −$0
- Vacancy / Maint / Mgmt
- −$379
- Net cashflow
- $-70
Break-even live
UW: 25.0% down · 7.5% · 30yr · 1.5% tax · 5.0% vac · 8.0% maint · 8.0% mgmt
Financing live
Cash to close
- Down payment
- $59,750
- Closing costs
- $7,170
- Reserves months
- —
- Total cash needed
- —
Loan-product check · same deal, 3 products live
Conventional
25% down · 7.5% · 30yr
- Down + closing
- —
- Monthly P&I
- —
- Monthly cashflow
- —
- DSCR
- —
- Eligible?
- —
Personal DTI + credit; lowest rate.
DSCR
20% down · 8.5% · 30yr
- Down + closing
- —
- Monthly P&I
- —
- Monthly cashflow
- —
- DSCR
- —
- Eligible?
- —
No personal income docs; deal must DSCR.
Hard money
10% down · 12.0% · 12mo
- Down + closing
- —
- Monthly P&I
- —
- Monthly cashflow
- —
- DSCR
- —
- Eligible?
- —
Short-term bridge; refi at stabilization.
Rent comps 40 comps
| Address | Beds | Baths | Sqft | Rent | $/sqft | DOM | Units | Dist |
|---|---|---|---|---|---|---|---|---|
| 2620 Thornton Rd Charlotte, NC | 3.0 | 1.0 | 989 | $1,595 | $1.61 | 5d | 1 | 0.13mi |
| 2515 Thornton Rd Charlotte, NC | 2.0 | 2.0 | 935 | $1,795 | $1.92 | 18d | 1 | 0.13mi |
| 2607 Thornton Rd Charlotte, NC | 3.0 | 1.0 | 950 | $1,300 | $1.37 | 3d | 1 | 0.14mi |
| 2715 Sonora Ln Charlotte, NC | 3.0 | 1.0 | 950 | $1,900 | $2.00 | 24d | 1 | 0.18mi |
| 4201 Carlyle Dr Charlotte, NC | 3.0 | 1.0 | 1080 | $1,310 | $1.21 | 24d | 1 | 0.26mi |
| 5025 Taggart Springs Way Charlotte, NC | 1.0–3.0 | 1.0–2.0 | 1087 | $1,593 | $1.46 | 24d | 1 | 0.29mi |
| 5025 Taggart Springs Way Charlotte, NC | 1.0–3.0 | 1.0–2.0 | 1087 | $1,593 | $1.46 | 2d | 22 | 0.29mi |
| 3731 Bullard St Charlotte, NC | 3.0 | 2.5 | 1506 | $1,850 | $1.23 | 8d | 1 | 0.40mi |
| 4413 Wymore Way Charlotte, NC | 3.0 | 2.5 | 1700 | $2,100 | $1.24 | 16d | 1 | 0.40mi |
| 1910 Bromwich Rd Unit A Charlotte, NC | 3.0 | 2.0 | 1268 | $1,950 | $1.54 | 16d | 1 | 0.46mi |
| 3609 Corbett St Charlotte, NC | 3.0 | 2.5 | 1700 | $2,225 | $1.31 | 16d | 1 | 0.54mi |
| 2012 Ashley Rd Charlotte, NC | 3.0 | 2.0 | 1642 | $2,400 | $1.46 | 4d | 1 | 0.61mi |
| 2026 Ashley Rd Charlotte, NC | 3.0 | 1.0 | 1600 | $1,575 | $0.98 | 24d | 1 | 0.62mi |
| 3251 Dannelly Towns Aly Charlotte, NC | 3.0 | 3.5 | 1500 | $2,150 | $1.43 | 8d | 1 | 0.65mi |
| 2315 Deherradora Ave Charlotte, NC | 4.0 | 2.0 | 1015 | $2,100 | $2.07 | 24d | 1 | 0.66mi |
| 2930 Tacoma St Charlotte, NC | 1.0–3.0 | 1.0–2.0 | 997 | $1,625 | $1.63 | 24d | 1 | 0.70mi |
| 4915 Magnasco Ln Charlotte, NC | 3.0 | 2.0 | 1440 | $1,789 | $1.24 | 16d | 1 | 0.71mi |
| 3500 Blessing St Charlotte, NC | 2.0 | 2.0 | 1042 | $1,050 | $1.01 | 8d | 1 | 0.75mi |
| 2516 Reid Oaks Dr Charlotte, NC | 3.0 | 2.5 | 1722 | $1,910 | $1.11 | 16d | 1 | 0.80mi |
| 2423 Shad Ct Charlotte, NC | 4.0 | 2.0 | 1488 | $1,919 | $1.29 | 3d | 1 | 0.86mi |
| 2648 Reid Park Ln Charlotte, NC | 3.0 | 2.5 | 1328 | $1,880 | $1.42 | 8d | 1 | 0.87mi |
| 1840 J Julian Ln Unit A Charlotte, NC | 2.0 | 2.0 | 968 | $1,425 | $1.47 | 16d | 1 | 0.90mi |
| 2322 Belfast Dr Charlotte, NC | 3.0 | 1.0 | 1260 | $1,375 | $1.09 | 8d | 1 | 0.90mi |
| 1831 J Julian Ln Charlotte, NC | 2.0 | 2.0 | 968 | $1,575 | $1.63 | 5d | 1 | 0.90mi |
| 4929 Arborwood Dr Charlotte, NC | 1.0–2.0 | 1.0–1.5 | 916 | $1,388 | $1.52 | 2d | 21 | 0.92mi |
| 1832 J Julian Ln Unit D Charlotte, NC | 2.0 | 2.0 | 972 | $1,299 | $1.34 | 15d | 1 | 0.92mi |
| 3201 Dublin Rd Charlotte, NC | 2.0 | 1.0 | 1050 | $1,600 | $1.52 | 24d | 1 | 0.94mi |
| 5109 Tuckaseegee Rd Charlotte, NC | 3.0 | 2.0 | 1689 | $2,080 | $1.23 | 8d | 1 | 0.97mi |
| 2962 Sloan Dr Charlotte, NC | 3.0 | 2.5 | 1456 | $1,800 | $1.24 | 4d | 1 | 0.98mi |
| 3021 Seymour Dr Charlotte, NC | 4.0 | 2.0 | 1280 | $1,685 | $1.32 | 16d | 1 | 1.02mi |
| 2906 Sloan Dr Charlotte, NC | 3.0 | 2.5 | 1462 | $2,950 | $2.02 | 24d | 1 | 1.03mi |
| 3035 Kingsfield Rd Charlotte, NC | 3.0 | 2.5 | 1700 | $2,250 | $1.32 | 5d | 1 | 1.03mi |
| 3021 Kingsfield Rd Charlotte, NC | 3.0 | 2.5 | 1697 | $2,195 | $1.29 | 18d | 1 | 1.04mi |
| 5533 Whistlewood Ln Charlotte, NC | 3.0 | 2.5 | 1684 | $2,165 | $1.29 | 5d | 1 | 1.06mi |
| 5945 Tuckaseegee Rd Charlotte, NC | 1.0–2.0 | 1.0–2.0 | 806 | $1,331 | $1.65 | 16d | 1 | 1.12mi |
| 2719 Capitol Dr Charlotte, NC | 3.0 | 2.5 | 1567 | $2,100 | $1.34 | 24d | 1 | 1.15mi |
| 2811 Marlowe Ave Charlotte, NC | 1.0–3.0 | 1.0 | 820 | $1,525 | $1.86 | 2d | 23 | 1.22mi |
| 2019 Highland St Charlotte, NC | 3.0 | 2.0 | 1100 | $2,100 | $1.91 | 8d | 1 | 1.31mi |
| 2231 Gooseberry Rd Charlotte, NC | 3.0 | 2.5 | 1700 | $1,870 | $1.10 | 3d | 1 | 1.35mi |
| 1320 Thomasboro Dr Unit 4 Charlotte, NC | 2.0 | 1.5 | 958 | $1,150 | $1.20 | 24d | 1 | 1.37mi |
Listing history 7 events
-
2026-02-18status Pending
-
2025-10-15price $239,000
-
2025-09-30price $249,000
-
2025-09-03price $255,000
-
2025-08-12price $259,000
-
2025-07-28$269,000 Active
-
1971-09-01soldstatus $12,300
ⓘ Source: listings_history table (triggers on properties + properties_extension) + one-shot
backfill from property_details.listing_events for pre-trigger history.
Tax reassessment forecast NC · Resets to sale price
- Current annual tax
- $1,733 · $144/mo
- Projected year-2 tax
- $1,960 · $163/mo
- Expected delta
- +$227/yr (+$19/mo · 13.1%)
ⓘ Screening estimate from a state-policy table — verify with the county assessor before closing.
Climate risk First Street
- Flood 1/10 Low FEMA zone X (unshaded) · 0% chance over 30 yrs
- Wildfire 1/10 Low
- Heat 6/10 Major 7 d/yr ≥103°F today · 17 d/yr by 30 yrs out
- Wind 5/10 Major 25% chance of damaging wind over 30 yrs
- Air quality 3/10 Moderate 3 unhealthy d/yr today · 4 by 30 yrs out
Nearby sold comps map
Loading sold comps map…
Walkable amenities ~0.75 mi
Loading nearby amenities…
Taxation est. · year 1
- Rental income
- $21,685
- − Mortgage interest
- −$13,388
- − Property taxes
- −$1,733
- − Insurance
- −$1,195
- − Repairs & maintenance
- −$1,735
- − Management
- −$1,735
- − Depreciation
- −$6,953
- Taxable loss
- −$5,053
- Est. tax savings @ 24.0%
- +$1,213
- After-tax cash flow
- $376/yr
For passive investors: Depreciation is non-cash, so a rental often shows a tax loss while cash-flowing — sheltering income. Rental losses are passive: they offset passive income freely, and up to $25,000/yr can offset ordinary (W-2) income if you actively participate and your MAGI is under $100k (phasing out to $0 by $150k); unused losses carry forward. On sale, claimed depreciation is recaptured at up to 25%, and gains may owe capital-gains tax (a 1031 exchange can defer both). Figures are a year-1 estimate at your 24.0% rate — not tax advice; consult a CPA.
Schools (NCES district)
- District
- Charlotte-Mecklenburg Schools
- NCES district ID
- 3702970
- Math proficiency
- 42% ▼ -6.00%
- Reading proficiency
- 46% ▲ 1.00%
- Median HH income
- $57,175
- Composite
- 38.49/100
- National rank
- #4183
- State rank
- #85 of 178 in NC
Livability — Charlotte
- Score
- 78/100
- State rank
- #26
- US rank
- #2502
Category grades
Schools grade is shown separately in the Schools card above.
Census & demographics
- Census place
- Charlotte, NC
- County
- Mecklenburg County · 1,167,319 people
- City population
- 920,422
- Metro
- Charlotte-Concord-Gastonia, NC-SC
- Population (ZIP)
- 40,197
- Household income
- $55,431
- Rent vs Own
- Severe rent burden
- 2368.0
Population outlook (Mecklenburg County) Hauer SSP2
- Today (2025)
- 1,305,740 people
- By 2030
- 1,442,752 · +10.5%
- By 2040
- 1,722,441 · +31.9%
- By 2050
- 1,999,450 · +53.1%
- By 2075
- 2,642,495 · +102.4%
- By 2100
- 3,106,755 · +137.9%
Race, ethnicity, and origin ACS 2023
- Neighborhood character
- Diverse neighborhood (Simpson 0.57)
- Race & ethnicity
- Black 61% White 16% Hispanic / Latino 14% Two or more races 6% Asian 4%
- Hispanic origin (detail)
- Mexican 5%
- Common ancestry
- Italian 1%
- Foreign-born
- 11% · Canada, Vietnam, China
- Languages at home
- 83% English-only · Spanish 12% Other Asian/Pacific 1% French/Haitian/Cajun 1%
Political lean MEDSL · Mecklenburg
- 2024 margin
- Solid D (+32.9) · D 65.6% · R 32.7% · Other 1.6%
- 2008→2024 swing
- +8.5pp toward D · 2008: 24.4pp · 2024: 32.9pp
- All cycles
- 2024: D+32.9 2020: D+35.1 2016: D+29.9 2012: D+22.5 2008: D+24.4
Not yet ingested
- Civics
- —
Market trends
- HPI YoY
- ▼ -162.76%
- Current HPI
- 324.3642
- Rent YoY
- ▲ 1.47%
- Metro
- Charlotte-Concord-Gastonia, NC-SC
- State GDP YoY
- ▲ 3.28%
- F500 in state
- 26
Industry mix (Fortune 500 HQ in NC)
| Industry | F500 HQs | Revenue |
|---|---|---|
| Financial Services | 2 | $213B |
|
||
| Retail | 2 | $95B |
|
||
| Industrial Conglomerate | 1 | $38B |
|
||
| Metals / Steel | 1 | $35B |
|
||
| Utilities | 1 | $30B |
|
||
| Industrial Machinery | 1 | $19B |
|
||
Price history
+1843.1% since first listed7 events — show timeline
- 2026-02-18 Pending — CANOPYMLS as Distributed by MLS Grid
- 2025-10-15 Price Changed $239,000 CANOPYMLS as Distributed by MLS Grid
- 2025-09-30 Price Changed $249,000 CANOPYMLS as Distributed by MLS Grid
- 2025-09-03 Price Changed $255,000 CANOPYMLS as Distributed by MLS Grid
- 2025-08-12 Price Changed $259,000 CANOPYMLS as Distributed by MLS Grid
- 2025-07-28 Listed $269,000 CANOPYMLS as Distributed by MLS Grid
- 1971-09-01 Sold (Public Records) $12,300 Public Records
Property tax history
+3.9%/yrLatest (2025): $1,733 · +2.4% YoY. Source: county tax records.
Cash-flow waterfall
monthlySold comps — $/sqft
last 12 mo · ≤1 miLoading sold comps…