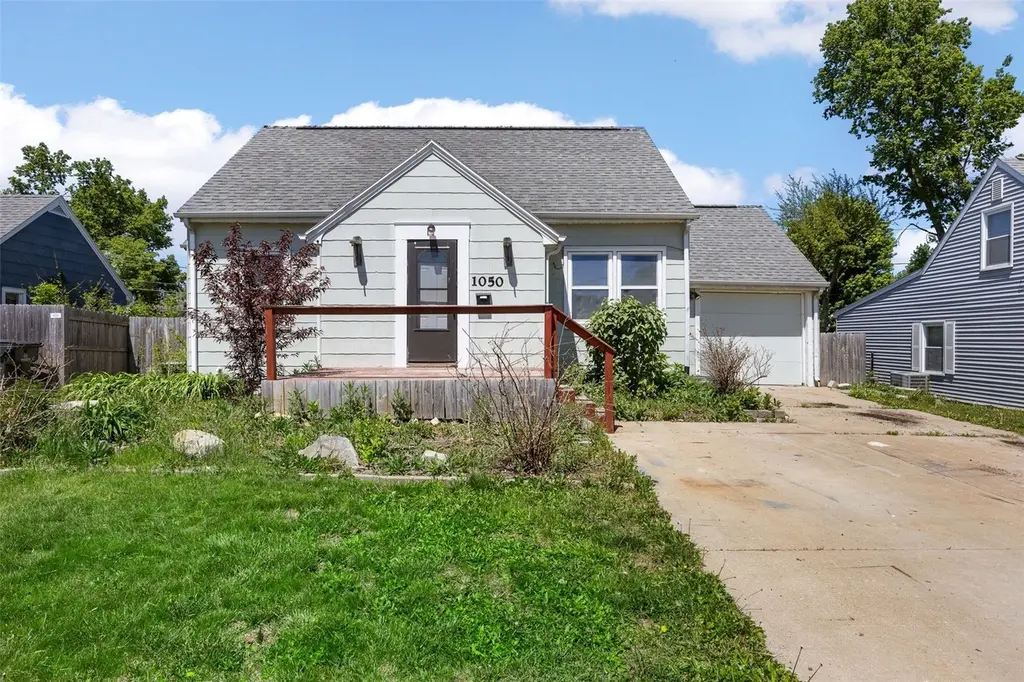
1050 27th Street St NE · Cedar Rapids, IA
Flood risk 6/10 · Moderate
- FEMA flood zone
- X (unshaded)
- Chance of flooding over 30 yrs
- 0.74%
- Est. flood insurance / yr
- $473 – $860
Fire risk 3/10 · Minor
- Est. fire insurance / yr
- $902 – $1,676
Heat risk 3/10 · Minor
- Hot days now (above 104°F)
- 7 days/yr
- Hot days in 30 yrs
- 15 days/yr
Wind risk 2/10 · Minimal
- Chance of severe wind over 30 yrs
- —
Air-quality risk 2/10 · Minimal
- Unhealthy air days now
- 1 days/yr
- Unhealthy air days in 30 yrs
- 2 days/yr
Risk factors via First Street. Map © Google.
Why this score? — see what drove the C+ grade
The composite is a weighted blend of 9 inputs, each scored 0–100. Each bar is that input's sub-score; the figure is the points it added to the 100-point composite (weight × sub-score).
- Cash flow +18.6/30.0
- ARV discount +15.0/15.0
- 1% rule +5.9/10.0
- DSCR +5.8/10.0
- Rent growth +5.0/5.0
- Schools +4.7/10.0
- Livability +3.9/5.0
- Condition / age +2.5/5.0
- Appreciation +0.0/10.0
$125,000
🖨 Deal sheet 📄 Offer letter ✓ Due diligence
Listing remarks MLS
Accepted offer, subject to financing. Opportunity knocks with this charming 1.5-story fixer upper! Featuring 2 bedrooms and 1 bathroom, this home is full of potential and ready for your personal touch. A great opportunity for investors, first-time buyers, or anyone looking to build equity with a little TLC. Conveniently located close to downtown and nearby schools, this property offers both location and possibility. Don’t miss the chance to make it your own!
Key facts
- Close to downtown
- Nearby schools
- 9,148 sq ft lot
Tags
Property features AI
Finance
- HOA & community: Association fee paid annually
Exterior
- Parking: Attached garage with space for 1 vehicle
- Utilities: Public water; Public sewer; Cable available
- Home design: Single-family residence; One story
- Construction: Vinyl siding with frame construction
- Exterior features: Deck; Street lights in the community
Interior
- Bathrooms: 1 full bathroom
- Heating & cooling: Central air conditioning; Electric, forced air and natural gas heating
- Interior features: Full unfinished basement; No fireplace; No appliances included
Neighborhood map
What this means for you Summary
Snapshot
- This is a 3-bed/1.0-bath single-family listed at $125k.
Deal economics
- At list price, monthly cash flow is $120 ($1k/yr) — positive.
- The deal already cash-flows at list — no discount required.
- Meets the 1% rule at list price ($1k rent vs $125k).
- Cap rate 7.4% vs local median 3.5% in Cedar Rapids — top-decile yield for the area; either an underpriced asset or a hidden risk that comps aren't pricing in. Stress-test before assuming the spread holds.
Location & tenants
- Location reads 78/100 on livability (#134 in IA, #2,474 nationally) — a middle-class / working-renter tenant base. Strengths: cost of living A+, housing A+, health & safety A+; Watch: crime C-, commute F.
- Cedar Rapids Community School District (urban): math 50% / reading 59% proficiency, ranked #265 of 289 in IA (top 92%) — acceptable for families but not a draw, mixed tenant base, ~2y average lease.
- Zoned schools: Franklin Middle School (math 49% / reading 59%, grade B-, #206 of 246 statewide, top 84%, 537 students, 56% FRL); George Washington High School (math 44% / reading 62%, grade C-, #296 of 336 statewide, top 88%, 1,291 students, 49% FRL).
- Market conditions: Rents rising fast (+11.0%/yr); 286 active listings in the ZIP; 5 comparable units currently listed for rent nearby; rentals lingering (median 44d on market — plan ~5-8 weeks vacancy on turnover, expect pricing pressure); 60% of comp listings sitting > 30 days — soft ceiling on asking rent; 1,023 units permitted in Linn County in 2024 (456 in 5+ unit buildings).
Forward outlook
- Local home prices are declining (-3.0%/yr); year-one equity from $864 of loan paydown is wiped out by about $4k of value loss. Plan a longer hold.
- Linn County population projected at +16% by 2050 — long-run rental-demand tailwind backs the buy-and-hold thesis.
- At projected returns (-3.0% appreciation + 8.0% rent growth), your $35k cash investment doubles in ~9 years — after that, you're playing with house money.
Negotiation context
- Only 5 days on market — expect competitive offers; lowballing is unlikely to land.
- 2 sale attempts with the ask held roughly flat each time — persistent listings suggest the price (not the market) is what's stuck; bring a comps-based counter.
Risks & watch-outs
- Watch-outs: built in 1947 — expect roof / HVAC / electrical / plumbing capex.
- Climate carrying-cost: major flood risk — expect insurance premiums to compound above CPI over the hold.
Questions for the listing agent
- Built in 1947 — when were the roof, HVAC, electrical panel, plumbing, and water heater last replaced?
- Is there a deadline driving the sale (1031 exchange, divorce, estate, relocation)? That informs how much negotiation room exists.
- Schools are B-rated — typically a magnet for longer-tenancy family renters. What's the average tenant stay here, and is there a school-zone premium baked into asking?
- What's the average days-on-market for RENTAL listings here right now (not sales)? A rising rental-DOM trend means longer vacancies and softer asking-rent achievability than the comps imply.
- What's the recent tenant-quality profile in this submarket — average credit score on applications, eviction rate, late-payment / NSF rate, and stable-employment percentage? A property-management company in the area should have these aggregated.
- How much new for-sale + rental construction is in the pipeline within 1–3 miles? Heavy new supply typically softens prices + rents 12–24 months out; constrained supply supports both.
Investment metrics
- 1% rule
- 1.09% ✓
- Cap rate
- 7.45%
- Cash-on-cash
- 4.12%
- DSCR
- 1.18
- GRM
- 7.6
CMA / ARV
- ARV (median comp)
- $187,820
- List price
- $125,000
- Delta
- -33.45%
- Verdict
- UNDERPRICED
- Comps
- 20 within 1.0 mi
Show comp detail 12 sales within ~0.75 mi
| Address | Dist | Beds/Ba | Sqft | Sold | Price | $/sf | Match |
|---|---|---|---|---|---|---|---|
| 1621 Oakland Road Rd NE | 0.54mi | 3/1.5 | 1,372 (-1%) | 0mo | $228,500 | $167 | 70 |
| 1024 Staub Ct NE | 0.12mi | 3/2.0 | 1,578 (+13%) | 1mo | $190,000 | $120 | 67 |
| 642 Prairie Dr NE | 0.37mi | 4/2.0 (+1) | 1,469 (+6%) | 1mo | $210,000 | $143 | 64 |
| 2522 A Ave NE | 0.69mi | 3/1.5 | 1,353 (-3%) | 1mo | $183,500 | $136 | 60 |
| 1205 33rd St NE | 0.39mi | 3/1.0 | 1,186 (-15%) | 1mo | $21,000 | $18 | 56 |
| 1614 J Ave NE | 0.53mi | 2/1.0 (-1) | 1,205 (-13%) | 0mo | $170,000 | $141 | 47 |
| 336 21st St NE | 0.67mi | 4/1.0 (+1) | 1,524 (+10%) | 1mo | $191,000 | $125 | 47 |
| 2906 Russell Dr NE | 0.57mi | 4/1.5 (+1) | 1,568 (+13%) | 0mo | $205,000 | $131 | 45 |
| 311 22nd St St NE | 0.71mi | 4/2.0 (+1) | 1,510 (+8%) | 1mo | $205,000 | $136 | 43 |
| 419 21st St NE | 0.62mi | 4/2.0 (+1) | 1,547 (+11%) | 1mo | $205,000 | $133 | 43 |
| 231 32nd St St NE | 0.66mi | 4/1.5 (+1) | 1,550 (+11%) | 1mo | $195,000 | $126 | 42 |
| 203 NE 27th St | 0.69mi | 2/1.0 (-1) | 1,200 (-14%) | 2mo | $162,800 | $136 | 38 |
Match score weights: distance 35% · size 25% · config 20% · recency 20%. Top-matched comps best support the ARV.
Projected returns pro-forma
-3.0% appreciation · 8.0% rent growth · sell at horizon
- IRR
- -3.8%
- Equity multiple
- 0.85×
- Total profit
- $-5,312
- Equity at exit
- $18,638
- IRR
- 11.2%
- Equity multiple
- 2.10×
- Total profit
- $38,368
- Equity at exit
- $10,808
Cash invested: $35,000 (down + closing). Projections, not guarantees.
Landlord ↔ Tenant lean methodology
- Overall (STATE)
- 83 Strongly Landlord-Friendly
- State Iowa
- 83 Strongly Landlord-Friendly · R+6
- County
- — inherits STATE
- City
- — inherits STATE
ZIP-level market 52402
- Rents YoY
- 11.0%
- Active inventory
- 286
- Price-to-rent
- 7.6×
Monthly cashflow live
- Estimated rent
- $1,364 high interval (Pro) →
- Mortgage (P&I)
- −$656
- Tax from tax record
- −$250 /mo · $3,002/yr
- Insurance
- −$52
- HOA
- −$0
- Vacancy / Maint / Mgmt
- −$287
- Net cashflow
- $120
Break-even live
UW: 25.0% down · 7.5% · 30yr · 1.5% tax · 5.0% vac · 8.0% maint · 8.0% mgmt
Financing live
Cash to close
- Down payment
- $31,250
- Closing costs
- $3,750
- Reserves months
- —
- Total cash needed
- —
Loan-product check · same deal, 3 products live
Conventional
25% down · 7.5% · 30yr
- Down + closing
- —
- Monthly P&I
- —
- Monthly cashflow
- —
- DSCR
- —
- Eligible?
- —
Personal DTI + credit; lowest rate.
DSCR
20% down · 8.5% · 30yr
- Down + closing
- —
- Monthly P&I
- —
- Monthly cashflow
- —
- DSCR
- —
- Eligible?
- —
No personal income docs; deal must DSCR.
Hard money
10% down · 12.0% · 12mo
- Down + closing
- —
- Monthly P&I
- —
- Monthly cashflow
- —
- DSCR
- —
- Eligible?
- —
Short-term bridge; refi at stabilization.
Rent comps 5 comps
| Address | Beds | Baths | Sqft | Rent | $/sqft | DOM | Units | Dist |
|---|---|---|---|---|---|---|---|---|
| 1127 34th St NE Cedar Rapids, IA | 3.0 | 2.0 | 1152 | $1,385 | $1.20 | 43d | 1 | 0.47mi |
| 511 23rd St NE Cedar Rapids, IA | 2.0 | 1.0 | 888 | $1,500 | $1.69 | 43d | 1 | 0.55mi |
| 306 29th Street Dr SE Cedar Rapids, IA | 2.0 | 1.0 | 1100 | $850 | $0.77 | 20d | 1 | 0.95mi |
| 1220 Sierra Dr NE Cedar Rapids, IA | 1.0–2.0 | 1.0–2.0 | 985 | $1,000 | $1.02 | 43d | 1 | 1.00mi |
| 4025 Sherman St NE Cedar Rapids, IA | 1.0–2.0 | 1.0–1.5 | 742 | $1,083 | $1.46 | 13d | 1 | 1.11mi |
Listing history 8 events
-
2026-05-18status Pending 460-char remark
Show marketing remark (468 chars)
Accepted offer, subject to financing. Opportunity knocks with this charming 1.5-story fixer upper! Featuring 2 bedrooms and 1 bathroom, this home is full of potential and ready for your personal touch. A great opportunity for investors, first-time buyers, or anyone looking to build equity with a little TLC. Conveniently located close to downtown and nearby schools, this property offers both location and possibility. Don’t miss the chance to make it your own!
-
2026-05-18status Pending 468-char remark
Show marketing remark (468 chars)
Accepted offer, subject to financing. Opportunity knocks with this charming 1.5-story fixer upper! Featuring 2 bedrooms and 1 bathroom, this home is full of potential and ready for your personal touch. A great opportunity for investors, first-time buyers, or anyone looking to build equity with a little TLC. Conveniently located close to downtown and nearby schools, this property offers both location and possibility. Don’t miss the chance to make it your own!
-
2026-05-13$125,000 Active 468-char remark
Show marketing remark (468 chars)
Accepted offer, subject to financing. Opportunity knocks with this charming 1.5-story fixer upper! Featuring 2 bedrooms and 1 bathroom, this home is full of potential and ready for your personal touch. A great opportunity for investors, first-time buyers, or anyone looking to build equity with a little TLC. Conveniently located close to downtown and nearby schools, this property offers both location and possibility. Don’t miss the chance to make it your own!
-
2026-05-13$125,000 Active 460-char remark
Show marketing remark (468 chars)
Accepted offer, subject to financing. Opportunity knocks with this charming 1.5-story fixer upper! Featuring 2 bedrooms and 1 bathroom, this home is full of potential and ready for your personal touch. A great opportunity for investors, first-time buyers, or anyone looking to build equity with a little TLC. Conveniently located close to downtown and nearby schools, this property offers both location and possibility. Don’t miss the chance to make it your own!
-
2013-05-31soldstatus $124,000
-
2012-07-16soldstatus $124,000
-
2012-07-12soldstatus $119,000
-
2004-07-23soldstatus $92,000
ⓘ Source: listings_history table (triggers on properties + properties_extension) + one-shot
backfill from property_details.listing_events for pre-trigger history.
Tax reassessment forecast IA · Partial reset (capped growth)
- Current annual tax
- $3,002 · $250/mo
- Projected year-2 tax
- $3,002 · $250/mo
- Expected delta
- $0/yr ($0/mo · 0.0%)
ⓘ Screening estimate from a state-policy table — verify with the county assessor before closing.
Climate risk First Street
- Flood 6/10 Major FEMA zone X (unshaded) · 74% chance over 30 yrs
- Wildfire 3/10 Moderate
- Heat 3/10 Moderate 7 d/yr ≥104°F today · 15 d/yr by 30 yrs out
- Wind 2/10 Low
- Air quality 2/10 Low 1 unhealthy d/yr today · 2 by 30 yrs out
Nearby sold comps map
Loading sold comps map…
Walkable amenities ~0.75 mi
Loading nearby amenities…
Taxation est. · year 1
- Rental income
- $16,374
- − Mortgage interest
- −$7,002
- − Property taxes
- −$3,002
- − Insurance
- −$625
- − Repairs & maintenance
- −$1,310
- − Management
- −$1,310
- − Depreciation
- −$3,636
- Taxable loss
- −$511
- Est. tax savings @ 24.0%
- +$123
- After-tax cash flow
- $1,565/yr
For passive investors: Depreciation is non-cash, so a rental often shows a tax loss while cash-flowing — sheltering income. Rental losses are passive: they offset passive income freely, and up to $25,000/yr can offset ordinary (W-2) income if you actively participate and your MAGI is under $100k (phasing out to $0 by $150k); unused losses carry forward. On sale, claimed depreciation is recaptured at up to 25%, and gains may owe capital-gains tax (a 1031 exchange can defer both). Figures are a year-1 estimate at your 24.0% rate — not tax advice; consult a CPA.
Schools (NCES district)
- District
- Cedar Rapids Community School District
- NCES district ID
- 1906540
- Math proficiency
- 50% ▼ -12.00%
- Reading proficiency
- 59% ▼ -6.00%
- Median HH income
- $53,568
- Composite
- 46.82/100
- National rank
- #2378
- State rank
- #265 of 289 in IA
Livability — Cedar Rapids
- Score
- 78/100
- State rank
- #134
- US rank
- #2474
Category grades
Schools grade is shown separately in the Schools card above.
Census & demographics
- Census place
- Cedar Rapids, IA
- County
- Linn County · 179,860 people
- City population
- 137,154
- Metro
- Cedar Rapids, IA
- Population (ZIP)
- 42,938
- Household income
- $73,439
- Rent vs Own
- Severe rent burden
- 971.0
Population outlook (Linn County) Hauer SSP2
- Today (2025)
- 239,589 people
- By 2030
- 248,587 · +3.8%
- By 2040
- 264,817 · +10.5%
- By 2050
- 278,685 · +16.3%
- By 2075
- 311,754 · +30.1%
- By 2100
- 336,773 · +40.6%
Race, ethnicity, and origin ACS 2023
- Neighborhood character
- Predominantly White (77%)
- Race & ethnicity
- White 77% Two or more races 7% Black 6% Asian 6% Hispanic / Latino 4%
- Common ancestry
- Portuguese 4% Lithuanian 2% Iranian 2%
- Foreign-born
- 8% · Canada, Philippines, China
- Languages at home
- 89% English-only · Spanish 3% Other Indo-European 3% Other Asian/Pacific 2%
Political lean MEDSL · Linn
- 2024 margin
- Lean D (+9.9) · D 54.2% · R 44.3% · Other 1.4%
- 2008→2024 swing
- -11.6pp toward R · 2008: 21.5pp · 2024: 9.9pp
- All cycles
- 2024: D+9.9 2020: D+13.7 2016: D+9.0 2012: D+17.6 2008: D+21.5
Not yet ingested
- Civics
- —
Market trends
- HPI YoY
- ▼ -133.31%
- Current HPI
- 201.7061
- Rent YoY
- ▲ 10.97%
- Metro
- Cedar Rapids, IA
- State GDP YoY
- ▲ 2.48%
- F500 in state
- 4
Industry mix (Fortune 500 HQ in IA)
| Industry | F500 HQs | Revenue |
|---|---|---|
| Financial Services | 1 | $16B |
|
||
| Retail / Convenience | 1 | $15B |
|
||
Price history
+35.9% since first listed8 events — show timeline
- 2026-05-18 Pending — ICAARMLS
- 2026-05-18 Pending — CRAAR, CDRMLS
- 2026-05-13 Listed $125,000 CRAAR, CDRMLS
- 2026-05-13 Listed $125,000 ICAARMLS
- 2013-05-31 Sold (Public Records) $124,000 Public Records
- 2012-07-16 Sold (Public Records) $124,000 Public Records
- 2012-07-12 Sold (Public Records) $119,000 Public Records
- 2004-07-23 Sold (Public Records) $92,000 Public Records
Property tax history
+1.5%/yrLatest (2025): $3,002 · +6.0% YoY. Source: county tax records.
Cash-flow waterfall
monthlySold comps — $/sqft
last 12 mo · ≤1 miLoading sold comps…