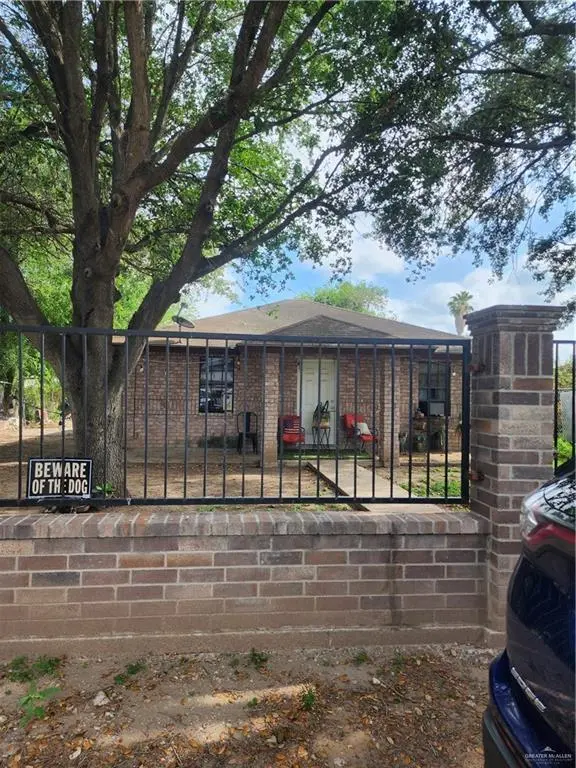
1416 Paseo Del Sol St · North Alamo, TX
Flood risk 1/10 · Minimal
- FEMA flood zone
- X (shaded)
- Chance of flooding over 30 yrs
- 0.0%
- Est. flood insurance / yr
- $507 – $1,088
Fire risk 3/10 · Minor
- Est. fire insurance / yr
- $1,222 – $2,270
Heat risk 9/10 · Severe
- Hot days now (above 111°F)
- 7 days/yr
- Hot days in 30 yrs
- 23 days/yr
Wind risk 8/10 · Major
- Chance of severe wind over 30 yrs
- 99.0%
Air-quality risk 1/10 · Minimal
- Unhealthy air days now
- 0 days/yr
- Unhealthy air days in 30 yrs
- 0 days/yr
Risk factors via First Street. Map © Google.
Why this score? — see what drove the C- grade
The composite is a weighted blend of 9 inputs, each scored 0–100. Each bar is that input's sub-score; the figure is the points it added to the 100-point composite (weight × sub-score).
- Cash flow +17.8/30.0
- ARV discount +15.0/15.0
- DSCR +5.6/10.0
- 1% rule +4.9/10.0
- Livability +3.1/5.0
- Rent growth +2.5/5.0
- Condition / age +2.5/5.0
- Schools +2.0/10.0
- Appreciation +0.0/10.0
$120,000
🖨 Deal sheet 📄 Offer letter ✓ Due diligence
Listing remarks
WILL BE AVAILABLE TO SHOW JUNE 1ST. Great location on 495 and Cesar Chaves. 2-bedroom, 1 bath, well-kept brick home, tile floors. With a/c units, does not have central a/c.
Key facts
- Tile floors
- Great location
- 6,469 sq ft lot
Tags
Property features AI
Finance
- Other: Building area reported as 896 square feet; Lot reported as approximately 0.1485 acres (6,469 sq ft)
- Financial info: Escrow information provided
- HOA & community: No homeowners association
Exterior
- Parking: No garage or carport
- Security: Electric fencing
- Utilities: Public water; City sewer; Water available
- Home design: Brick construction; Composition shingle roof; Slab foundation
- Construction: Brick construction; Slab foundation; Composition shingle roof
- Exterior features: Electric fencing; Masonry fencing; Privacy fencing; Mature trees; Paved road access
Interior
- Kitchen: Electric water heater; No conveying appliances
- Bedrooms: Living area includes bedroom spaces
- Flooring: Tile
- Bathrooms: 1 full bathroom
- Heating & cooling: Window unit cooling
- Interior features: Tile flooring; Mini blinds; Countertops (other)
- Laundry & utility: Dedicated laundry room; Washer/dryer connection
Neighborhood map
What this means for you Summary
Snapshot
- This is a 2-bed/1.0-bath single-family listed at $120k.
Deal economics
- At list price, monthly cash flow is $98 ($1k/yr) — positive.
- The deal already cash-flows at list — no discount required.
- To meet the 1% rule (rent ≥ 1% of price), the offer needs to be $119k (1.2% below list).
- Recommended offer: $116k (3.0% below list) — sets the bar for market timing.
Location & tenants
- Location reads 62/100 on livability (#941 in TX) — a middle-class / working-renter tenant base. Strengths: cost of living A+, housing A+; Watch: employment C-, amenities F, commute F.
- Pharr-San Juan-Alamo ISD (suburban): math 18% / reading 30% proficiency, ranked #740 of 826 in TX (top 90%) — low school quality limits family demand, transient renter base, plan for 1-2y turnover; 72% free/reduced lunch — lower-income household profile, screen leases tightly.
- Zoned schools: Santos Livas El (math 12% / reading 22%, grade F, #3,836 of 4,322 statewide, top 91%, 527 students, 90% FRL); Audie Murphy Middle (math 13% / reading 22%, grade F, #1,507 of 1,662 statewide, top 91%, 787 students, 95% FRL) — zoned schools average 93% FRL vs 72% district-wide (21 pts higher); higher-poverty schools than district average — tighter screening recommended.
- Market conditions: 350 active listings in the ZIP; 32 comparable units currently listed for rent nearby; rentals lingering (median 44d on market — plan ~5-8 weeks vacancy on turnover, expect pricing pressure); 62% of comp listings sitting > 30 days — soft ceiling on asking rent; 7,378 units permitted in Hidalgo County in 2024 (641 in 5+ unit buildings).
Forward outlook
- Local home prices are declining (-3.0%/yr); year-one equity from $830 of loan paydown is wiped out by about $4k of value loss. Plan a longer hold.
- Hidalgo County population projected at +28% by 2050 — long-run rental-demand tailwind backs the buy-and-hold thesis.
Negotiation context
- It's been on market 38 days — a 3% lower offer ($116k) is reasonable based on typical stale-listing flexibility.
Risks & watch-outs
- Climate carrying-cost: severe wind risk, 99% chance of damaging wind over 30y; extreme-heat days projected 7→23/yr by 2055 (HVAC capex compounding) — expect insurance premiums to compound above CPI over the hold.
Questions for the listing agent
- It's been on market 38 days. Have you received any prior offers? Is the seller open to a 3% concession, seller financing, or rate buy-down credit?
- Is there a deadline driving the sale (1031 exchange, divorce, estate, relocation)? That informs how much negotiation room exists.
- Schools are F-rated, which usually means shorter tenancies and higher turnover. Who's the typical renter profile here, and what's been the actual vacancy rate?
- What's the average days-on-market for RENTAL listings here right now (not sales)? A rising rental-DOM trend means longer vacancies and softer asking-rent achievability than the comps imply.
- What's the recent tenant-quality profile in this submarket — average credit score on applications, eviction rate, late-payment / NSF rate, and stable-employment percentage? A property-management company in the area should have these aggregated.
- How much new for-sale + rental construction is in the pipeline within 1–3 miles? Heavy new supply typically softens prices + rents 12–24 months out; constrained supply supports both.
Investment metrics
- 1% rule
- 0.99% ✗
- Cap rate
- 7.27%
- Cash-on-cash
- 3.51%
- DSCR
- 1.16
- GRM
- 8.4
CMA / ARV
- ARV (median comp)
- $150,758
- List price
- $120,000
- Delta
- -20.40%
- Verdict
- UNDERPRICED
- Comps
- 18 within 1.0 mi
Projected returns pro-forma
-3.0% appreciation · 3.0% rent growth · sell at horizon
- IRR
- -10.8%
- Equity multiple
- 0.61×
- Total profit
- $-13,170
- Equity at exit
- $17,892
- IRR
- -1.4%
- Equity multiple
- 0.90×
- Total profit
- $-3,321
- Equity at exit
- $10,375
Cash invested: $33,600 (down + closing). Projections, not guarantees.
Landlord ↔ Tenant lean methodology
- Overall (STATE)
- 87 Strongly Landlord-Friendly
- State Texas
- 87 Strongly Landlord-Friendly · R+5
- County
- — inherits STATE
- City
- — inherits STATE
ZIP-level market 78516
- Home prices YoY
- -6.5%
- Active inventory
- 350
- Price-to-rent
- 8.4×
Monthly cashflow live
- Estimated rent
- $1,186 high interval (Pro) →
- Mortgage (P&I)
- −$629
- Tax from tax record
- −$159 /mo · $1,914/yr
- Insurance
- −$50
- HOA
- −$0
- Vacancy / Maint / Mgmt
- −$249
- Net cashflow
- $98
Break-even live
UW: 25.0% down · 7.5% · 30yr · 1.5% tax · 5.0% vac · 8.0% maint · 8.0% mgmt
Financing live
Cash to close
- Down payment
- $30,000
- Closing costs
- $3,600
- Reserves months
- —
- Total cash needed
- —
Loan-product check · same deal, 3 products live
Conventional
25% down · 7.5% · 30yr
- Down + closing
- —
- Monthly P&I
- —
- Monthly cashflow
- —
- DSCR
- —
- Eligible?
- —
Personal DTI + credit; lowest rate.
DSCR
20% down · 8.5% · 30yr
- Down + closing
- —
- Monthly P&I
- —
- Monthly cashflow
- —
- DSCR
- —
- Eligible?
- —
No personal income docs; deal must DSCR.
Hard money
10% down · 12.0% · 12mo
- Down + closing
- —
- Monthly P&I
- —
- Monthly cashflow
- —
- DSCR
- —
- Eligible?
- —
Short-term bridge; refi at stabilization.
Rent comps 32 comps
| Address | Beds | Baths | Sqft | Rent | $/sqft | DOM | Units | Dist |
|---|---|---|---|---|---|---|---|---|
| 1225 Valle Vista St Unit 3 Alamo, TX | 3.0 | 2.0 | 1050 | $1,250 | $1.19 | 43d | 1 | 0.30mi |
| 1309 Valle Vista St Unit 3 Alamo, TX | 3.0 | 2.0 | 1050 | $1,250 | $1.19 | 43d | 1 | 0.30mi |
| 1305 Valle Vista St Unit 4 Alamo, TX | 3.0 | 2.0 | 1050 | $1,300 | $1.24 | 43d | 1 | 0.40mi |
| 1225 Valle Vista St Unit 2 Alamo, TX | 3.0 | 2.0 | 1040 | $1,300 | $1.25 | 43d | 1 | 0.45mi |
| 740 N Alamo Rd Unit 2 Alamo, TX | 2.0 | 2.0 | 956 | $1,075 | $1.12 | 23d | 1 | 0.95mi |
| 740 N Alamo Rd Unit 2 Alamo, TX | 2.0 | 2.0 | 956 | $1,075 | $1.12 | 43d | 1 | 0.95mi |
| 740 N Alamo Rd Unit 1 Alamo, TX | 2.0 | 2.0 | 956 | $1,200 | $1.26 | 43d | 1 | 0.95mi |
| 1109 Del Monte Dr San Juan, TX | 3.0 | 2.0 | 989 | $1,300 | $1.31 | 43d | 1 | 0.96mi |
| 1122 Country Club Dr Unit 4 Alamo, TX | 3.0 | 2.0 | 1060 | $1,200 | $1.13 | 14d | 1 | 1.21mi |
| 1233 Country Club Dr Unit 4 Alamo, TX | 2.0 | 2.0 | 1099 | $1,050 | $0.96 | 43d | 1 | 1.21mi |
| 404 N Cesar Chavez Rd Alamo, TX | 2.0 | 2.0 | 783 | $1,079 | $1.38 | 43d | 2 | 1.22mi |
| 217 Rafael Dr Unit 4 San Juan, TX | 2.0 | 2.0 | 1078 | $1,100 | $1.02 | 43d | 1 | 1.24mi |
| 400 Rafael Dr Unit 3 San Juan, TX | 2.0 | 2.0 | 969 | $1,100 | $1.14 | 21d | 1 | 1.35mi |
| 404 Rafael Dr Unit 1 San Juan, TX | 2.0 | 2.0 | 1044 | $1,080 | $1.03 | 43d | 1 | 1.36mi |
| 404 Rafael Dr Unit 4 San Juan, TX | 3.0 | 2.0 | 1044 | $1,270 | $1.22 | 23d | 1 | 1.36mi |
| 1108 Cooper Ln Unit 3 San Juan, TX | 1.0 | 1.0 | 708 | $875 | $1.24 | 43d | 1 | 1.40mi |
| 1106 Cooper Ln Unit 3 San Juan, TX | 2.0 | 2.0 | 1000 | $1,125 | $1.12 | 43d | 1 | 1.40mi |
| 203 Encino Dr San Juan, TX | 3.0 | 2.0 | 969 | $1,500 | $1.55 | 23d | 1 | 1.42mi |
| 103 E Segment Leonel Trevino Rd Unit C San Juan, TX | 2.0 | 2.0 | 962 | $1,075 | $1.12 | 43d | 1 | 1.42mi |
| 435 Medina Ln Unit 1 Alamo, TX | 2.0 | 2.0 | 908 | $1,125 | $1.24 | 23d | 1 | 1.47mi |
| 443 Medina Ln Unit 3 Alamo, TX | 2.0 | 2.0 | 908 | $1,125 | $1.24 | 23d | 1 | 1.47mi |
| 435 Medina Ln Unit 1 Alamo, TX | 2.0 | 2.0 | 908 | $1,200 | $1.32 | 43d | 1 | 1.47mi |
| 1141 W Acacia Ave Unit 8 Alamo, TX | 2.0 | 1.0 | 600 | $700 | $1.17 | 43d | 1 | 1.47mi |
| 448 Frio Ln Apt 3 Alamo, TX | 2.0 | 2.0 | 908 | $1,200 | $1.32 | 43d | 1 | 1.49mi |
| 440 Frio Ln Apt 3 Alamo, TX | 2.0 | 2.0 | 908 | $1,200 | $1.32 | 43d | 1 | 1.49mi |
| 427 Frio Ln Apt 4 Alamo, TX | 3.0 | 2.0 | 1118 | $1,275 | $1.14 | 44d | 1 | 1.49mi |
| 440 Frio Ln Apt 1 Alamo, TX | 2.0 | 2.0 | 908 | $1,275 | $1.40 | 43d | 1 | 1.49mi |
| 448 Frio Ln Apt 3 Alamo, TX | 2.0 | 2.0 | 908 | $1,200 | $1.32 | 23d | 1 | 1.49mi |
| 440 Frio Ln Apt 3 Alamo, TX | 2.0 | 2.0 | 908 | $1,200 | $1.32 | 23d | 1 | 1.49mi |
| 444 Frio Ln Apt 3 Alamo, TX | 2.0 | 2.0 | 908 | $1,125 | $1.24 | 23d | 1 | 1.49mi |
| 439 Frio Ln Unit 1 Alamo, TX | 2.0 | 2.0 | 908 | $1,125 | $1.24 | 23d | 1 | 1.49mi |
| 427 Frio Ln Apt 1 Alamo, TX | 2.0 | 2.0 | 908 | $1,125 | $1.24 | 21d | 1 | 1.49mi |
Listing history 19 events
-
2026-06-18days on market $120,000 Active 38 DOM
-
2026-06-17days on market $120,000 Active 37 DOM
-
2026-06-16days on market $120,000 Active 36 DOM
-
2026-06-15days on market $120,000 Active 35 DOM
-
2026-06-14days on market $120,000 Active 33 DOM
-
2026-06-13days on market $120,000 Active 32 DOM
-
2026-06-10days on market $120,000 Active 30 DOM
-
2026-06-09days on market $120,000 Active 29 DOM
-
2026-06-08days on market $120,000 Active 28 DOM
-
2026-06-07days on market $120,000 Active 27 DOM
-
2026-06-03days on market $120,000 Active 23 DOM
-
2026-06-02days on market $120,000 Active 22 DOM
-
2026-06-01days on market $120,000 Active 21 DOM
-
2026-05-31days on market $120,000 Active 20 DOM
-
2026-05-31days on market $120,000 Active 19 DOM
-
2026-05-05$120,000 Active 136-char remark
-
2022-02-24soldstatus
-
1999-02-24soldstatus
-
1993-02-02soldstatus
ⓘ Source: listings_history table (triggers on properties + properties_extension) + one-shot
backfill from property_details.listing_events for pre-trigger history.
Tax reassessment forecast TX · Resets to sale price
- Current annual tax
- $1,914 · $159/mo
- Projected year-2 tax
- $2,196 · $183/mo
- Expected delta
- +$282/yr (+$24/mo · 14.7%)
ⓘ Screening estimate from a state-policy table — verify with the county assessor before closing.
Climate risk First Street
- Flood 1/10 Low FEMA zone X (shaded) · 0% chance over 30 yrs
- Wildfire 3/10 Moderate
- Heat 9/10 Extreme 7 d/yr ≥111°F today · 23 d/yr by 30 yrs out
- Wind 8/10 Severe 99% chance of damaging wind over 30 yrs
- Air quality 1/10 Low 0 unhealthy d/yr today · 0 by 30 yrs out
Nearby sold comps map
Loading sold comps map…
Walkable amenities ~0.75 mi
Loading nearby amenities…
Taxation est. · year 1
- Rental income
- $14,232
- − Mortgage interest
- −$6,722
- − Property taxes
- −$1,914
- − Insurance
- −$600
- − Repairs & maintenance
- −$1,139
- − Management
- −$1,139
- − Depreciation
- −$3,491
- Taxable loss
- −$772
- Est. tax savings @ 24.0%
- +$185
- After-tax cash flow
- $1,363/yr
For passive investors: Depreciation is non-cash, so a rental often shows a tax loss while cash-flowing — sheltering income. Rental losses are passive: they offset passive income freely, and up to $25,000/yr can offset ordinary (W-2) income if you actively participate and your MAGI is under $100k (phasing out to $0 by $150k); unused losses carry forward. On sale, claimed depreciation is recaptured at up to 25%, and gains may owe capital-gains tax (a 1031 exchange can defer both). Figures are a year-1 estimate at your 24.0% rate — not tax advice; consult a CPA.
Schools (NCES district)
- District
- Pharr-San Juan-Alamo ISD
- NCES district ID
- 4834860
- Math proficiency
- 18% ▼ -34.00%
- Reading proficiency
- 30% ▼ -11.00%
- Median HH income
- $33,757
- Composite
- 19.63/100
- National rank
- #8744
- State rank
- #740 of 826 in TX
Livability — North Alamo
- Score
- 62/100
- State rank
- #941
- US rank
- #16730
Category grades
Schools grade is shown separately in the Schools card above.
Census & demographics
- Census place
- North Alamo, TX
- County
- Hidalgo County · 623,128 people
- Metro
- McAllen-Edinburg-Mission, TX
- Population (ZIP)
- 34,370
- Household income
- $53,229
- Rent vs Own
- Severe rent burden
- 476.0
Population outlook (Hidalgo County) Hauer SSP2
- Today (2025)
- 955,232 people
- By 2030
- 1,009,774 · +5.7%
- By 2040
- 1,120,332 · +17.3%
- By 2050
- 1,225,036 · +28.2%
- By 2075
- 1,439,189 · +50.7%
- By 2100
- 1,533,429 · +60.5%
Race, ethnicity, and origin ACS 2023
- Neighborhood character
- Predominantly Hispanic (89%)
- Race & ethnicity
- Hispanic / Latino 89% Two or more races 40% White 10% Black 1%
- Hispanic origin (detail)
- Mexican 86%
- Foreign-born
- 29% · Canada
- Languages at home
- 24% English-only · Spanish 76%
Political lean MEDSL · Hidalgo
- 2024 margin
- Toss-up / Even · D 48.1% · R 51.0%
- 2008→2024 swing
- -41.6pp toward R · 2008: 38.7pp · 2024: -2.9pp
- All cycles
- 2024: R+2.9 2020: D+17.1 2016: D+40.5 2012: D+41.8 2008: D+38.7
Not yet ingested
- Civics
- —
Market trends
- HPI YoY
- ▼ -15.56%
- Current HPI
- 225.4438
- Rent YoY
- —
- Metro
- McAllen-Edinburg-Mission, TX
- State GDP YoY
- ▲ 3.95%
- F500 in state
- 110
Industry mix (Fortune 500 HQ in TX)
| Industry | F500 HQs | Revenue |
|---|---|---|
| Energy | 16 | $1,198B |
|
||
| Technology | 5 | $198B |
|
||
| Engineering / Construction | 4 | $72B |
|
||
| Energy Services | 3 | $60B |
|
||
| Utilities | 3 | $41B |
|
||
| Healthcare | 2 | $330B |
|
||
Price history
4 events — show timeline
- 2026-05-05 Listed $120,000 MCALLENMLS
- 2022-02-24 Sold (Public Records) — Public Records
- 1999-02-24 Sold (Public Records) — Public Records
- 1993-02-02 Sold (Public Records) — Public Records
Property tax history
+5.7%/yrLatest (2025): $1,914 · +19.7% YoY. Source: county tax records.
Cash-flow waterfall
monthlySold comps — $/sqft
last 12 mo · ≤1 miLoading sold comps…