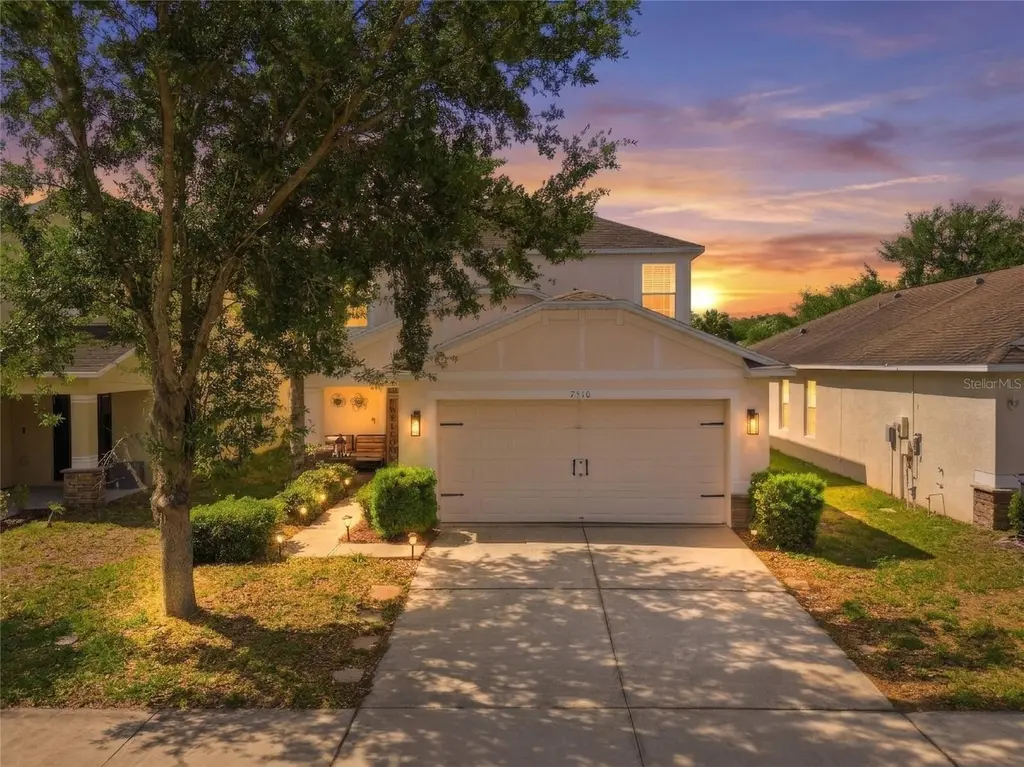
7510 Maroon Peak Dr · Sun City Center, FL
Flood risk 1/10 · Minimal
- FEMA flood zone
- X (unshaded)
- Chance of flooding over 30 yrs
- 0.0%
- Est. flood insurance / yr
- $507 – $1,088
Fire risk 4/10 · Minor
- Est. fire insurance / yr
- $947 – $1,759
Heat risk 10/10 · Severe
- Hot days now (above 108°F)
- 8 days/yr
- Hot days in 30 yrs
- 30 days/yr
Wind risk 9/10 · Severe
- Chance of severe wind over 30 yrs
- 99.0%
Air-quality risk 3/10 · Minor
- Unhealthy air days now
- 3 days/yr
- Unhealthy air days in 30 yrs
- 3 days/yr
Risk factors via First Street. Map © Google.
Why this score? — see what drove the D- grade
The composite is a weighted blend of 9 inputs, each scored 0–100. Each bar is that input's sub-score; the figure is the points it added to the 100-point composite (weight × sub-score).
- Cash flow +9.5/30.0
- ARV discount +7.5/15.0
- Schools +4.2/10.0
- Livability +3.9/5.0
- Appreciation +3.4/10.0
- 1% rule +3.2/10.0
- Rent growth +3.2/5.0
- DSCR +2.7/10.0
- Condition / age +2.5/5.0
$285,000
🖨 Deal sheet (PDF) 📄 Offer letter ✓ Due diligence
Listing remarks
Under contract-accepting backup offers. Welcome to 7510 Maroon Peak Dr in the sought-after Cypress Creek community of Ruskin! This WELL-MAINTAINED home showcases true PRIDE OF OWNERSHIP and offers the perfect blend of comfort, privacy, and convenience. Major updates provide peace of mind, including AC 2021, WATER HEATER 2021, and a BRAND NEW ROOF TO BE INSTALLED PRIOR TO CLOSING. Step inside to find a thoughtfully cared-for interior ideal for both everyday living and entertaining. The home’s layout creates a comfortable flow with plenty of space for growing families or those who simply enjoy a little extra room to spread out. Located in a BEAUTIFUL COMMUNITY, residents of Cypress Cree
Key facts
- Dog park
- Fitness center
- Resort-style pool
Tags
Neighborhood map
What this means for you Summary
Snapshot
- This is a 3-bed/3.0-bath single-family listed at $285k.
Deal economics
- At list price, monthly cash flow is $-199 ($-2k/yr) — negative.
- To cash-flow at today's rent, offer at most $250k (12.3% below list).
- To meet the 1% rule (rent ≥ 1% of price), the offer needs to be $233k (18.2% below list).
- Recommended offer: $233k (18.2% below list) — sets the bar for 1% rule.
Location & tenants
- Location reads 78/100 on livability (#178 in FL, #2,736 nationally) — a middle-class / working-renter tenant base. Strengths: housing A+, health & safety A+, crime B+; Watch: amenities F.
- Hillsborough (suburban): math 47% / reading 50% proficiency, ranked #41 of 73 in FL (top 56%) — families likely to look elsewhere, expect single-tenant / working-renter base with shorter leases.
- Zoned schools: Jule F Sumner High School (math 43% / reading 43%, grade F, #255 of 667 statewide, top 39%, 3,827 students, 43% FRL).
- Market conditions: Rents rising (+2.6%/yr); 602 active listings in the ZIP; 26 comparable units currently listed for rent nearby; rentals at typical pace (median 15d on market — plan ~3-4 weeks tenant-placement turnaround); 9,053 units permitted in Hillsborough County in 2024 (4,555 in 5+ unit buildings).
- This rent runs 38% of the median local income ($73k/yr) — at the standard rent-burdened threshold; future hikes will face affordability resistance.
Forward outlook
- Local home prices are declining (-3.0%/yr); year-one equity from $2k of loan paydown is wiped out by about $9k of value loss. Plan a longer hold.
- Hillsborough County population projected at +37% by 2050 — long-run rental-demand tailwind backs the buy-and-hold thesis.
Negotiation context
- Only 3 days on market — expect competitive offers; lowballing is unlikely to land.
- 2 sale attempts since 18y ago with the ask held roughly flat each time — persistent listings suggest the price (not the market) is what's stuck; bring a comps-based counter.
- Current owner paid $165k; list at $285k implies a 73% gain — meaningful room to come down on a strong offer.
Risks & watch-outs
- Climate carrying-cost: severe wind risk, 99% chance of damaging wind over 30y; extreme-heat days projected 8→30/yr by 2055 (HVAC capex compounding) — expect insurance premiums to compound above CPI over the hold.
Questions for the listing agent
- What do current leases actually rent for vs. the listed asking? Can we see a recent rent roll and the last 12 months of T-12 income?
- What does the HOA fee cover, when was the last increase, and are there any pending special assessments or reserve-fund shortfalls?
- Is there a deadline driving the sale (1031 exchange, divorce, estate, relocation)? That informs how much negotiation room exists.
- Schools are D-rated, which usually means shorter tenancies and higher turnover. Who's the typical renter profile here, and what's been the actual vacancy rate?
- The area grade is low — what's the realistic commute time and amenity access for the typical tenant pool here? Any planned neighborhood developments (good or bad) we should know about?
- What's the average days-on-market for RENTAL listings here right now (not sales)? A rising rental-DOM trend means longer vacancies and softer asking-rent achievability than the comps imply.
- What's the recent tenant-quality profile in this submarket — average credit score on applications, eviction rate, late-payment / NSF rate, and stable-employment percentage? A property-management company in the area should have these aggregated.
- How much new for-sale + rental construction is in the pipeline within 1–3 miles? Heavy new supply typically softens prices + rents 12–24 months out; constrained supply supports both.
Investment metrics
- 1% rule
- 0.82% ✗
- Cap rate
- 5.45%
- Cash-on-cash
- -2.99%
- DSCR
- 0.87
- GRM
- 10.2
CMA / ARV
No comps found within radius.
Projected returns pro-forma
-3.0% appreciation · 2.65% rent growth · sell at horizon
- IRR
- -21.7%
- Equity multiple
- 0.25×
- Total profit
- $-59,597
- Equity at exit
- $42,494
- IRR
- -16.2%
- Equity multiple
- 0.11×
- Total profit
- $-71,231
- Equity at exit
- $24,642
Cash invested: $79,800 (down + closing). Projections, not guarantees.
Landlord ↔ Tenant lean methodology
- Overall (STATE)
- 87 Strongly Landlord-Friendly
- State Florida
- 87 Strongly Landlord-Friendly · R+3
- County
- — inherits STATE
- City
- — inherits STATE
ZIP-level market 33573
- Home prices YoY
- -1.2%
- Rents YoY
- 2.6%
- Active inventory
- 602
- Price-to-rent
- 10.2×
Monthly cashflow live
- Estimated rent
- $2,331 high interval (Pro) →
- Mortgage (P&I)
- −$1,495
- Tax from tax record
- −$341 /mo · $4,096/yr
- Insurance
- −$119
- HOA
- −$86
- Vacancy / Maint / Mgmt
- −$490
- Net cashflow
- $-199
Break-even live
Sensitivity live
| Price | -10% $-38 | -5% $-118 | +0% $-199 | +5% $-280 | +10% $-360 |
|---|---|---|---|---|---|
| Rent | -10% $-383 | -5% $-291 | +0% $-199 | +5% $-107 | +10% $-15 |
| Rate | -1.0pp $-55 | -0.5pp $-127 | base $-199 | +0.5pp $-273 | +1.0pp $-348 |
UW: 25.0% down · 7.5% · 30yr · 1.5% tax · 5.0% vac · 8.0% maint · 8.0% mgmt
Financing live
Cash to close
- Down payment
- $71,250
- Closing costs
- $8,550
- Reserves months
- —
- Total cash needed
- —
Loan-product check · same deal, 3 products live
Conventional
25% down · 7.5% · 30yr
- Down + closing
- —
- Monthly P&I
- —
- Monthly cashflow
- —
- DSCR
- —
- Eligible?
- —
Personal DTI + credit; lowest rate.
DSCR
20% down · 8.5% · 30yr
- Down + closing
- —
- Monthly P&I
- —
- Monthly cashflow
- —
- DSCR
- —
- Eligible?
- —
No personal income docs; deal must DSCR.
Hard money
10% down · 12.0% · 12mo
- Down + closing
- —
- Monthly P&I
- —
- Monthly cashflow
- —
- DSCR
- —
- Eligible?
- —
Short-term bridge; refi at stabilization.
Rent comps 26 comps
| Address | Beds | Baths | Sqft | Rent | $/sqft | DOM | Units | Dist |
|---|---|---|---|---|---|---|---|---|
| 7338 Lumber Port Dr Ruskin, FL | 3.0 | 2.0 | 1298 | $1,975 | $1.52 | 0d | 1 | 0.04mi |
| 7329 Lumber Port Dr Ruskin, FL | 3.0 | 2.0 | 1275 | $2,000 | $1.57 | 4d | 1 | 0.08mi |
| 6139 Trent Creek Dr Sun City Center, FL | 4.0 | 2.5 | 2250 | $2,705 | $1.20 | 2d | 1 | 0.24mi |
| 15519 Telford Spring Dr Sun City Center, FL | 3.0 | 2.0 | 1348 | $2,090 | $1.55 | 25d | 1 | 0.34mi |
| 8117 Alamosa Wood Ave Ruskin, FL | 3.0 | 2.0 | 1346 | $1,895 | $1.41 | 25d | 1 | 0.37mi |
| 15423 Dark Star Ln Sun City Center, FL | 4.0 | 2.5 | 1870 | $2,185 | $1.17 | 16d | 1 | 0.47mi |
| 6507 Trent Creek Dr Sun City Center, FL | 4.0 | 2.5 | 1870 | $2,050 | $1.10 | 3d | 1 | 0.48mi |
| 6529 Trent Creek Dr Sun City Center, FL | 3.0 | 2.0 | 1451 | $1,900 | $1.31 | 12d | 1 | 0.52mi |
| 4529 Eternal Prince Dr Sun City Center, FL | 4.0 | 2.5 | 1914 | $2,450 | $1.28 | 21d | 1 | 0.75mi |
| 7106 Salt River Ave Sun City Center, FL | 4.0 | 2.5 | 1906 | $2,155 | $1.13 | 5d | 1 | 0.77mi |
| 5450 Del Coronado Dr Apollo Beach, FL | 4.0 | 2.0 | 2086 | $3,000 | $1.44 | 25d | 1 | 0.78mi |
| 7022 Ozello Trail Ave Sun City Center, FL | 4.0 | 2.0 | 1918 | $2,296 | $1.20 | 14d | 1 | 0.85mi |
| 7217 Wash Island Dr Sun City Center, FL | 4.0 | 3.0 | 2577 | $2,595 | $1.01 | 25d | 1 | 0.85mi |
| 4408 Eternal Prince Dr Sun City Center, FL | 3.0 | 2.0 | 1451 | $1,800 | $1.24 | 25d | 1 | 0.86mi |
| 5448 Silver Sun Dr Apollo Beach, FL | 4.0 | 2.0 | 1992 | $4,000 | $2.01 | 25d | 1 | 1.10mi |
| 15503 Prestwick Rose Pl Unit 1 Sun City Center, FL | 3.0 | 2.5 | 1666 | $2,000 | $1.20 | 25d | 1 | 1.15mi |
| 3511 Great Cypress Cir Sun City Center, FL | 1.0–3.0 | 1.0–2.0 | 1163 | $2,509 | $2.16 | 2d | 27 | 1.19mi |
| 5548 Summer Sunset Dr Apollo Beach, FL | 4.0 | 2.5 | 2073 | $2,850 | $1.37 | 0d | 1 | 1.20mi |
| 6196 Hidden Branch Dr Apollo Beach, FL | 4.0 | 2.0 | 2012 | $3,150 | $1.57 | 5d | 1 | 1.21mi |
| 1750 Atrium Dr Sun City Center, FL | 2.0 | 2.0 | 1367 | $1,750 | $1.28 | 25d | 1 | 1.22mi |
| 9637 Pembrooke Pines Dr Sun City Center, FL | 2.0 | 2.5 | 1548 | $2,100 | $1.36 | 25d | 1 | 1.22mi |
| 9718 Mulberry Marsh Ln Sun City Center, FL | 3.0 | 2.5 | 1663 | $1,973 | $1.19 | 16d | 1 | 1.29mi |
| 6214 Sea Amber Ln Apollo Beach, FL | 4.0 | 3.0 | 2273 | $3,200 | $1.41 | 12d | 1 | 1.37mi |
| 9771 Pembrooke Pines Dr Sun City Center, FL | 3.0 | 2.5 | 1634 | $2,025 | $1.24 | 4d | 1 | 1.38mi |
| 15504 Florence Hollow Pl Sun City Center, FL | 3.0 | 2.5 | 1787 | $2,150 | $1.20 | 5d | 1 | 1.42mi |
| 1110 Evergreen Isles Dr Sun City Center, FL | 1.0–3.0 | 1.0–2.0 | 990 | $4,263 | $4.31 | 0d | 1 | 1.43mi |
HOA detail
- Monthly dues
- $86 · $1,032/yr
- Likely covers
- water
Listing history 4 events
-
2026-04-27status Pending
-
2026-04-24$285,000 Active
-
2008-10-20soldstatus $164,990
-
2008-07-25$169,990
ⓘ Source: listings_history table (triggers on properties + properties_extension) + one-shot
backfill from property_details.listing_events for pre-trigger history.
Tax reassessment forecast FL · Resets to sale price
- Current annual tax
- $4,096 · $341/mo
- Projected year-2 tax
- $4,096 · $341/mo
- Expected delta
- $0/yr ($0/mo · 0.0%)
ⓘ Screening estimate from a state-policy table — verify with the county assessor before closing.
Climate risk First Street
- Flood 1/10 Low FEMA zone X (unshaded) · 0% chance over 30 yrs
- Wildfire 4/10 Moderate
- Heat 10/10 Extreme 8 d/yr ≥108°F today · 30 d/yr by 30 yrs out
- Wind 9/10 Extreme 99% chance of damaging wind over 30 yrs
- Air quality 3/10 Moderate 3 unhealthy d/yr today · 3 by 30 yrs out
Nearby sold comps map
Loading sold comps map…
Walkable amenities ~0.75 mi
Loading nearby amenities…
Taxation est. · year 1
- Rental income
- $27,974
- − Mortgage interest
- −$15,964
- − Property taxes
- −$4,096
- − Insurance
- −$1,425
- − Repairs & maintenance
- −$2,238
- − Management
- −$2,238
- − HOA
- −$1,032
- − Depreciation
- −$8,291
- Taxable loss
- −$7,310
- Est. tax savings @ 24.0%
- +$1,754
- After-tax cash flow
- $-634/yr
For passive investors: Depreciation is non-cash, so a rental often shows a tax loss while cash-flowing — sheltering income. Rental losses are passive: they offset passive income freely, and up to $25,000/yr can offset ordinary (W-2) income if you actively participate and your MAGI is under $100k (phasing out to $0 by $150k); unused losses carry forward. On sale, claimed depreciation is recaptured at up to 25%, and gains may owe capital-gains tax (a 1031 exchange can defer both). Figures are a year-1 estimate at your 24.0% rate — not tax advice; consult a CPA.
Schools (NCES district)
- District
- Hillsborough
- NCES district ID
- 1200870
- Math proficiency
- 47% ▼ -8.00%
- Reading proficiency
- 50% ▼ -4.00%
- Median HH income
- $50,622
- Composite
- 41.6/100
- National rank
- #3435
- State rank
- #41 of 73 in FL
Livability — Sun City Center
- Score
- 78/100
- State rank
- #178
- US rank
- #2736
Category grades
Schools grade is shown separately in the Schools card above.
Census & demographics
- Census place
- Sun City Center, FL
- County
- Hillsborough County · 1,540,968 people
- City population
- 35,362
- Metro
- Tampa-St. Petersburg-Clearwater, FL
- Population (ZIP)
- 35,362
- Household income
- $72,834
- Rent vs Own
- Severe rent burden
- 1382.0
Population outlook (Hillsborough County) Hauer SSP2
- Today (2025)
- 1,607,022 people
- By 2030
- 1,733,968 · +7.9%
- By 2040
- 1,979,565 · +23.2%
- By 2050
- 2,203,427 · +37.1%
- By 2075
- 2,667,893 · +66.0%
- By 2100
- 2,891,558 · +79.9%
Race, ethnicity, and origin ACS 2023
- Neighborhood character
- Predominantly White (73%)
- Race & ethnicity
- White 73% Hispanic / Latino 13% Two or more races 11% Black 10% Asian 1%
- Hispanic origin (detail)
- Mexican 1% Puerto Rican 6% Cuban 2%
- Common ancestry
- Romanian 3% Lithuanian 3% Slovak 2%
- Foreign-born
- 8% · Canada, Vietnam
- Languages at home
- 86% English-only · Spanish 10% French/Haitian/Cajun 1% German/W. Germanic 1%
Political lean MEDSL · Hillsborough
- 2024 margin
- Toss-up / Even · D 47.8% · R 50.9% · Other 1.3%
- 2008→2024 swing
- -10.2pp toward R · 2008: 7.1pp · 2024: -3.1pp
- All cycles
- 2024: R+3.1 2020: D+6.9 2016: D+6.8 2012: D+6.7 2008: D+7.1
Not yet ingested
- Civics
- —
Market trends
- HPI YoY
- ▼ -3.27%
- Current HPI
- 272.9767
- Rent YoY
- ▲ 2.65%
- Metro
- Tampa-St. Petersburg-Clearwater, FL
- State GDP YoY
- ▲ 3.28%
- F500 in state
- 36
Industry mix (Fortune 500 HQ in FL)
| Industry | F500 HQs | Revenue |
|---|---|---|
| Industrial Technology | 2 | $29B |
|
||
| Insurance | 2 | $17B |
|
||
| Retail | 1 | $60B |
|
||
| Technology Distribution | 1 | $58B |
|
||
| Homebuilding | 1 | $35B |
|
||
| Technology Manufacturing | 1 | $35B |
|
||
Price history
+67.7% since first listed4 events — show timeline
- 2026-04-27 Pending — Stellar MLS as Distributed by MLS Grid
- 2026-04-24 Listed $285,000 Stellar MLS as Distributed by MLS Grid
- 2008-10-20 Sold (MLS) $164,990 Stellar MLS as Distributed by MLS Grid
- 2008-07-25 Listed $169,990 Stellar MLS as Distributed by MLS Grid
Property tax history
+2.6%/yrLatest (2025): $4,096 · +4.3% YoY. Source: county tax records.
Cash-flow waterfall
monthlySold comps — $/sqft
last 12 mo · ≤1 miLoading sold comps…