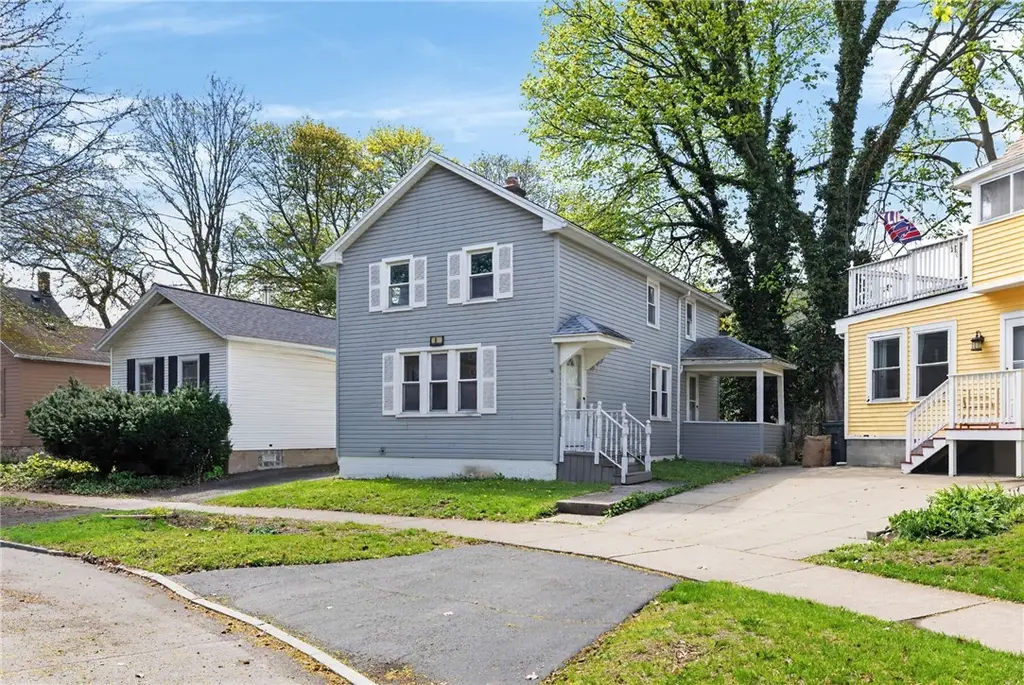
89 Mount Vernon Ave · Rochester, NY
Flood risk 6/10 · Moderate
- FEMA flood zone
- X (unshaded)
- Chance of flooding over 30 yrs
- 0.69%
- Est. flood insurance / yr
- $473 – $860
Fire risk 1/10 · Minimal
- Est. fire insurance / yr
- $691 – $1,283
Heat risk 2/10 · Minimal
- Hot days now (above 96°F)
- 7 days/yr
- Hot days in 30 yrs
- 15 days/yr
Wind risk 1/10 · Minimal
- Chance of severe wind over 30 yrs
- —
Air-quality risk 2/10 · Minimal
- Unhealthy air days now
- 1 days/yr
- Unhealthy air days in 30 yrs
- 1 days/yr
Risk factors via First Street. Map © Google.
Why this score? — see what drove the B grade
The composite is a weighted blend of 9 inputs, each scored 0–100. Each bar is that input's sub-score; the figure is the points it added to the 100-point composite (weight × sub-score).
- Cash flow +29.2/30.0
- ARV discount +15.0/15.0
- DSCR +10.0/10.0
- 1% rule +7.7/10.0
- Livability +3.8/5.0
- Rent growth +2.8/5.0
- Condition / age +2.5/5.0
- Schools +1.9/10.0
- Appreciation +0.0/10.0
$149,900
🖨 Deal sheet (PDF) 📄 Offer letter ✓ Due diligence
Listing remarks MLS
Location, Location, Location! This could be the best buy in the sought after South Wedge neighborhood! Nice versatile layout w/ 3 bedrooms, 1.5 baths, formal dining room & office/den area, Hardwood & ceramic tile floors thru-out, Many recent updates include kitchen w/ granite countertops (2013), All new thermopane windows & vinyl siding (2009), Roof-Southside (2012), Walking distance to many shops, restaurants etc, just minutes to Highland Hospital, Strong, U of R, Highland park, expressways & more, Call today!
Key facts
- Tile shower surround
- Freshly painted
- Tile flooring
Tags
Property features AI
Exterior
- Parking: No garage; Garage door opener
- Utilities: Cable available; High-speed internet available; Circuit breaker electrical panel; Community/Coop sewer; Spring water source
- Home design: Two-story; Existing construction
- Construction: Vinyl siding; Copper plumbing; Shingle roof; Block and stone foundation
- Exterior features: Blacktop driveway; Open porch
Interior
- Kitchen: Gas oven; Gas range; Refrigerator
- Bedrooms: One main-level bedroom
- Flooring: Ceramic tile; Hardwood; Varies
- Bathrooms: One full bathroom; One half bathroom; One main-level bathroom
- Heating & cooling: Gas heating; Forced air heating
- Interior features: Den; Separate/formal dining room; Separate/formal living room; Pantry; Solid surface counters
- Laundry & utility: Laundry in basement; Gas water heater
Neighborhood map
What this means for you Summary
Snapshot
- This is a 3-bed/1.5-bath single-family listed at $150k.
Deal economics
- At list price, monthly cash flow is $521 ($6k/yr) — positive.
- The deal already cash-flows at list — no discount required.
- Meets the 1% rule at list price ($2k rent vs $150k).
Location & tenants
- Location reads 76/100 on livability (#222 in NY, #3,482 nationally) — a middle-class / working-renter tenant base. Strengths: commute A+, cost of living A+, housing A+; Watch: schools D+, crime F, employment F.
- Rochester City School District (urban): math 21% / reading 26% proficiency, ranked #589 of 590 in NY (top 100%) — low school quality limits family demand, transient renter base, plan for 1-2y turnover; 82% free/reduced lunch — lower-income household profile, screen leases tightly.
- Market conditions: Rents rising (+1.2%/yr); 74 active listings in the ZIP; 40 comparable units currently listed for rent nearby; rentals at typical pace (median 22d on market — plan ~3-4 weeks tenant-placement turnaround); 1,169 units permitted in Monroe County in 2024 (591 in 5+ unit buildings).
- This rent runs 37% of the median local income ($62k/yr) — at the standard rent-burdened threshold; future hikes will face affordability resistance.
Forward outlook
- Local home prices are declining (-3.0%/yr); year-one equity from $1k of loan paydown is wiped out by about $4k of value loss. Plan a longer hold.
- Monroe County population projected to shrink 6% by 2050 — rents likely to lag national; underwrite the cash flow, not the appreciation.
- At projected returns (-3.0% appreciation + 1.2% rent growth), your $42k cash investment doubles in ~10 years — after that, you're playing with house money.
Negotiation context
- Only 7 days on market — expect competitive offers; lowballing is unlikely to land.
- 3 sale attempts since 13y ago with the ask held roughly flat each time — persistent listings suggest the price (not the market) is what's stuck; bring a comps-based counter.
- Current owner paid $77k; list at $150k implies a 95% gain — meaningful room to come down on a strong offer.
Risks & watch-outs
- Watch-outs: built in 1890 — expect roof / HVAC / electrical / plumbing capex.
- Climate carrying-cost: major flood risk — expect insurance premiums to compound above CPI over the hold.
Questions for the listing agent
- Built in 1890 — when were the roof, HVAC, electrical panel, plumbing, and water heater last replaced?
- Is there a deadline driving the sale (1031 exchange, divorce, estate, relocation)? That informs how much negotiation room exists.
- Schools are D-rated, which usually means shorter tenancies and higher turnover. Who's the typical renter profile here, and what's been the actual vacancy rate?
- Crime grade is F in this area — have there been break-ins, vandalism, or insurance claims at this property in the last 3 years? What carrier currently insures it and at what premium?
- What's the average days-on-market for RENTAL listings here right now (not sales)? A rising rental-DOM trend means longer vacancies and softer asking-rent achievability than the comps imply.
- What's the recent tenant-quality profile in this submarket — average credit score on applications, eviction rate, late-payment / NSF rate, and stable-employment percentage? A property-management company in the area should have these aggregated.
- How much new for-sale + rental construction is in the pipeline within 1–3 miles? Heavy new supply typically softens prices + rents 12–24 months out; constrained supply supports both.
Investment metrics
- 1% rule
- 1.27% ✓
- Cap rate
- 10.46%
- Cash-on-cash
- 14.89%
- DSCR
- 1.66
- GRM
- 6.6
CMA / ARV
- ARV (median comp)
- $249,548
- List price
- $149,900
- Delta
- -39.93%
- Verdict
- UNDERPRICED
- Comps
- 20 within 1.0 mi
Show comp detail 12 sales within ~0.75 mi
| Address | Dist | Beds/Ba | Sqft | Sold | Price | $/sf | Match |
|---|---|---|---|---|---|---|---|
| 185 Caroline St | 0.11mi | 3/1.0 | 1,334 (+0%) | 1mo | $242,005 | $181 | 92 |
| 176 Caroline St | 0.09mi | 2/1.5 (-1) | 1,408 (+6%) | 3mo | $250,000 | $178 | 79 |
| 24 Goebel Pl | 0.14mi | 3/2.0 | 1,430 (+8%) | 3mo | $248,000 | $173 | 77 |
| 755 Goodman St S | 0.30mi | 3/1.0 | 1,220 (-8%) | 1mo | $153,500 | $126 | 69 |
| 61 Allmeroth St | 0.49mi | 3/1.0 | 1,289 (-3%) | 3mo | $244,000 | $189 | 68 |
| 24 Bloomfield Pl | 0.41mi | 3/2.0 | 1,241 (-7%) | 1mo | $215,000 | $173 | 67 |
| 69 Benton St | 0.18mi | 2/1.0 (-1) | 1,176 (-12%) | 1mo | $227,222 | $193 | 65 |
| 383 Benton St | 0.47mi | 3/1.5 | 1,257 (-6%) | 6mo | $255,000 | $203 | 64 |
| 521 Benton St | 0.65mi | 3/1.0 | 1,440 (+8%) | 1mo | $250,000 | $174 | 53 |
| 78 Sanford St | 0.45mi | 2/2.0 (-1) | 1,176 (-12%) | 2mo | $300,000 | $255 | 51 |
| 461 Benton St | 0.57mi | 4/1.5 (+1) | 1,500 (+13%) | 1mo | $270,000 | $180 | 46 |
| 190 Henrietta St | 0.62mi | 2/2.0 (-1) | 1,494 (+12%) | 4mo | $310,000 | $207 | 40 |
Match score weights: distance 35% · size 25% · config 20% · recency 20%. Top-matched comps best support the ARV.
Projected returns pro-forma
-3.0% appreciation · 1.2% rent growth · sell at horizon
- IRR
- 3.5%
- Equity multiple
- 1.13×
- Total profit
- $5,503
- Equity at exit
- $22,351
- IRR
- 11.3%
- Equity multiple
- 1.81×
- Total profit
- $34,114
- Equity at exit
- $12,961
Cash invested: $41,972 (down + closing). Projections, not guarantees.
Landlord ↔ Tenant lean methodology
- Overall (STATE)
- 15 Strongly Tenant-Friendly
- State New York
- 15 Strongly Tenant-Friendly · D+10
- County
- — inherits STATE
- City
- — inherits STATE
ZIP-level market 14620
- Home prices YoY
- -20.1%
- Rents YoY
- 1.2%
- Active inventory
- 74
- Price-to-rent
- 6.6×
Monthly cashflow live
- Estimated rent
- $1,900 high interval (Pro) →
- Mortgage (P&I)
- −$786
- Tax from tax record
- −$131 /mo · $1,576/yr
- Insurance
- −$62
- HOA
- −$0
- Vacancy / Maint / Mgmt
- −$399
- Net cashflow
- $521
Break-even live
Sensitivity live
| Price | -10% $606 | -5% $563 | +0% $521 | +5% $479 | +10% $436 |
|---|---|---|---|---|---|
| Rent | -10% $371 | -5% $446 | +0% $521 | +5% $596 | +10% $671 |
| Rate | -1.0pp $596 | -0.5pp $559 | base $521 | +0.5pp $482 | +1.0pp $443 |
UW: 25.0% down · 7.5% · 30yr · 1.5% tax · 5.0% vac · 8.0% maint · 8.0% mgmt
Financing live
Cash to close
- Down payment
- $37,475
- Closing costs
- $4,497
- Reserves months
- —
- Total cash needed
- —
Loan-product check · same deal, 3 products live
Conventional
25% down · 7.5% · 30yr
- Down + closing
- —
- Monthly P&I
- —
- Monthly cashflow
- —
- DSCR
- —
- Eligible?
- —
Personal DTI + credit; lowest rate.
DSCR
20% down · 8.5% · 30yr
- Down + closing
- —
- Monthly P&I
- —
- Monthly cashflow
- —
- DSCR
- —
- Eligible?
- —
No personal income docs; deal must DSCR.
Hard money
10% down · 12.0% · 12mo
- Down + closing
- —
- Monthly P&I
- —
- Monthly cashflow
- —
- DSCR
- —
- Eligible?
- —
Short-term bridge; refi at stabilization.
Rent comps 40 comps
| Address | Beds | Baths | Sqft | Rent | $/sqft | DOM | Units | Dist |
|---|---|---|---|---|---|---|---|---|
| 416 Gregory St Unit Down Rochester, NY | 3.0 | 1.0 | 1374 | $1,995 | $1.45 | 24d | 1 | 0.17mi |
| 256 Gregory St Rochester, NY | 3.0 | 1.0 | 1150 | $1,700 | $1.48 | 44d | 1 | 0.19mi |
| 625 S Goodman St Rochester, NY | 1.0–2.0 | 1.0–2.0 | 868 | $2,506 | $2.89 | 3d | 8 | 0.29mi |
| 355 Caroline St Rochester, NY | 3.0 | 1.0 | 1143 | $1,650 | $1.44 | 22d | 1 | 0.30mi |
| 694 Broadway Rochester, NY | 2.0 | 1.5 | 1090 | $2,200 | $2.02 | 24d | 1 | 0.31mi |
| 271 Pearl St Unit 273 Rochester, NY | 3.0 | 1.0 | 1200 | $1,795 | $1.50 | 4d | 1 | 0.34mi |
| 451 Averill Ave Rochester, NY | 2.0 | 1.0 | 1352 | $1,695 | $1.25 | 4d | 1 | 0.35mi |
| 451 Averill Ave Rochester, NY | 2.0 | 1.0 | 1352 | $1,695 | $1.25 | 22d | 1 | 0.35mi |
| 507 Meigs St Rochester, NY | 3.0 | 1.0 | 1577 | $1,650 | $1.05 | 44d | 1 | 0.36mi |
| 463 Averill Ave Unit 451 Averill Rochester, NY | 2.0 | 1.0 | 1352 | $1,695 | $1.25 | 22d | 1 | 0.37mi |
| 106 Gregory St Rochester, NY | 3.0 | 1.5 | 1680 | $1,995 | $1.19 | 24d | 1 | 0.39mi |
| 94 Averill Ave Unit 2 Rochester, NY | 2.0 | 1.0 | 1200 | $1,500 | $1.25 | 4d | 1 | 0.40mi |
| 495 S Clinton Ave Rochester, NY | 2.0 | 1.0 | 1000 | $1,400 | $1.40 | 15d | 1 | 0.44mi |
| 108 Boardman St Rochester, NY | 2.0 | 1.0 | 1000 | $1,300 | $1.30 | 44d | 1 | 0.51mi |
| 30 Boardman St #1 Rochester, NY | 2.0 | 1.0 | 1050 | $1,600 | $1.52 | 44d | 1 | 0.60mi |
| 123 Griffith St Unit 6 Rochester, NY | 2.0 | 1.0 | 1000 | $950 | $0.95 | 22d | 1 | 0.60mi |
| 12 Boardman St Rochester, NY | 2.0 | 1.0 | 1008 | $1,600 | $1.59 | 44d | 1 | 0.62mi |
| 19-21 Cornell St Rochester, NY | 2.0 | 1.0 | 900 | $1,250 | $1.39 | 24d | 1 | 0.63mi |
| 261 Henrietta St Rochester, NY | 3.0 | 1.0 | 1200 | $1,600 | $1.33 | 11d | 1 | 0.68mi |
| 290 Exchange Blvd Rochester, NY | 2.0 | 1.0–2.0 | 892 | $2,102 | $2.36 | 3d | 15 | 0.75mi |
| 500 Oxford St #1 Rochester, NY | 2.0 | 2.0 | 1400 | $1,800 | $1.29 | 44d | 1 | 0.76mi |
| 164 Laburnam Cres Rochester, NY | 2.0 | 2.0 | 1328 | $1,900 | $1.43 | 44d | 1 | 0.79mi |
| 9 Rowley St Unit 3 Rochester, NY | 2.0 | 1.0 | 966 | $1,550 | $1.60 | 24d | 1 | 0.81mi |
| 209 S Goodman St Rochester, NY | 2.0 | 2.0 | 1500 | $1,700 | $1.13 | 44d | 1 | 0.81mi |
| 47 Savannah St Rochester, NY | 2.0 | 1.0–2.0 | 775 | $2,025 | $2.61 | 22d | 6 | 0.88mi |
| 102 Court St Rochester, NY | 1.0–2.0 | 1.0–2.0 | 952 | $2,570 | $2.70 | 4d | 11 | 0.89mi |
| 21 Arnold Park Rochester, NY | 2.0 | 1.0 | 750 | $1,425 | $1.90 | 3d | 15 | 0.92mi |
| 32 Lilac Dr Brighton, NY | 2.0 | 1.0–1.5 | 800 | $1,625 | $2.03 | 22d | 4 | 0.93mi |
| 948 Monroe Ave Rochester, NY | 3.0 | 1.0 | 1200 | $1,850 | $1.54 | 3d | 1 | 0.93mi |
| 948 Monroe Ave Rochester, NY | 3.0 | 1.0 | 1200 | $1,850 | $1.54 | 11d | 1 | 0.93mi |
| 965 Monroe Ave Rochester, NY | 2.0 | 1.0 | 1335 | $1,800 | $1.35 | 3d | 1 | 0.94mi |
| 294 Barrington St Rochester, NY | 2.0 | 1.5 | 1131 | $1,750 | $1.55 | 44d | 1 | 1.01mi |
| 56 Clintwood Ct Brighton, NY | 2.0 | 1.0 | 685 | $1,565 | $2.28 | 4d | 1 | 1.02mi |
| 260 Oxford St Unit UP Rochester, NY | 2.0 | 1.0 | 1850 | $2,600 | $1.41 | 44d | 1 | 1.03mi |
| 188 Laney Rd Rochester, NY | 3.0 | 1.5 | 1604 | $2,350 | $1.47 | 3d | 1 | 1.03mi |
| 55 Exchange Blvd Rochester, NY | 2.0 | 1.0–2.0 | 952 | $2,695 | $2.83 | 4d | 28 | 1.04mi |
| 111 East Ave Rochester, NY | 2.0 | 1.0–2.0 | 614 | $1,900 | $3.09 | 44d | 1 | 1.07mi |
| 183 E Main St Rochester, NY | 1.0–2.0 | 1.0 | 1142 | $2,870 | $2.51 | 11d | 28 | 1.08mi |
| 474 East Ave Rochester, NY | 1.0–2.0 | 1.0–2.0 | 1125 | $2,800 | $2.49 | 24d | 1 | 1.09mi |
| 42 S Washington St Rochester, NY | 2.0 | 2.0 | 1298 | $2,300 | $1.77 | 44d | 1 | 1.09mi |
Listing history 7 events
-
2026-05-06status Pending 977-char remark
-
2026-04-29$149,900 Active 977-char remark
-
2015-05-18soldstatus $77,000 Closed Sale or Rented 540-char remark
Show marketing remark (540 chars)
Location, Location, Location! This could be the best buy in the sought after South Wedge neighborhood! Nice versatile layout w/ 3 bedrooms, 1.5 baths, formal dining room & office/den area, Hardwood & ceramic tile floors thru-out, Many recent updates include kitchen w/ granite countertops (2013), All new thermopane windows & vinyl siding (2009), Roof-Southside (2012), Walking distance to many shops, restaurants etc, just minutes to Highland Hospital, Strong, U of R, Highland park, expressways & more, Call today!
-
2015-05-15soldstatus $77,000
-
2015-03-23$84,900 540-char remark
Show marketing remark (540 chars)
Location, Location, Location! This could be the best buy in the sought after South Wedge neighborhood! Nice versatile layout w/ 3 bedrooms, 1.5 baths, formal dining room & office/den area, Hardwood & ceramic tile floors thru-out, Many recent updates include kitchen w/ granite countertops (2013), All new thermopane windows & vinyl siding (2009), Roof-Southside (2012), Walking distance to many shops, restaurants etc, just minutes to Highland Hospital, Strong, U of R, Highland park, expressways & more, Call today!
-
2013-10-26$94,900
-
2003-02-21soldstatus $66,000
ⓘ Source: listings_history table (triggers on properties + properties_extension) + one-shot
backfill from property_details.listing_events for pre-trigger history.
Tax reassessment forecast NY · Partial reset (capped growth)
- Current annual tax
- $1,576 · $131/mo
- Projected year-2 tax
- $2,055 · $171/mo
- Expected delta
- +$479/yr (+$40/mo · 30.4%)
ⓘ Screening estimate from a state-policy table — verify with the county assessor before closing.
Climate risk First Street
- Flood 6/10 Major FEMA zone X (unshaded) · 69% chance over 30 yrs
- Wildfire 1/10 Low
- Heat 2/10 Low 7 d/yr ≥96°F today · 15 d/yr by 30 yrs out
- Wind 1/10 Low
- Air quality 2/10 Low 1 unhealthy d/yr today · 1 by 30 yrs out
Nearby sold comps map
Loading sold comps map…
Walkable amenities ~0.75 mi
Loading nearby amenities…
Taxation est. · year 1
- Rental income
- $22,797
- − Mortgage interest
- −$8,397
- − Property taxes
- −$1,576
- − Insurance
- −$750
- − Repairs & maintenance
- −$1,824
- − Management
- −$1,824
- − Depreciation
- −$4,361
- Taxable income
- $4,067
- Est. tax owed @ 24.0%
- −$976
- After-tax cash flow
- $5,275/yr
For passive investors: Depreciation is non-cash, so a rental often shows a tax loss while cash-flowing — sheltering income. Rental losses are passive: they offset passive income freely, and up to $25,000/yr can offset ordinary (W-2) income if you actively participate and your MAGI is under $100k (phasing out to $0 by $150k); unused losses carry forward. On sale, claimed depreciation is recaptured at up to 25%, and gains may owe capital-gains tax (a 1031 exchange can defer both). Figures are a year-1 estimate at your 24.0% rate — not tax advice; consult a CPA.
Schools (NCES district)
- District
- Rochester City School District
- NCES district ID
- 3624750
- Math proficiency
- 21% ▬ 0.00%
- Reading proficiency
- 26% ▲ 4.00%
- Median HH income
- $30,923
- Composite
- 18.98/100
- National rank
- #8850
- State rank
- #589 of 590 in NY
Livability — Rochester
- Score
- 76/100
- State rank
- #222
- US rank
- #3482
Category grades
Schools grade is shown separately in the Schools card above.
Census & demographics
- Census place
- Rochester, NY
- County
- Monroe County · 674,131 people
- City population
- 432,803
- Metro
- Rochester, NY
- Population (ZIP)
- 23,769
- Household income
- $61,783
- Rent vs Own
- Severe rent burden
- 2013.0
Population outlook (Monroe County) Hauer SSP2
- Today (2025)
- 759,460 people
- By 2030
- 757,154 · -0.3%
- By 2040
- 740,644 · -2.5%
- By 2050
- 714,443 · -5.9%
- By 2075
- 645,883 · -15.0%
- By 2100
- 547,084 · -28.0%
Race, ethnicity, and origin ACS 2023
- Neighborhood character
- Predominantly White (68%)
- Race & ethnicity
- White 68% Black 12% Asian 9% Hispanic / Latino 6% Two or more races 6%
- Hispanic origin (detail)
- Puerto Rican 3%
- Common ancestry
- Romanian 5% Iranian 3% Lithuanian 2%
- Foreign-born
- 13% · China, Canada, South Korea
- Languages at home
- 85% English-only · Chinese 4% Spanish 4% Other Indo-European 3%
Political lean MEDSL · Monroe
- 2024 margin
- D (+19.1) · D 59.5% · R 40.5%
- 2008→2024 swing
- +1.4pp toward D · 2008: 17.7pp · 2024: 19.1pp
- All cycles
- 2024: D+19.1 2020: D+21.0 2016: D+14.1 2012: D+17.4 2008: D+17.7
Not yet ingested
- Civics
- —
Market trends
- HPI YoY
- ▼ -84.77%
- Current HPI
- 337.6917
- Rent YoY
- ▲ 1.20%
- Metro
- Rochester, NY
- State GDP YoY
- ▲ 2.60%
- F500 in state
- 92
Industry mix (Fortune 500 HQ in NY)
| Industry | F500 HQs | Revenue |
|---|---|---|
| Financial Services | 10 | $950B |
|
||
| Consumer Goods | 9 | $162B |
|
||
| Insurance | 4 | $225B |
|
||
| Telecommunications | 2 | $144B |
|
||
| Pharmaceuticals | 2 | $112B |
|
||
| Media / Entertainment | 2 | $69B |
|
||
Price history
+127.1% since first listed7 events — show timeline
- 2026-05-06 Pending — UNYREIS
- 2026-04-29 Listed $149,900 UNYREIS
- 2015-05-18 Sold (MLS) $77,000 UNYREIS
- 2015-05-15 Sold (Public Records) $77,000 Public Records
- 2015-03-23 Listed $84,900 UNYREIS
- 2013-10-26 Listed $94,900 UNYREIS
- 2003-02-21 Sold (Public Records) $66,000 Public Records
Property tax history
+6.0%/yrLatest (2025): $1,576 · +0.2% YoY. Source: county tax records.
Cash-flow waterfall
monthlySold comps — $/sqft
last 12 mo · ≤1 miLoading sold comps…