 Duplex
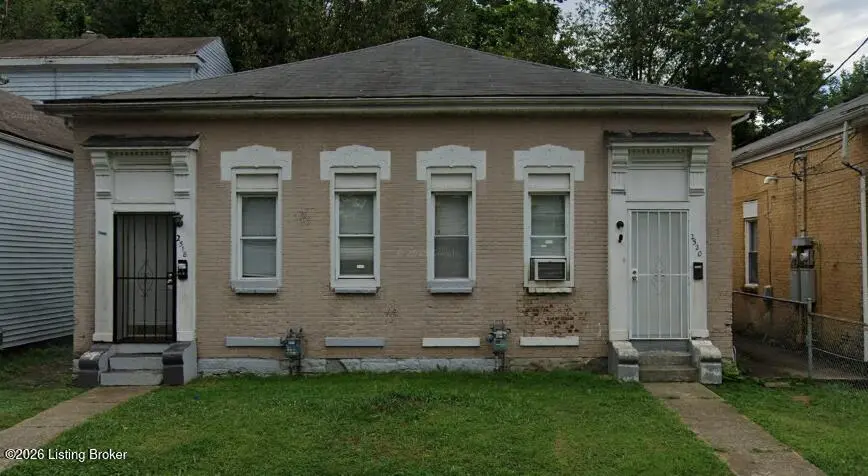
2518/2520 Rowan St · Louisville, KY
Flood risk 1/10 · Minimal
- FEMA flood zone
- X (unshaded)
- Chance of flooding over 30 yrs
- 0.0%
- Est. flood insurance / yr
- $507 – $1,088
Fire risk 1/10 · Minimal
- Est. fire insurance / yr
- $839 – $1,559
Heat risk 5/10 · Moderate
- Hot days now (above 105°F)
- 7 days/yr
- Hot days in 30 yrs
- 20 days/yr
Wind risk 2/10 · Minimal
- Chance of severe wind over 30 yrs
- 1.0%
Air-quality risk 2/10 · Minimal
- Unhealthy air days now
- 1 days/yr
- Unhealthy air days in 30 yrs
- 2 days/yr
Risk factors via First Street. Map © Google.
Why this score? — see what drove the B+ grade
The composite is a weighted blend of 9 inputs, each scored 0–100. Each bar is that input's sub-score; the figure is the points it added to the 100-point composite (weight × sub-score).
- Cash flow +30.0/30.0
- 1% rule +10.0/10.0
- DSCR +10.0/10.0
- Appreciation +10.0/10.0
- ARV discount +7.5/15.0
- Livability +3.2/5.0
- Rent growth +2.6/5.0
- Condition / age +2.5/5.0
- Schools +2.3/10.0
$150,000
🖨 Deal sheet (PDF) 📄 Offer letter ✓ Due diligence
Multi-family units
County records classify this as Multi-Family (2-4 Unit). Listing-text estimate: 2 units. confirmed
Listing remarks MLS
Brick duplex conveniently located to I-64, both units are approximately 1300 sq ft 2 bed 1 bath. Both units are currently rented. One unit updated within the last year.
Key facts
- Individual entrances
- Functional kitchens
- Updated flooring
Tags
Property features AI
Finance
- Financial info: Tenants pay electric, gas, water and sewer
- HOA & community: No association fee
Exterior
- Parking: No covered parking
- Utilities: Electricity connected; Natural gas available
- Home design: Duplex (Camelback style)
- Construction: Wood frame construction; Shingle roof; Built in 1900
- Exterior features: No notable exterior features listed; Sidewalk along the lot
Interior
- Kitchen: Two kitchens (one per unit); Two ranges; Two refrigerators; No dishwasher on the first level
- Bedrooms: 6 total bedrooms (4 on first level, 2 on second level)
- Bathrooms: Two full bathrooms on the first level
- Heating & cooling: Two furnaces; Natural gas heating; Central air conditioning
- Interior features: Two separate meters (multi-unit); No basement
- Laundry & utility: Two laundry areas (one per unit)
Neighborhood map
What this means for you Summary
Snapshot
- This is a 2 × 3-bed/1.0-bath units multifamily listed at $150k.
Deal economics
- At list price, monthly cash flow is $968 ($12k/yr) — positive. Per door: $484/mo.
- The deal already cash-flows at list — no discount required.
- Meets the 1% rule at list price ($2k rent vs $150k).
- Recommended offer: $136k (9.0% below list) — sets the bar for market timing.
- Cap rate 14.0% vs local median 5.0% in Louisville — top-decile yield for the area; either an underpriced asset or a hidden risk that comps aren't pricing in. Stress-test before assuming the spread holds.
Location & tenants
- Location reads 63/100 on livability (#333 in KY) — a middle-class / working-renter tenant base. Strengths: cost of living A+, housing A+; Watch: employment C-, health & safety D+, schools D-.
- Jefferson County (urban): math 19% / reading 35% proficiency, ranked #121 of 165 in KY (top 73%) — low school quality limits family demand, transient renter base, plan for 1-2y turnover.
- Market conditions: Rents flat; 141 active listings in the ZIP; 1 comparable units currently listed for rent nearby; lower-income renter base — watch delinquency; 2,836 units permitted in Jefferson County in 2024 (1,558 in 5+ unit buildings).
Forward outlook
- In year one you build about $16k of equity ($1k loan paydown + $15k appreciation (10.0% local appreciation)).
- Jefferson County population projected at +13% by 2050 — modest demand growth; plan on rents tracking national, not racing it.
- At projected returns (10.0% appreciation + 0.5% rent growth), your $42k cash investment doubles in ~2 years — after that, you're playing with house money.
- By year 3, paydown + projected appreciation supports a ~$41k cash-out refi (75% LTV) — recoverable capital for the next deal without selling this one.
Negotiation context
- It's been on market 100 days — a 9% lower offer ($136k) is reasonable based on typical stale-listing flexibility.
- 12 sale attempts since 27y ago; this cycle's ask has dropped $10k (6%) from the opening price — seller is motivated, your offer sets the floor, not the list.
- Current owner paid $60k; list at $150k implies a 150% gain — meaningful room to come down on a strong offer.
Risks & watch-outs
- Watch-outs: built in 1900 — expect roof / HVAC / electrical / plumbing capex.
- Climate carrying-cost: extreme-heat days projected 7→20/yr by 2055 (HVAC capex compounding) — expect insurance premiums to compound above CPI over the hold.
Questions for the listing agent
- It's been on market 100 days. Have you received any prior offers? Is the seller open to a 9% concession, seller financing, or rate buy-down credit?
- Can we see the unit-by-unit rent roll, current vacancy, and any below-market leases? What's the average tenancy length?
- What capital expenditures (roof, boiler, parking lot, exteriors) have been made in the last 5 years, and what's planned in the next 2?
- Built in 1900 — when were the roof, HVAC, electrical panel, plumbing, and water heater last replaced?
- Why hasn't it sold? Are there any deal-killer items the seller is aware of (foundation, flood, title, zoning, code violations)?
- Is there a deadline driving the sale (1031 exchange, divorce, estate, relocation)? That informs how much negotiation room exists.
- Schools are D-rated, which usually means shorter tenancies and higher turnover. Who's the typical renter profile here, and what's been the actual vacancy rate?
- Crime grade is F in this area — have there been break-ins, vandalism, or insurance claims at this property in the last 3 years? What carrier currently insures it and at what premium?
- What's the average days-on-market for RENTAL listings here right now (not sales)? A rising rental-DOM trend means longer vacancies and softer asking-rent achievability than the comps imply.
- What's the recent tenant-quality profile in this submarket — average credit score on applications, eviction rate, late-payment / NSF rate, and stable-employment percentage? A property-management company in the area should have these aggregated.
- How much new apartment / multifamily construction is in the pipeline within 1–3 miles? Heavy new supply (>2% of stock underway) typically softens rents 12–24 months out; light construction supports rent growth.
Investment metrics
- 1% rule
- 1.59% ✓
- Cap rate
- 14.04%
- Cash-on-cash
- 27.66%
- DSCR
- 2.23
- GRM
- 5.3
CMA / ARV
No comps found within radius.
Projected returns pro-forma
10.0% appreciation · 0.51% rent growth · sell at horizon
- IRR
- 43.8%
- Equity multiple
- 4.27×
- Total profit
- $137,493
- Equity at exit
- $135,132
- IRR
- 37.0%
- Equity multiple
- 9.23×
- Total profit
- $345,680
- Equity at exit
- $291,417
Cash invested: $42,000 (down + closing). Projections, not guarantees.
Landlord ↔ Tenant lean methodology
- Overall (STATE)
- 83 Strongly Landlord-Friendly
- State Kentucky
- 83 Strongly Landlord-Friendly · R+16
- County
- — inherits STATE
- City
- — inherits STATE
ZIP-level market 40212
- Home prices YoY
- 11.0%
- Rents YoY
- 0.5%
- Active inventory
- 141
- Price-to-rent
- 10.5×
Monthly cashflow live
- Estimated rent
- $2,380 high interval (Pro) →
- Mortgage (P&I)
- −$787
- Tax from tax record
- −$63 /mo · $756/yr
- Insurance
- −$62
- HOA
- −$0
- Vacancy / Maint / Mgmt
- −$500
- Net cashflow
- $968
Break-even live
Sensitivity live
| Price | -10% $1,053 | -5% $1,011 | +0% $968 | +5% $926 | +10% $883 |
|---|---|---|---|---|---|
| Rent | -10% $780 | -5% $874 | +0% $968 | +5% $1,062 | +10% $1,156 |
| Rate | -1.0pp $1,044 | -0.5pp $1,006 | base $968 | +0.5pp $929 | +1.0pp $890 |
2-unit breakdown (identical units grouped — click to expand)
| Units | Beds | Baths | Est. rent |
|---|---|---|---|
| 2× units | 3 | 1 | $2,380 |
| #1 | 3 | 1 | $1,190 |
| #2 | 3 | 1 | $1,190 |
| Total (2 units) | $2,380 | ||
UW: 25.0% down · 7.5% · 30yr · 1.5% tax · 5.0% vac · 8.0% maint · 8.0% mgmt
Financing live
Cash to close
- Down payment
- $37,500
- Closing costs
- $4,500
- Reserves months
- —
- Total cash needed
- —
Loan-product check · same deal, 3 products live
Conventional
25% down · 7.5% · 30yr
- Down + closing
- —
- Monthly P&I
- —
- Monthly cashflow
- —
- DSCR
- —
- Eligible?
- —
Personal DTI + credit; lowest rate.
DSCR
20% down · 8.5% · 30yr
- Down + closing
- —
- Monthly P&I
- —
- Monthly cashflow
- —
- DSCR
- —
- Eligible?
- —
No personal income docs; deal must DSCR.
Hard money
10% down · 12.0% · 12mo
- Down + closing
- —
- Monthly P&I
- —
- Monthly cashflow
- —
- DSCR
- —
- Eligible?
- —
Short-term bridge; refi at stabilization.
Rent comps 1 comps
| Address | Beds | Baths | Sqft | Rent | $/sqft | DOM | Units | Dist |
|---|---|---|---|---|---|---|---|---|
| 858 S 23rd St Louisville, KY | 5.0 | 1.0 | 2228 | $2,100 | $0.94 | 18d | 1 | 1.18mi |
Listing history 42 events
-
2026-08-18$160,000 Active
-
2026-06-21days on market $150,000 Active 100 DOM
-
2026-06-18days on market $150,000 Active 97 DOM
-
2026-06-17days on market $150,000 Active 96 DOM
-
2026-06-16days on market $150,000 Active 95 DOM
-
2026-06-15days on market $150,000 Active 94 DOM
-
2026-06-13days on market $150,000 Active 92 DOM
-
2026-06-10days on market $150,000 Active 89 DOM
-
2026-06-09days on market $150,000 Active 88 DOM
-
2026-06-08days on market $150,000 Active 87 DOM
-
2026-06-07days on market $150,000 Active 86 DOM
-
2026-06-03days on market $150,000 Active 82 DOM
-
2026-06-02days on market $150,000 Active 81 DOM
-
2026-06-01days on market $150,000 Active 80 DOM
-
2026-05-31days on market $150,000 Active 79 DOM
-
2026-04-07price $150,000
-
2021-03-19soldstatus $60,000
-
2021-03-15soldstatus $60,000 Closed 168-char remark
Show marketing remark (168 chars)
Brick duplex conveniently located to I-64, both units are approximately 1300 sq ft 2 bed 1 bath. Both units are currently rented. One unit updated within the last year.
-
2021-01-26status Pending 168-char remark
Show marketing remark (168 chars)
Brick duplex conveniently located to I-64, both units are approximately 1300 sq ft 2 bed 1 bath. Both units are currently rented. One unit updated within the last year.
-
2021-01-25status Active 168-char remark
Show marketing remark (168 chars)
Brick duplex conveniently located to I-64, both units are approximately 1300 sq ft 2 bed 1 bath. Both units are currently rented. One unit updated within the last year.
-
2021-01-12status Pending 168-char remark
Show marketing remark (168 chars)
Brick duplex conveniently located to I-64, both units are approximately 1300 sq ft 2 bed 1 bath. Both units are currently rented. One unit updated within the last year.
-
2021-01-12$70,000 Active 168-char remark
Show marketing remark (168 chars)
Brick duplex conveniently located to I-64, both units are approximately 1300 sq ft 2 bed 1 bath. Both units are currently rented. One unit updated within the last year.
-
2020-05-16historical
-
2020-04-10$67,000 Active
-
2020-01-28soldstatus $47,000
-
2020-01-24soldstatus $47,000 Closed
-
2019-12-23status Pending
-
2019-12-05$65,000 Active
-
2013-01-07soldstatus $15,000
-
2012-12-18soldstatus $15,000
-
2012-10-08$25,000
-
2010-07-07historical
-
2010-01-07$39,900
-
2009-12-31historical
-
2009-05-28$39,900
-
2009-04-20historical
-
2009-03-16$70,600
-
2003-08-04$29,900
-
2000-11-29soldstatus $69,875
-
2000-08-16$69,959
-
1999-11-30soldstatus $49,000
-
1999-08-20$52,500
ⓘ Source: listings_history table (triggers on properties + properties_extension) + one-shot
backfill from property_details.listing_events for pre-trigger history.
Tax reassessment forecast KY · Resets to sale price
- Current annual tax
- $756 · $63/mo
- Projected year-2 tax
- $1,290 · $108/mo
- Expected delta
- +$534/yr (+$44/mo · 70.6%)
ⓘ Screening estimate from a state-policy table — verify with the county assessor before closing.
Climate risk First Street
- Flood 1/10 Low FEMA zone X (unshaded) · 0% chance over 30 yrs
- Wildfire 1/10 Low
- Heat 5/10 Major 7 d/yr ≥105°F today · 20 d/yr by 30 yrs out
- Wind 2/10 Low 100% chance of damaging wind over 30 yrs
- Air quality 2/10 Low 1 unhealthy d/yr today · 2 by 30 yrs out
Nearby sold comps map
Loading sold comps map…
Walkable amenities ~0.75 mi
Loading nearby amenities…
Taxation est. · year 1
- Rental income
- $28,560
- − Mortgage interest
- −$8,402
- − Property taxes
- −$756
- − Insurance
- −$750
- − Repairs & maintenance
- −$2,285
- − Management
- −$2,285
- − Depreciation
- −$4,364
- Taxable income
- $9,718
- Est. tax owed @ 24.0%
- −$2,332
- After-tax cash flow
- $9,285/yr
For passive investors: Depreciation is non-cash, so a rental often shows a tax loss while cash-flowing — sheltering income. Rental losses are passive: they offset passive income freely, and up to $25,000/yr can offset ordinary (W-2) income if you actively participate and your MAGI is under $100k (phasing out to $0 by $150k); unused losses carry forward. On sale, claimed depreciation is recaptured at up to 25%, and gains may owe capital-gains tax (a 1031 exchange can defer both). Figures are a year-1 estimate at your 24.0% rate — not tax advice; consult a CPA.
Schools (NCES district)
- District
- Jefferson County
- NCES district ID
- 2102990
- Math proficiency
- 19% ▼ -17.00%
- Reading proficiency
- 35% ▼ -11.00%
- Median HH income
- $47,885
- Composite
- 23.45/100
- National rank
- #7884
- State rank
- #121 of 165 in KY
Livability — Louisville
- Score
- 63/100
- State rank
- #333
- US rank
- #15887
Category grades
Schools grade is shown separately in the Schools card above.
Census & demographics
- Census place
- Louisville, KY
- County
- Jefferson County · 790,184 people
- City population
- 769,292
- Metro
- Louisville/Jefferson County, KY-IN
- Population (ZIP)
- 14,661
- Household income
- $35,753
- Rent vs Own
- Severe rent burden
- 1148.0
Population outlook (Jefferson County) Hauer SSP2
- Today (2025)
- 823,112 people
- By 2030
- 849,343 · +3.2%
- By 2040
- 895,696 · +8.8%
- By 2050
- 933,630 · +13.4%
- By 2075
- 1,028,262 · +24.9%
- By 2100
- 1,072,675 · +30.3%
Race, ethnicity, and origin ACS 2023
- Neighborhood character
- Majority Black (60%)
- Race & ethnicity
- Black 60% White 37% Two or more races 2% Hispanic / Latino 1%
- Common ancestry
- Slovak 1% Lithuanian 1% Iranian 1%
- Foreign-born
- 1% · Canada
- Languages at home
- 98% English-only · Spanish 1%
Political lean MEDSL · Jefferson
- 2024 margin
- D (+16.6) · D 57.4% · R 40.9% · Other 1.7%
- 2008→2024 swing
- +4.5pp toward D · 2008: 12.0pp · 2024: 16.6pp
- All cycles
- 2024: D+16.6 2020: D+20.1 2016: D+13.3 2012: D+11.1 2008: D+12.0
Not yet ingested
- Civics
- —
Market trends
- HPI YoY
- ▲ 29.02%
- Current HPI
- 293.2624
- Rent YoY
- ▲ 0.51%
- Metro
- Louisville/Jefferson County, KY-IN
- State GDP YoY
- ▲ 1.81%
- F500 in state
- 4
Industry mix (Fortune 500 HQ in KY)
| Industry | F500 HQs | Revenue |
|---|---|---|
| Healthcare | 1 | $118B |
|
||
| Food / Beverage | 1 | $7B |
|
||
Price history
+204.8% since first listed28 events — show timeline
- 2026-08-18 Listed $160,000 Metro Search MLS
- 2026-04-07 Price Changed $150,000 Metro Search MLS
- 2021-03-19 Sold (Public Records) $60,000 Public Records
- 2021-03-15 Sold (MLS) $60,000 Metro Search MLS
- 2021-01-26 Pending — Metro Search MLS
- 2021-01-25 Relisted — Metro Search MLS
- 2021-01-12 Pending — Metro Search MLS
- 2021-01-12 Listed $70,000 Metro Search MLS
- 2020-05-16 Listing Removed — Metro Search MLS
- 2020-04-10 Listed $67,000 Metro Search MLS
- 2020-01-28 Sold (Public Records) $47,000 Public Records
- 2020-01-24 Sold (MLS) $47,000 Metro Search MLS
- 2019-12-23 Pending — Metro Search MLS
- 2019-12-05 Listed $65,000 Metro Search MLS
- 2013-01-07 Sold (Public Records) $15,000 Public Records
- 2012-12-18 Sold (MLS) $15,000 Metro Search MLS
- 2012-10-08 Listed $25,000 Metro Search MLS
- 2010-07-07 Listing Removed — Metro Search MLS
- 2010-01-07 Listed $39,900 Metro Search MLS
- 2009-12-31 Listing Removed — Metro Search MLS
- 2009-05-28 Listed $39,900 Metro Search MLS
- 2009-04-20 Listing Removed — Metro Search MLS
- 2009-03-16 Listed $70,600 Metro Search MLS
- 2003-08-04 Listed $29,900 Metro Search MLS
- 2000-11-29 Sold (MLS) $69,875 Metro Search MLS
- 2000-08-16 Listed $69,959 Metro Search MLS
- 1999-11-30 Sold (MLS) $49,000 Metro Search MLS
- 1999-08-20 Listed $52,500 Metro Search MLS
Property tax history
+2.2%/yrLatest (2025): $756 · -1.9% YoY. Source: county tax records.
Cash-flow waterfall
monthlySold comps — $/sqft
last 12 mo · ≤1 miLoading sold comps…