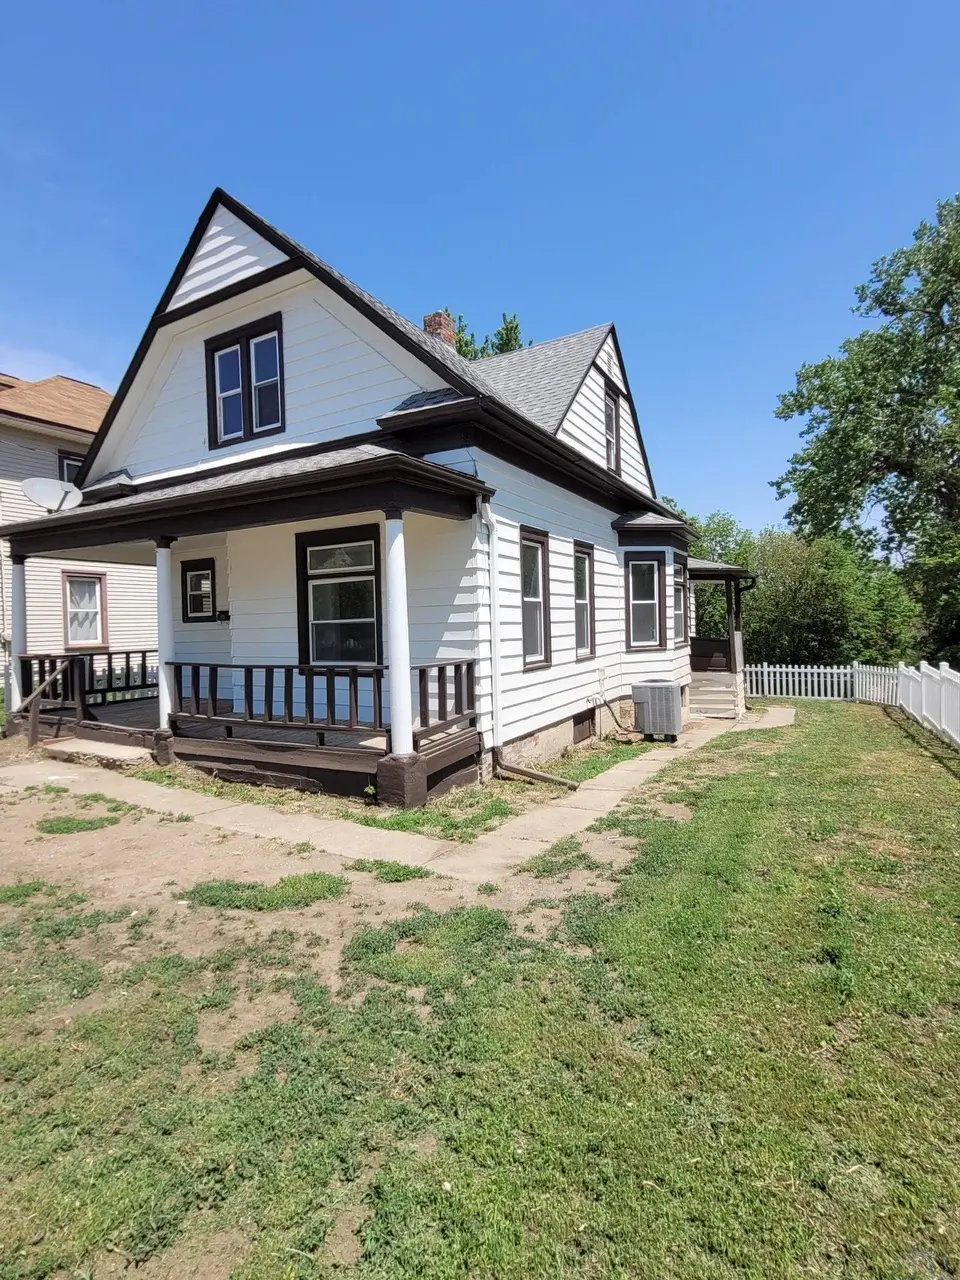
2314 Court St · Sioux City, IA
Flood risk 1/10 · Minimal
- FEMA flood zone
- X (unshaded)
- Chance of flooding over 30 yrs
- 0.0%
- Est. flood insurance / yr
- $473 – $860
Fire risk 1/10 · Minimal
- Est. fire insurance / yr
- $902 – $1,676
Heat risk 3/10 · Minor
- Hot days now (above 103°F)
- 7 days/yr
- Hot days in 30 yrs
- 15 days/yr
Wind risk 2/10 · Minimal
- Chance of severe wind over 30 yrs
- —
Air-quality risk 1/10 · Minimal
- Unhealthy air days now
- 0 days/yr
- Unhealthy air days in 30 yrs
- 0 days/yr
Risk factors via First Street. Map © Google.
Why this score? — see what drove the B grade
The composite is a weighted blend of 9 inputs, each scored 0–100. Each bar is that input's sub-score; the figure is the points it added to the 100-point composite (weight × sub-score).
- Cash flow +27.4/30.0
- ARV discount +15.0/15.0
- DSCR +9.6/10.0
- 1% rule +8.0/10.0
- Schools +4.7/10.0
- Livability +3.9/5.0
- Rent growth +2.5/5.0
- Condition / age +2.5/5.0
- Appreciation +0.0/10.0
$104,500
🖨 Deal sheet 📄 Offer letter ✓ Due diligence
Listing remarks
This is a unique opportunity! Selling as-is cash or conventional $104,500 OR seller will negotiate work and price if you would like it move-in ready and depending on the work and price negotiated, would be willing to consider FHA. This home has a lot of potential with 4 bedrooms, 2 baths and a nice sized fenced-in yard.
Key facts
- 4,356 sq ft lot
- Built 1910
- Listed 15 days
Property features AI
Exterior
- Parking: No dedicated parking
- Utilities: Public water; Public sewer
- Home design: Single-family residential property
- Construction: Aluminum siding
- Exterior features: Front porch; Shingle roof
Interior
- Bathrooms: 2 full bathrooms
- Heating & cooling: Natural gas forced-air heating
- Interior features: Full, unfinished basement; Fixer condition
Neighborhood map
What this means for you Summary
Snapshot
- This is a 4-bed/2.0-bath single-family listed at $104k.
Deal economics
- At list price, monthly cash flow is $304 ($4k/yr) — positive.
- The deal already cash-flows at list — no discount required.
- Meets the 1% rule at list price ($1k rent vs $104k).
- Recommended offer: $103k (1.5% below list) — sets the bar for market timing.
- Cap rate 9.8% vs local median 3.7% in Sioux City — top-decile yield for the area; either an underpriced asset or a hidden risk that comps aren't pricing in. Stress-test before assuming the spread holds.
Location & tenants
- Location reads 78/100 on livability (#138 in IA, #2,544 nationally) — a middle-class / working-renter tenant base. Strengths: cost of living A+, housing A+, health & safety A+; Watch: crime F, commute F.
- Sioux City Community School District (urban): math 54% / reading 57% proficiency, ranked #264 of 289 in IA (top 91%) — acceptable for families but not a draw, mixed tenant base, ~2y average lease.
- Zoned schools: Bryant Elementary School (math 63% / reading 59%, grade B, #385 of 616 statewide, top 63%, 571 students, 74% FRL); North Middle School (math 46% / reading 50%, grade C-, #224 of 246 statewide, top 91%, 1,224 students, 74% FRL); North High School (math 53% / reading 57%, grade C, #289 of 336 statewide, top 86%, 1,634 students, 64% FRL) — zoned schools average 71% FRL vs 54% district-wide (17 pts higher); higher-poverty schools than district average — tighter screening recommended.
- Market conditions: 120 active listings in the ZIP; 4 comparable units currently listed for rent nearby; rentals lingering (median 44d on market — plan ~5-8 weeks vacancy on turnover, expect pricing pressure); 100% of comp listings sitting > 30 days — soft ceiling on asking rent; solid renter incomes; 170 units permitted in Woodbury County in 2024 (90 in 5+ unit buildings).
Forward outlook
- Local home prices are declining (-3.0%/yr); year-one equity from $722 of loan paydown is wiped out by about $3k of value loss. Plan a longer hold.
- At projected returns (-3.0% appreciation + 3.0% rent growth), your $29k cash investment doubles in ~10 years — after that, you're playing with house money.
Negotiation context
- It's been on market 15 days — a 2% lower offer ($103k) is reasonable based on typical stale-listing flexibility.
- Current owner paid $50k; list at $104k implies a 109% gain — meaningful room to come down on a strong offer.
Risks & watch-outs
- Watch-outs: built in 1910 — expect roof / HVAC / electrical / plumbing capex.
Questions for the listing agent
- Built in 1910 — when were the roof, HVAC, electrical panel, plumbing, and water heater last replaced?
- Is there a deadline driving the sale (1031 exchange, divorce, estate, relocation)? That informs how much negotiation room exists.
- Crime grade is F in this area — have there been break-ins, vandalism, or insurance claims at this property in the last 3 years? What carrier currently insures it and at what premium?
- What's the average days-on-market for RENTAL listings here right now (not sales)? A rising rental-DOM trend means longer vacancies and softer asking-rent achievability than the comps imply.
- What's the recent tenant-quality profile in this submarket — average credit score on applications, eviction rate, late-payment / NSF rate, and stable-employment percentage? A property-management company in the area should have these aggregated.
- How much new for-sale + rental construction is in the pipeline within 1–3 miles? Heavy new supply typically softens prices + rents 12–24 months out; constrained supply supports both.
Investment metrics
- 1% rule
- 1.30% ✓
- Cap rate
- 9.79%
- Cash-on-cash
- 12.48%
- DSCR
- 1.56
- GRM
- 6.4
CMA / ARV
- ARV (on-the-fly)
- $192,200
- Comps found
- 12
Show comp detail 12 sales within ~0.75 mi
| Address | Dist | Beds/Ba | Sqft | Sold | Price | $/sf | Match |
|---|---|---|---|---|---|---|---|
| 1203 25th St | 0.12mi | 4/3.0 | 1,655 (+7%) | 3mo | $195,000 | $118 | 76 |
| 710 26th St | 0.35mi | 3/2.0 (-1) | 1,568 (+1%) | 2mo | $220,000 | $140 | 75 |
| 1305 Hill Ave | 0.32mi | 3/1.0 (-1) | 1,522 (-2%) | 0mo | $170,000 | $112 | 73 |
| 814 23rd St | 0.23mi | 3/1.5 (-1) | 1,462 (-6%) | 2mo | $140,000 | $96 | 71 |
| 1335 21st St | 0.24mi | 3/1.5 (-1) | 1,454 (-6%) | 4mo | $194,000 | $133 | 68 |
| 1415 27 St | 0.31mi | 4/1.0 | 1,416 (-9%) | 0mo | $133,000 | $94 | 67 |
| 2318 Douglas St | 0.54mi | 3/2.0 (-1) | 1,528 (-1%) | 5mo | $135,000 | $88 | 64 |
| 3134 Jones St | 0.75mi | 3/2.5 (-1) | 1,568 (+1%) | 0mo | $215,000 | $137 | 56 |
| 1309 29th St | 0.46mi | 3/2.0 (-1) | 1,740 (+12%) | 3mo | $215,000 | $124 | 50 |
| 922 30th St | 0.52mi | 3/1.0 (-1) | 1,393 (-10%) | 6mo | $231,000 | $166 | 44 |
| 2741 Chambers St | 0.57mi | 3/1.0 (-1) | 1,723 (+11%) | 2mo | $207,900 | $121 | 44 |
| 3110 Norman Dr | 0.67mi | 3/3.0 (-1) | 1,768 (+14%) | 3mo | $316,000 | $179 | 34 |
Match score weights: distance 35% · size 25% · config 20% · recency 20%. Top-matched comps best support the ARV.
Projected returns pro-forma
-3.0% appreciation · 3.0% rent growth · sell at horizon
- IRR
- 2.2%
- Equity multiple
- 1.09×
- Total profit
- $2,500
- Equity at exit
- $15,581
- IRR
- 11.8%
- Equity multiple
- 1.93×
- Total profit
- $27,337
- Equity at exit
- $9,035
Cash invested: $29,260 (down + closing). Projections, not guarantees.
Landlord ↔ Tenant lean methodology
- Overall (STATE)
- 83 Strongly Landlord-Friendly
- State Iowa
- 83 Strongly Landlord-Friendly · R+6
- County
- — inherits STATE
- City
- — inherits STATE
ZIP-level market 51104
- Home prices YoY
- -34.4%
- Active inventory
- 120
- Price-to-rent
- 6.4×
Monthly cashflow live
- Estimated rent
- $1,359 medium interval (Pro) →
- Mortgage (P&I)
- −$548
- Tax from tax record
- −$177 /mo · $2,128/yr
- Insurance
- −$44
- HOA
- −$0
- Vacancy / Maint / Mgmt
- −$285
- Net cashflow
- $304
Break-even live
UW: 25.0% down · 7.5% · 30yr · 1.5% tax · 5.0% vac · 8.0% maint · 8.0% mgmt
Financing live
Cash to close
- Down payment
- $26,125
- Closing costs
- $3,135
- Reserves months
- —
- Total cash needed
- —
Loan-product check · same deal, 3 products live
Conventional
25% down · 7.5% · 30yr
- Down + closing
- —
- Monthly P&I
- —
- Monthly cashflow
- —
- DSCR
- —
- Eligible?
- —
Personal DTI + credit; lowest rate.
DSCR
20% down · 8.5% · 30yr
- Down + closing
- —
- Monthly P&I
- —
- Monthly cashflow
- —
- DSCR
- —
- Eligible?
- —
No personal income docs; deal must DSCR.
Hard money
10% down · 12.0% · 12mo
- Down + closing
- —
- Monthly P&I
- —
- Monthly cashflow
- —
- DSCR
- —
- Eligible?
- —
Short-term bridge; refi at stabilization.
Rent comps 4 comps
| Address | Beds | Baths | Sqft | Rent | $/sqft | DOM | Units | Dist |
|---|---|---|---|---|---|---|---|---|
| 1116 13th St Sioux City, IA | 3.0 | 1.0 | 1056 | $1,100 | $1.04 | 44d | 1 | 0.70mi |
| 1114 13th St Unit 1116 Sioux City, IA | 3.0 | 1.0 | 1056 | $1,100 | $1.04 | 43d | 1 | 0.70mi |
| 610 13th St Sioux City, IA | 2.0–3.0 | 1.0–1.5 | 1329 | $1,247 | $0.94 | 43d | 3 | 0.79mi |
| 228 36th St Sioux City, IA | 3.0 | 2.0 | 1092 | $1,500 | $1.37 | 43d | 1 | 1.39mi |
Listing history 7 events
-
2026-06-05statusdays on market $104,500 Pending 15 DOM
-
2026-06-02days on market $104,500 Active 14 DOM
-
2026-06-01days on market $104,500 Active 13 DOM
-
2026-05-31days on market $104,500 Active 12 DOM
-
2026-05-30days on market $104,500 Active 11 DOM
-
2026-05-18$104,500 Active
-
2026-04-06soldstatus $50,000
ⓘ Source: listings_history table (triggers on properties + properties_extension) + one-shot
backfill from property_details.listing_events for pre-trigger history.
Tax reassessment forecast IA · Partial reset (capped growth)
- Current annual tax
- $2,128 · $177/mo
- Projected year-2 tax
- $2,128 · $177/mo
- Expected delta
- $0/yr ($0/mo · 0.0%)
ⓘ Screening estimate from a state-policy table — verify with the county assessor before closing.
Climate risk First Street
- Flood 1/10 Low FEMA zone X (unshaded) · 0% chance over 30 yrs
- Wildfire 1/10 Low
- Heat 3/10 Moderate 7 d/yr ≥103°F today · 15 d/yr by 30 yrs out
- Wind 2/10 Low
- Air quality 1/10 Low 0 unhealthy d/yr today · 0 by 30 yrs out
Nearby sold comps map
Loading sold comps map…
Walkable amenities ~0.75 mi
Loading nearby amenities…
Taxation est. · year 1
- Rental income
- $16,302
- − Mortgage interest
- −$5,854
- − Property taxes
- −$2,128
- − Insurance
- −$522
- − Repairs & maintenance
- −$1,304
- − Management
- −$1,304
- − Depreciation
- −$3,040
- Taxable income
- $2,150
- Est. tax owed @ 24.0%
- −$516
- After-tax cash flow
- $3,136/yr
For passive investors: Depreciation is non-cash, so a rental often shows a tax loss while cash-flowing — sheltering income. Rental losses are passive: they offset passive income freely, and up to $25,000/yr can offset ordinary (W-2) income if you actively participate and your MAGI is under $100k (phasing out to $0 by $150k); unused losses carry forward. On sale, claimed depreciation is recaptured at up to 25%, and gains may owe capital-gains tax (a 1031 exchange can defer both). Figures are a year-1 estimate at your 24.0% rate — not tax advice; consult a CPA.
Schools (NCES district)
- District
- Sioux City Community School District
- NCES district ID
- 1926400
- Math proficiency
- 54% ▼ -7.00%
- Reading proficiency
- 57% ▼ -2.00%
- Median HH income
- $44,967
- Composite
- 46.86/100
- National rank
- #2371
- State rank
- #264 of 289 in IA
Livability — Sioux City
- Score
- 78/100
- State rank
- #138
- US rank
- #2544
Category grades
Schools grade is shown separately in the Schools card above.
Census & demographics
- Census place
- Sioux City, IA
- County
- Woodbury County · 51,789 people
- City population
- 51,789
- Metro
- Sioux City, IA-NE-SD
- Population (ZIP)
- 23,197
- Household income
- $75,362
- Rent vs Own
- Severe rent burden
- 600.0
Population outlook (Woodbury County) Hauer SSP2
- Today (2025)
- 103,226 people
- By 2030
- 103,060 · -0.2%
- By 2040
- 102,533 · -0.7%
- By 2050
- 102,788 · -0.4%
- By 2075
- 107,227 · +3.9%
- By 2100
- 113,980 · +10.4%
Race, ethnicity, and origin ACS 2023
- Neighborhood character
- Majority White (64%)
- Race & ethnicity
- White 64% Hispanic / Latino 20% Two or more races 14% Black 5% Asian 4% Native American 2%
- Hispanic origin (detail)
- Mexican 16%
- Common ancestry
- Portuguese 4% Iranian 2% Romanian 2%
- Foreign-born
- 12% · Canada, Vietnam, United Kingdom
- Languages at home
- 80% English-only · Spanish 13% Other Asian/Pacific 2% Vietnamese 2%
Political lean MEDSL · Woodbury
- 2024 margin
- Strong R (+23.0) · D 37.8% · R 60.9% · Other 1.3%
- 2008→2024 swing
- -22.5pp toward R · 2008: -0.5pp · 2024: -23.0pp
- All cycles
- 2024: R+23.0 2020: R+15.5 2016: R+19.9 2012: R+0.2 2008: R+0.5
Not yet ingested
- Civics
- —
Market trends
- HPI YoY
- ▼ -114.54%
- Current HPI
- 218.5989
- Rent YoY
- —
- Metro
- Sioux City, IA-NE-SD
- State GDP YoY
- ▲ 2.48%
- F500 in state
- 4
Industry mix (Fortune 500 HQ in IA)
| Industry | F500 HQs | Revenue |
|---|---|---|
| Financial Services | 1 | $16B |
|
||
| Retail / Convenience | 1 | $15B |
|
||
Price history
+109.0% since first listed2 events — show timeline
- 2026-05-18 Listed $104,500 NWIA
- 2026-04-06 Sold (Public Records) $50,000 Public Records
Property tax history
+12.3%/yrLatest (2025): $2,128 · +23.1% YoY. Source: county tax records.
Cash-flow waterfall
monthlySold comps — $/sqft
last 12 mo · ≤1 miLoading sold comps…