2777 Clinton Dr · Houston, TX
Flood risk 7/10 · Major
- FEMA flood zone
- X (unshaded)
- Chance of flooding over 30 yrs
- 0.75%
- Est. flood insurance / yr
- $507 – $1,088
Fire risk 1/10 · Minimal
- Est. fire insurance / yr
- $1,222 – $2,270
Heat risk 9/10 · Severe
- Hot days now (above 109°F)
- 7 days/yr
- Hot days in 30 yrs
- 24 days/yr
Wind risk 9/10 · Severe
- Chance of severe wind over 30 yrs
- 99.0%
Air-quality risk 3/10 · Minor
- Unhealthy air days now
- 2 days/yr
- Unhealthy air days in 30 yrs
- 3 days/yr
Risk factors via First Street. Map © Google.
Why this score? — see what drove the D- grade
The composite is a weighted blend of 9 inputs, each scored 0–100. Each bar is that input's sub-score; the figure is the points it added to the 100-point composite (weight × sub-score).
- ARV discount +11.1/15.0
- Appreciation +10.0/10.0
- Cash flow +3.9/30.0
- Livability +3.7/5.0
- Rent growth +3.6/5.0
- Schools +2.7/10.0
- Condition / age +2.5/5.0
- 1% rule +1.3/10.0
- DSCR +0.0/10.0
$416,900
🖨 Deal sheet 📄 Offer letter ✓ Due diligence
Listing remarks MLS
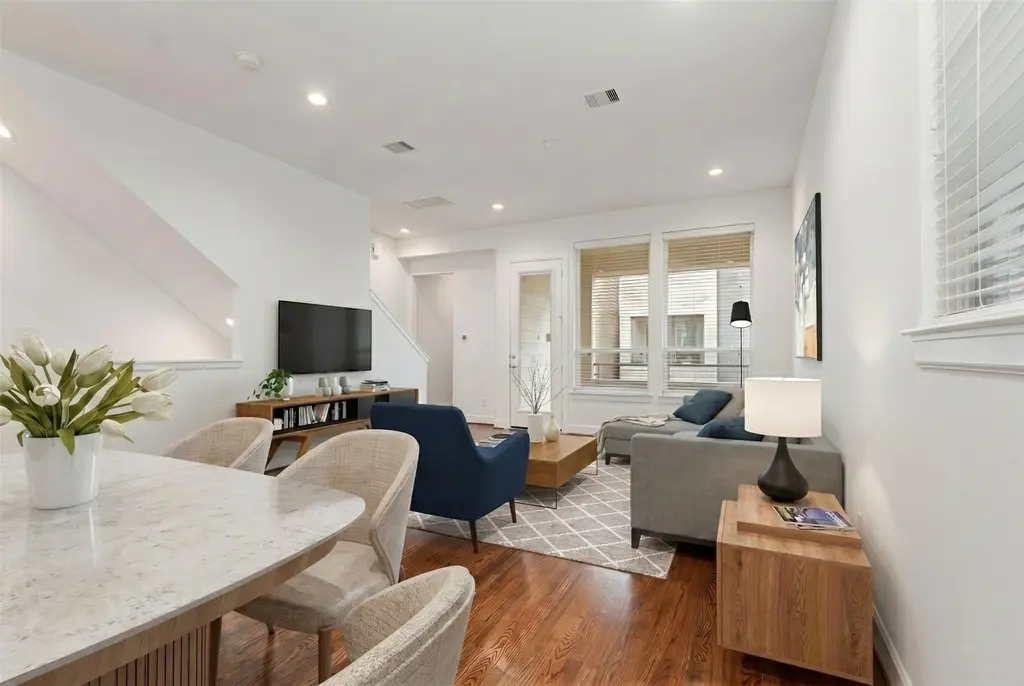
Experience modern urban living in this beautifully designed 3-story freestanding home located in EaDo Edge, just minutes from Downtown Houston. This home welcomes you with a front gated yard and private entry, blending comfort with convenience. Inside, enjoy contemporary designer finishes, an open living concept, and a private balcony ideal for morning coffee or evening wind-downs. A versatile office nook adds functionality for today’s lifestyle. Situated in one of Houston’s most rapidly developing areas, the community offers guest parking, courtyards, and dog parks, creating the perfect balance of city energy and neighborhood charm.
Key facts
- Guest parking
- Dog parks
- Front gated yard
Tags
Neighborhood map
What this means for you Summary
Snapshot
- This is a 3-bed/3.5-bath single-family listed at $417k.
Deal economics
- At list price, monthly cash flow is $-1k ($-15k/yr) — negative.
- To cash-flow at today's rent, offer at most $195k (53.3% below list).
- To meet the 1% rule (rent ≥ 1% of price), the offer needs to be $263k (37.0% below list).
- Recommended offer: $195k (53.3% below list) — sets the bar for cash-flow.
Location & tenants
- Location reads 74/100 on livability (#184 in TX, #4,771 nationally) — a middle-class / working-renter tenant base. Strengths: amenities A+, cost of living A+, housing A+; Watch: schools D, crime F.
- Houston ISD (urban): math 27% / reading 35% proficiency, ranked #593 of 826 in TX (top 72%) — families likely to look elsewhere, expect single-tenant / working-renter base with shorter leases; 71% free/reduced lunch — lower-income household profile, screen leases tightly.
- Market conditions: Rents rising fast (+4.3%/yr); 337 active listings in the ZIP; 40 comparable units currently listed for rent nearby; rentals leasing fast (median 11d on market — plan ~1-2 weeks tenant-placement turnaround); 42% of comp listings sitting > 30 days — soft ceiling on asking rent; 29,883 units permitted in Harris County in 2024 (8,621 in 5+ unit buildings).
- At $2,626/mo this rent would consume 63% of the median local household income ($50k/yr) (locally 969% of renters already pay >50% of income on rent) — very limited rent-growth headroom before tenants either downsize or default.
Forward outlook
- In year one you build about $45k of equity ($3k loan paydown + $42k appreciation (10.0% local appreciation)).
- Harris County population projected at +47% by 2050 — long-run rental-demand tailwind backs the buy-and-hold thesis.
- By year 2, paydown + projected appreciation supports a ~$72k cash-out refi (75% LTV) — recoverable capital for the next deal without selling this one.
Negotiation context
- It's been on market 62 days — a 6% lower offer ($392k) is reasonable based on typical stale-listing flexibility.
Risks & watch-outs
- Watch-outs: flood insurance adds $66/mo.
- Climate carrying-cost: major flood risk; severe wind risk, 99% chance of damaging wind over 30y; extreme-heat days projected 7→24/yr by 2055 (HVAC capex compounding) — expect insurance premiums to compound above CPI over the hold.
Questions for the listing agent
- What do current leases actually rent for vs. the listed asking? Can we see a recent rent roll and the last 12 months of T-12 income?
- It's been on market 62 days. Have you received any prior offers? Is the seller open to a 53% concession, seller financing, or rate buy-down credit?
- What's the actual annual flood-insurance premium (NFIP or private), and is the property in a SFHA with mandatory coverage?
- What does the HOA fee cover, when was the last increase, and are there any pending special assessments or reserve-fund shortfalls?
- Why hasn't it sold? Are there any deal-killer items the seller is aware of (foundation, flood, title, zoning, code violations)?
- Is there a deadline driving the sale (1031 exchange, divorce, estate, relocation)? That informs how much negotiation room exists.
- Schools are D-rated, which usually means shorter tenancies and higher turnover. Who's the typical renter profile here, and what's been the actual vacancy rate?
- Crime grade is F in this area — have there been break-ins, vandalism, or insurance claims at this property in the last 3 years? What carrier currently insures it and at what premium?
- The area grade is low — what's the realistic commute time and amenity access for the typical tenant pool here? Any planned neighborhood developments (good or bad) we should know about?
- What's the average days-on-market for RENTAL listings here right now (not sales)? A rising rental-DOM trend means longer vacancies and softer asking-rent achievability than the comps imply.
- What's the recent tenant-quality profile in this submarket — average credit score on applications, eviction rate, late-payment / NSF rate, and stable-employment percentage? A property-management company in the area should have these aggregated.
- How much new for-sale + rental construction is in the pipeline within 1–3 miles? Heavy new supply typically softens prices + rents 12–24 months out; constrained supply supports both.
Investment metrics
- 1% rule
- 0.63% ✗
- Cap rate
- 2.86%
- Cash-on-cash
- -12.26%
- DSCR
- 0.45
- GRM
- 13.2
CMA / ARV
- ARV (median comp)
- $453,003
- List price
- $416,900
- Delta
- -7.97%
- Verdict
- FAIR
- Comps
- 20 within 1.0 mi
Show comp detail 12 sales within ~0.75 mi
| Address | Dist | Beds/Ba | Sqft | Sold | Price | $/sf | Match |
|---|---|---|---|---|---|---|---|
| 411 Grove St Unit C | 0.29mi | 3/2.5 | 1,903 (+0%) | 2mo | $375,000 | $197 | 81 |
| 3209 Baer St Unit A | 0.33mi | 3/3.5 | 1,990 (+5%) | 1mo | $464,900 | $234 | 76 |
| 3209 Baer St Unit B | 0.33mi | 3/3.5 | 1,996 (+5%) | 1mo | $464,900 | $233 | 75 |
| 711 Schwartz St | 0.17mi | 3/3.5 | 1,692 (-11%) | 2mo | $309,000 | $183 | 72 |
| 2706 Fox St | 0.44mi | 3/3.5 | 2,012 (+6%) | 1mo | $499,900 | $248 | 69 |
| 413 N Nagle St Unit B | 0.42mi | 3/3.5 | 1,744 (-8%) | 5mo | $375,000 | $215 | 63 |
| 3306 Cline St | 0.33mi | 3/3.5 | 2,154 (+13%) | 1mo | $390,000 | $181 | 61 |
| 3415 Stonewall St | 0.68mi | 3/2.5 | 1,969 (+4%) | 1mo | $369,000 | $187 | 58 |
| 3409 Stonewall St | 0.68mi | 3/2.5 | 1,969 (+4%) | 1mo | $349,900 | $178 | 57 |
| 3407 Stonewall St | 0.67mi | 3/2.5 | 1,969 (+4%) | 6mo | $379,900 | $193 | 54 |
| 3413 Stonewall St | 0.68mi | 3/2.5 | 1,969 (+4%) | 6mo | $379,900 | $193 | 53 |
| 3109 Stonewall St | 0.61mi | 3/2.5 | 1,645 (-13%) | 3mo | $349,900 | $213 | 43 |
Match score weights: distance 35% · size 25% · config 20% · recency 20%. Top-matched comps best support the ARV.
Projected returns pro-forma
10.0% appreciation · 4.27% rent growth · sell at horizon
- IRR
- 15.6%
- Equity multiple
- 2.29×
- Total profit
- $150,593
- Equity at exit
- $375,577
- IRR
- 15.4%
- Equity multiple
- 5.41×
- Total profit
- $514,413
- Equity at exit
- $809,945
Cash invested: $116,732 (down + closing). Projections, not guarantees.
Landlord ↔ Tenant lean methodology
- Overall (STATE)
- 87 Strongly Landlord-Friendly
- State Texas
- 87 Strongly Landlord-Friendly · R+5
- County
- — inherits STATE
- City
- — inherits STATE
ZIP-level market 77020
- Home prices YoY
- 29.1%
- Rents YoY
- 4.3%
- Active inventory
- 337
- Price-to-rent
- 13.2×
Monthly cashflow live
- Estimated rent
- $2,626 high interval (Pro) →
- Mortgage (P&I)
- −$2,186
- Tax from tax record
- −$724 /mo · $8,684/yr
- Insurance
- −$174
- Flood insurance flood zone
- −$66 /mo · $798/yr
- HOA
- −$183
- Vacancy / Maint / Mgmt
- −$551
- Net cashflow
- $-1,259
Break-even live
UW: 25.0% down · 7.5% · 30yr · 1.5% tax · 5.0% vac · 8.0% maint · 8.0% mgmt
Financing live
Cash to close
- Down payment
- $104,225
- Closing costs
- $12,507
- Reserves months
- —
- Total cash needed
- —
Loan-product check · same deal, 3 products live
Conventional
25% down · 7.5% · 30yr
- Down + closing
- —
- Monthly P&I
- —
- Monthly cashflow
- —
- DSCR
- —
- Eligible?
- —
Personal DTI + credit; lowest rate.
DSCR
20% down · 8.5% · 30yr
- Down + closing
- —
- Monthly P&I
- —
- Monthly cashflow
- —
- DSCR
- —
- Eligible?
- —
No personal income docs; deal must DSCR.
Hard money
10% down · 12.0% · 12mo
- Down + closing
- —
- Monthly P&I
- —
- Monthly cashflow
- —
- DSCR
- —
- Eligible?
- —
Short-term bridge; refi at stabilization.
Rent comps 40 comps
| Address | Beds | Baths | Sqft | Rent | $/sqft | DOM | Units | Dist |
|---|---|---|---|---|---|---|---|---|
| 2905 Baer St Unit 1047953P Houston, TX | 3.0 | 2.5 | 1991 | $3,094 | $1.55 | 5d | 1 | 0.22mi |
| 611 Sydnor St Houston, TX | 3.0 | 4.0 | 2157 | $2,400 | $1.11 | 43d | 1 | 0.23mi |
| 91 Jensen Dr Houston, TX | 3.0 | 1.0–2.5 | 970 | $3,420 | $3.52 | 1d | 69 | 0.27mi |
| 308 Grove St Houston, TX | 3.0 | 3.0 | 1701 | $2,350 | $1.38 | 7d | 1 | 0.29mi |
| 800 Middle St Houston, TX | 1.0–4.0 | 1.0–2.0 | 1003 | $1,593 | $1.59 | 5d | 1 | 0.38mi |
| 3410 Baer St Houston, TX | 3.0 | 4.0 | 2040 | $3,500 | $1.72 | 43d | 1 | 0.40mi |
| 3419 Gillespie St Houston, TX | 3.0 | 3.5 | 2168 | $2,300 | $1.06 | 43d | 1 | 0.40mi |
| 2115 Runnels St Unit 3187 Houston, TX | 3.0 | 2.0 | 1839 | $3,013 | $1.64 | 3d | 1 | 0.46mi |
| 2115 Runnels St Unit 3174 Houston, TX | 3.0 | 2.0 | 1839 | $3,056 | $1.66 | 12d | 1 | 0.46mi |
| 2115 Runnels St Unit 2148 Houston, TX | 3.0 | 2.0 | 1839 | $3,045 | $1.66 | 11d | 1 | 0.46mi |
| 2315 Navigation Blvd Houston, TX | 1.0–2.0 | 1.0–2.5 | 943 | $3,500 | $3.71 | 1d | 61 | 0.54mi |
| 2404 Navigation Blvd Unit 2441 Houston, TX | 2.0 | 2.0 | 1309 | $2,320 | $1.77 | 10d | 1 | 0.56mi |
| 2404 Navigation Blvd Unit 2187 Houston, TX | 2.0 | 2.0 | 1309 | $2,288 | $1.75 | 3d | 1 | 0.56mi |
| 2404 Navigation Blvd Unit 422 Houston, TX | 2.0 | 2.0 | 1309 | $2,296 | $1.75 | 7d | 1 | 0.56mi |
| 2404 Navigation Blvd Unit 424 Houston, TX | 2.0 | 2.0 | 1309 | $2,296 | $1.75 | 5d | 1 | 0.56mi |
| 1303 Bayou St Unit C Houston, TX | 3.0 | 3.0 | 1869 | $3,200 | $1.71 | 43d | 1 | 0.56mi |
| 1307 Bayou St Unit B Houston, TX | 3.0 | 3.0 | 1814 | $2,400 | $1.32 | 7d | 1 | 0.57mi |
| 2414 East Dr Unit Canal St unit Houston, TX | 3.0 | 3.5 | 2063 | $2,950 | $1.43 | 7d | 1 | 0.62mi |
| 4109 Hare St Unit 1019559P Houston, TX | 4.0 | 2.5 | 1905 | $6,852 | $3.60 | 7d | 1 | 0.75mi |
| 4109 Hare St Unit A Houston, TX | 4.0 | 2.5 | 1913 | $6,950 | $3.63 | 43d | 1 | 0.75mi |
| 3300 Lyons Ave Unit 304 Houston, TX | 4.0 | 2.0 | 1393 | $1,460 | $1.05 | 43d | 1 | 0.76mi |
| 15 N Chenevert St Houston, TX | 2.0 | 1.0–2.0 | 1351 | $4,000 | $2.96 | 1d | 16 | 0.76mi |
| 1513 Cage St Houston, TX | 3.0 | 2.0 | 1467 | $1,550 | $1.06 | 43d | 1 | 0.76mi |
| 1250 Leona St Houston, TX | 2.0 | 1.0–2.0 | 885 | $1,990 | $2.25 | 2d | 16 | 0.96mi |
| 6 N Main St Houston, TX | 2.0 | 2.0 | 1248 | $2,453 | $1.97 | 43d | 1 | 1.07mi |
| 6 N Main St Houston, TX | 2.0 | 2.0 | 1248 | $2,453 | $1.97 | 20d | 1 | 1.07mi |
| 500 Crawford St Houston, TX | 1.0–2.0 | 1.0–2.0 | 1039 | $2,315 | $2.23 | 43d | 32 | 1.09mi |
| 1222 Upton St Houston, TX | 3.0 | 4.0 | 2055 | $2,600 | $1.27 | 43d | 1 | 1.10mi |
| 4300 Lyons Ave Unit 304 Houston, TX | 4.0 | 2.0 | 1393 | $1,460 | $1.05 | 43d | 1 | 1.13mi |
| 1475 Texas Ave Unit 2187 Houston, TX | 2.0 | 2.0 | 1233 | $2,832 | $2.30 | 3d | 1 | 1.15mi |
| 1475 Texas Ave Unit 422 Houston, TX | 2.0 | 2.0 | 1233 | $2,840 | $2.30 | 7d | 1 | 1.15mi |
| 1475 Texas Ave Unit 2162 Houston, TX | 2.0 | 2.0 | 1233 | $2,840 | $2.30 | 5d | 1 | 1.15mi |
| 1475 Texas St Houston, TX | 3.0 | 1.0–2.0 | 1304 | $6,350 | $4.87 | 43d | 28 | 1.16mi |
| 915 Franklin St Unit 312202 Houston, TX | 2.0 | 2.0 | 1398 | $1,987 | $1.42 | 43d | 1 | 1.17mi |
| 915 Franklin St Unit ID51118 Houston, TX | 2.0 | 2.0 | 1342 | $2,000 | $1.49 | 43d | 1 | 1.17mi |
| 2504 Rusk St Unit 1563174P Houston, TX | 2.0 | 2.0 | 1819 | $4,036 | $2.22 | 3d | 1 | 1.17mi |
| 201 Main St Unit 12258 Houston, TX | 2.0 | 2.0 | 1308 | $2,250 | $1.72 | 43d | 1 | 1.18mi |
| 2816 Rusk St Houston, TX | 3.0 | 3.5 | 2107 | $2,800 | $1.33 | 43d | 1 | 1.20mi |
| 1414 Texas Ave Houston, TX | 2.0 | 1.0–2.0 | 912 | $2,878 | $3.15 | 1d | 38 | 1.22mi |
| 2 Jenkins St Houston, TX | 3.0 | 2.0 | 1242 | $2,250 | $1.81 | 43d | 1 | 1.26mi |
HOA detail
- Monthly dues
- $183 · $2,196/yr
- Likely covers
- security
Listing history 13 events
-
2026-06-18days on market $416,900 Pending 62 DOM
-
2026-06-17days on market $416,900 Pending 61 DOM
-
2026-06-16days on market $416,900 Pending 60 DOM
-
2026-06-15statusdays on market $416,900 Pending 59 DOM
-
2026-06-13days on market $416,900 Active 57 DOM
-
2026-06-10days on market $416,900 Active 53 DOM
-
2026-06-08days on market $416,900 Active 52 DOM
-
2026-06-07days on market $416,900 Active 51 DOM
-
2026-06-04days on market $416,900 Active 48 DOM
-
2026-06-01days on market $416,900 Active 45 DOM
-
2026-05-31days on market $416,900 Active 44 DOM
-
2026-04-17$425,000 Active 653-char remark
Show marketing remark (653 chars)
Experience modern urban living in this beautifully designed 3-story freestanding home located in EaDo Edge, just minutes from Downtown Houston. This home welcomes you with a front gated yard and private entry, blending comfort with convenience. Inside, enjoy contemporary designer finishes, an open living concept, and a private balcony ideal for morning coffee or evening wind-downs. A versatile office nook adds functionality for today’s lifestyle. Situated in one of Houston’s most rapidly developing areas, the community offers guest parking, courtyards, and dog parks, creating the perfect balance of city energy and neighborhood charm.
-
2021-10-06soldstatus
ⓘ Source: listings_history table (triggers on properties + properties_extension) + one-shot
backfill from property_details.listing_events for pre-trigger history.
Tax reassessment forecast TX · Resets to sale price
- Current annual tax
- $8,684 · $724/mo
- Projected year-2 tax
- $8,684 · $724/mo
- Expected delta
- $0/yr ($0/mo · 0.0%)
ⓘ Screening estimate from a state-policy table — verify with the county assessor before closing.
Climate risk First Street
- Flood 7/10 Severe FEMA zone X (unshaded) · 75% chance over 30 yrs
- Wildfire 1/10 Low
- Heat 9/10 Extreme 7 d/yr ≥109°F today · 24 d/yr by 30 yrs out
- Wind 9/10 Extreme 99% chance of damaging wind over 30 yrs
- Air quality 3/10 Moderate 2 unhealthy d/yr today · 3 by 30 yrs out
Nearby sold comps map
Loading sold comps map…
Walkable amenities ~0.75 mi
Loading nearby amenities…
Taxation est. · year 1
- Rental income
- $31,508
- − Mortgage interest
- −$23,353
- − Property taxes
- −$8,684
- − Insurance
- −$2,882
- − Repairs & maintenance
- −$2,521
- − Management
- −$2,521
- − HOA
- −$2,196
- − Depreciation
- −$12,128
- Taxable loss
- −$22,776
- Est. tax savings @ 24.0%
- +$5,466
- After-tax cash flow
- $-9,640/yr
For passive investors: Depreciation is non-cash, so a rental often shows a tax loss while cash-flowing — sheltering income. Rental losses are passive: they offset passive income freely, and up to $25,000/yr can offset ordinary (W-2) income if you actively participate and your MAGI is under $100k (phasing out to $0 by $150k); unused losses carry forward. On sale, claimed depreciation is recaptured at up to 25%, and gains may owe capital-gains tax (a 1031 exchange can defer both). Figures are a year-1 estimate at your 24.0% rate — not tax advice; consult a CPA.
Schools (NCES district)
- District
- Houston ISD
- NCES district ID
- 4823640
- Math proficiency
- 27% ▼ -18.00%
- Reading proficiency
- 35% ▼ -6.00%
- Median HH income
- $46,054
- Composite
- 26.63/100
- National rank
- #7173
- State rank
- #593 of 826 in TX
Livability — Houston
- Score
- 74/100
- State rank
- #184
- US rank
- #4771
Category grades
Schools grade is shown separately in the Schools card above.
Census & demographics
- Census place
- Houston, TX
- County
- Harris County · 4,702,590 people
- City population
- 3,226,434
- Metro
- Houston-The Woodlands-Sugar Land, TX
- Population (ZIP)
- 23,686
- Household income
- $50,119
- Rent vs Own
- Severe rent burden
- 969.0
Population outlook (Harris County) Hauer SSP2
- Today (2025)
- 5,571,493 people
- By 2030
- 6,089,821 · +9.3%
- By 2040
- 7,142,806 · +28.2%
- By 2050
- 8,185,864 · +46.9%
- By 2075
- 10,574,329 · +89.8%
- By 2100
- 12,109,958 · +117.4%
Race, ethnicity, and origin ACS 2023
- Neighborhood character
- Predominantly Hispanic (69%)
- Race & ethnicity
- Hispanic / Latino 69% Black 24% Two or more races 22% White 5% Asian 1%
- Hispanic origin (detail)
- Mexican 60%
- Common ancestry
- Swiss 1%
- Foreign-born
- 23% · Canada
- Languages at home
- 39% English-only · Spanish 59% Other Indo-European 1%
Political lean MEDSL · Harris
- 2024 margin
- Lean D (+5.5) · D 52.0% · R 46.4% · Other 1.6%
- 2008→2024 swing
- +3.9pp toward D · 2008: 1.6pp · 2024: 5.5pp
- All cycles
- 2024: D+5.5 2020: D+13.3 2016: D+12.4 2012: D+0.1 2008: D+1.6
Not yet ingested
- Civics
- —
Market trends
- HPI YoY
- ▲ 55.64%
- Current HPI
- 246.5578
- Rent YoY
- ▲ 4.27%
- Metro
- Houston-The Woodlands-Sugar Land, TX
- State GDP YoY
- ▲ 3.95%
- F500 in state
- 110
Industry mix (Fortune 500 HQ in TX)
| Industry | F500 HQs | Revenue |
|---|---|---|
| Energy | 16 | $1,198B |
|
||
| Technology | 5 | $198B |
|
||
| Engineering / Construction | 4 | $72B |
|
||
| Energy Services | 3 | $60B |
|
||
| Utilities | 3 | $41B |
|
||
| Healthcare | 2 | $330B |
|
||
Price history
2 events — show timeline
- 2026-04-17 Listed $425,000 HARMLS
- 2021-10-06 Sold (Public Records) — Public Records
Property tax history
+39.5%/yrLatest (2025): $8,684 · -3.5% YoY. Source: county tax records.
Cash-flow waterfall
monthlySold comps — $/sqft
last 12 mo · ≤1 miLoading sold comps…