 Multi-family
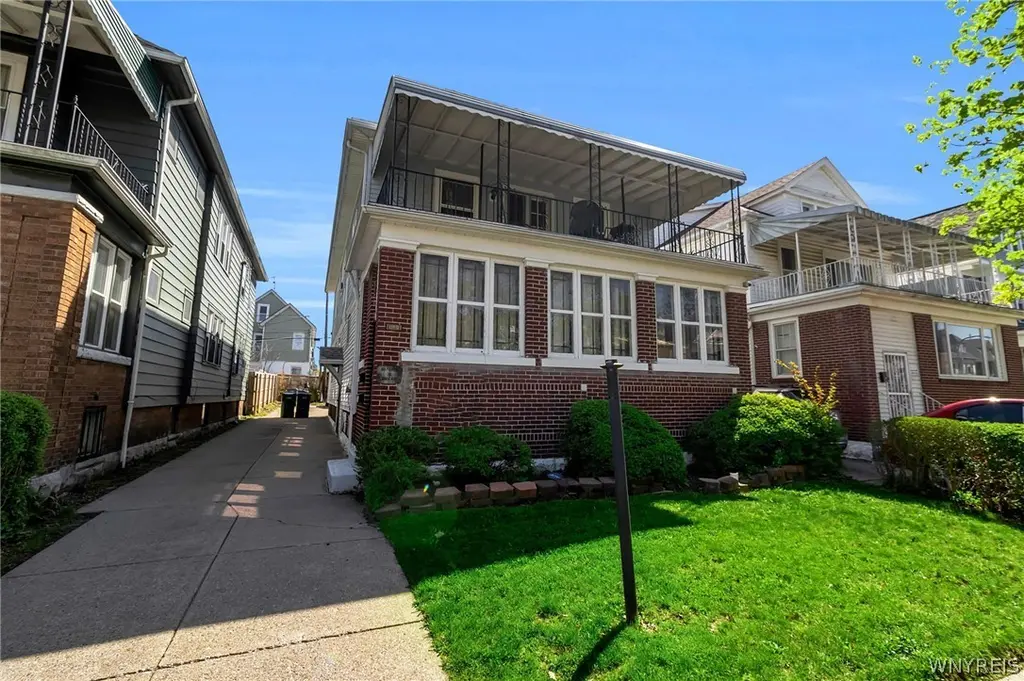
199 Brunswick Blvd · Buffalo, NY
Flood risk 1/10 · Minimal
- FEMA flood zone
- X (unshaded)
- Chance of flooding over 30 yrs
- 0.0%
- Est. flood insurance / yr
- $473 – $860
Fire risk 1/10 · Minimal
- Est. fire insurance / yr
- $691 – $1,283
Heat risk 3/10 · Minor
- Hot days now (above 93°F)
- 7 days/yr
- Hot days in 30 yrs
- 15 days/yr
Wind risk 1/10 · Minimal
- Chance of severe wind over 30 yrs
- —
Air-quality risk 3/10 · Minor
- Unhealthy air days now
- 2 days/yr
- Unhealthy air days in 30 yrs
- 3 days/yr
Risk factors via First Street. Map © Google.
Why this score? — see what drove the B+ grade
The composite is a weighted blend of 9 inputs, each scored 0–100. Each bar is that input's sub-score; the figure is the points it added to the 100-point composite (weight × sub-score).
- Cash flow +30.0/30.0
- ARV discount +15.0/15.0
- 1% rule +10.0/10.0
- DSCR +10.0/10.0
- Livability +3.9/5.0
- Schools +3.3/10.0
- Rent growth +2.5/5.0
- Condition / age +2.5/5.0
- Appreciation +0.0/10.0
$240,000
🖨 Deal sheet 📄 Offer letter ✓ Due diligence
Multi-family units
County records classify this as Multi-Family (2-4 Unit). Listing-text estimate: 1 unit. estimate disagrees with records
Listing remarks
Space, scale, and historic charm collide at 199 Brunswick Boulevard, a massive 3,134 sq. ft. 3/3 double located in the heart of Buffalo’s sought-after Hamlin Park Historic District recently appraised at $250,000. Arguably one of the largest homes on the block, this oversized multi-family property offers an incredible amount of living space and with a vacant upper unit and the lower moving out, there's endless potential for homeowners and investors alike. Each unit features 3 spacious bedrooms, generous living areas, and room to customize or maximize rental income. Whether you’re looking to owner-occupy, expand your portfolio, or preserve a piece of Buffalo history, this property
Key facts
- Historic charm
- 3,960 sq ft lot
- 2 parking spots
Tags
Property features AI
Finance
- Financial info: Operating expense details: see remarks; Tenant is responsible for all utilities
Exterior
- Parking: Concrete parking; Two or more parking spaces
- Utilities: Public water connected; Sewer connected
- Home design: Multi-family property with 2 total units; 2 stories; Resale condition
- Construction: Brick construction; PEX plumbing; Asphalt roof; Block foundation; Existing (previously built)
- Exterior features: Balcony; Historic district setting; Near public transit; Rectangular, residential lot; City street frontage
Interior
- Kitchen: Gas water heater (appliance listed)
- Bedrooms: 2-unit property (multi-family) — individual bedroom counts not provided
- Flooring: Carpet; Laminate; Varies
- Bathrooms: 2 full bathrooms total (property)
- Heating & cooling: Gas forced-air heating
- Interior features: Ceiling fan(s)
- Laundry & utility: Tenant pays all utilities
Neighborhood map
What this means for you Summary
Snapshot
- This is a 6-bed/2.0-bath multifamily listed at $240k.
Deal economics
- At list price, monthly cash flow is $2k ($22k/yr) — positive.
- The deal already cash-flows at list — no discount required.
- Meets the 1% rule at list price ($4k rent vs $240k).
- Cap rate 15.6% vs local median 8.0% in Buffalo — top-decile yield for the area; either an underpriced asset or a hidden risk that comps aren't pricing in. Stress-test before assuming the spread holds.
Location & tenants
- Location reads 77/100 on livability (#195 in NY, #3,011 nationally) — a middle-class / working-renter tenant base. Strengths: commute A+, housing A+, health & safety A+; Watch: crime F, employment D-.
- Buffalo City School District (urban): math 41% / reading 40% proficiency, ranked #535 of 590 in NY (top 91%) — families likely to look elsewhere, expect single-tenant / working-renter base with shorter leases; 75% free/reduced lunch — lower-income household profile, screen leases tightly.
- Market conditions: 54 active listings in the ZIP; 1,244 units permitted in Erie County in 2024 (563 in 5+ unit buildings).
- At $4,162/mo this rent would consume 103% of the median local household income ($48k/yr) (locally 723% of renters already pay >50% of income on rent) — very limited rent-growth headroom before tenants either downsize or default.
Forward outlook
- Local home prices are declining (-3.0%/yr); year-one equity from $2k of loan paydown is wiped out by about $7k of value loss. Plan a longer hold.
- At projected returns (-3.0% appreciation + 3.0% rent growth), your $67k cash investment doubles in ~4 years — after that, you're playing with house money.
Negotiation context
- Only 9 days on market — expect competitive offers; lowballing is unlikely to land.
Risks & watch-outs
- Watch-outs: built in 1910 — expect roof / HVAC / electrical / plumbing capex.
Questions for the listing agent
- Built in 1910 — when were the roof, HVAC, electrical panel, plumbing, and water heater last replaced?
- Is there a deadline driving the sale (1031 exchange, divorce, estate, relocation)? That informs how much negotiation room exists.
- Crime grade is F in this area — have there been break-ins, vandalism, or insurance claims at this property in the last 3 years? What carrier currently insures it and at what premium?
- What's the average days-on-market for RENTAL listings here right now (not sales)? A rising rental-DOM trend means longer vacancies and softer asking-rent achievability than the comps imply.
- What's the recent tenant-quality profile in this submarket — average credit score on applications, eviction rate, late-payment / NSF rate, and stable-employment percentage? A property-management company in the area should have these aggregated.
- How much new apartment / multifamily construction is in the pipeline within 1–3 miles? Heavy new supply (>2% of stock underway) typically softens rents 12–24 months out; light construction supports rent growth.
Investment metrics
- 1% rule
- 1.73% ✓
- Cap rate
- 15.56%
- Cash-on-cash
- 33.10%
- DSCR
- 2.47
- GRM
- 4.8
CMA / ARV
- ARV (median comp)
- $342,095
- List price
- $240,000
- Delta
- -29.84%
- Verdict
- UNDERPRICED
- Comps
- 20 within 1.0 mi
Show comp detail 12 sales within ~0.75 mi
| Address | Dist | Beds/Ba | Sqft | Sold | Price | $/sf | Match |
|---|---|---|---|---|---|---|---|
| 21 Butler Ave | 0.25mi | 6/2.0 | 2,998 (-4%) | 1mo | $215,000 | $72 | 80 |
| 125 Butler Ave | 0.08mi | 6/2.0 | 2,762 (-12%) | 4mo | $145,000 | $52 | 73 |
| 509 E Utica St | 0.41mi | 6/2.0 | 2,976 (-5%) | 3mo | $135,800 | $46 | 70 |
| 236 Brunswick Blvd | 0.07mi | 5/2.0 (-1) | 2,779 (-11%) | 4mo | $287,500 | $103 | 69 |
| 362 Northland Ave | 0.18mi | 6/2.0 | 2,723 (-13%) | 8mo | $216,000 | $79 | 63 |
| 118 Butler Ave | 0.07mi | 6/2.0 | 2,677 (-15%) | 12mo | $189,000 | $71 | 63 |
| 441 Humboldt Pkwy | 0.42mi | 5/2.0 (-1) | 2,966 (-5%) | 13mo | $120,000 | $40 | 55 |
| 715 Woodlawn Ave | 0.46mi | 6/2.0 | 2,784 (-11%) | 12mo | $270,000 | $97 | 50 |
| 287 Riley St | 0.70mi | 6/2.0 | 3,424 (+9%) | 4mo | $95,000 | $28 | 49 |
| 148 Northland Ave | 0.45mi | 6/2.0 | 2,670 (-15%) | 10mo | $220,000 | $82 | 46 |
| 267 Humboldt Pkwy | 0.66mi | 6/2.0 | 2,833 (-10%) | 10mo | $260,000 | $92 | 45 |
| 1002 Humboldt Pkwy | 0.63mi | 6/2.0 | 2,684 (-14%) | 8mo | $185,750 | $69 | 40 |
Match score weights: distance 35% · size 25% · config 20% · recency 20%. Top-matched comps best support the ARV.
Projected returns pro-forma
-3.0% appreciation · 3.0% rent growth · sell at horizon
- IRR
- 28.3%
- Equity multiple
- 2.18×
- Total profit
- $79,099
- Equity at exit
- $35,785
- IRR
- 35.7%
- Equity multiple
- 4.28×
- Total profit
- $220,599
- Equity at exit
- $20,751
Cash invested: $67,200 (down + closing). Projections, not guarantees.
Landlord ↔ Tenant lean methodology
- Overall (STATE)
- 15 Strongly Tenant-Friendly
- State New York
- 15 Strongly Tenant-Friendly · D+10
- County
- — inherits STATE
- City
- — inherits STATE
ZIP-level market 14208
- Home prices YoY
- -3.4%
- Active inventory
- 54
- Price-to-rent
- 9.6×
Monthly cashflow live
- Estimated rent
- $4,162 high interval (Pro) →
- Mortgage (P&I)
- −$1,259
- Tax from tax record
- −$76 /mo · $908/yr
- Insurance
- −$100
- HOA
- −$0
- Vacancy / Maint / Mgmt
- −$874
- Net cashflow
- $1,854
Break-even live
2-unit breakdown (identical units grouped — click to expand)
| Units | Beds | Baths | Est. rent |
|---|---|---|---|
| 2× units | 3 | 1.5 | $4,162 |
| #1 | 3 | 1.5 | $2,081 |
| #2 | 3 | 1.5 | $2,081 |
| Total (2 units) | $4,162 | ||
UW: 25.0% down · 7.5% · 30yr · 1.5% tax · 5.0% vac · 8.0% maint · 8.0% mgmt
Financing live
Cash to close
- Down payment
- $60,000
- Closing costs
- $7,200
- Reserves months
- —
- Total cash needed
- —
Loan-product check · same deal, 3 products live
Conventional
25% down · 7.5% · 30yr
- Down + closing
- —
- Monthly P&I
- —
- Monthly cashflow
- —
- DSCR
- —
- Eligible?
- —
Personal DTI + credit; lowest rate.
DSCR
20% down · 8.5% · 30yr
- Down + closing
- —
- Monthly P&I
- —
- Monthly cashflow
- —
- DSCR
- —
- Eligible?
- —
No personal income docs; deal must DSCR.
Hard money
10% down · 12.0% · 12mo
- Down + closing
- —
- Monthly P&I
- —
- Monthly cashflow
- —
- DSCR
- —
- Eligible?
- —
Short-term bridge; refi at stabilization.
Listing history 4 events
-
2026-05-15status Pending 1133-char remark
-
2026-05-15historical Active Under Contract 1133-char remark
-
2026-05-08status Pending 1133-char remark
-
2026-04-29$240,000 Active 1133-char remark
ⓘ Source: listings_history table (triggers on properties + properties_extension) + one-shot
backfill from property_details.listing_events for pre-trigger history.
Tax reassessment forecast NY · Partial reset (capped growth)
- Current annual tax
- $908 · $76/mo
- Projected year-2 tax
- $2,482 · $207/mo
- Expected delta
- +$1,574/yr (+$131/mo · 173.3%)
ⓘ Screening estimate from a state-policy table — verify with the county assessor before closing.
Climate risk First Street
- Flood 1/10 Low FEMA zone X (unshaded) · 0% chance over 30 yrs
- Wildfire 1/10 Low
- Heat 3/10 Moderate 7 d/yr ≥93°F today · 15 d/yr by 30 yrs out
- Wind 1/10 Low
- Air quality 3/10 Moderate 2 unhealthy d/yr today · 3 by 30 yrs out
Nearby sold comps map
Loading sold comps map…
Walkable amenities ~0.75 mi
Loading nearby amenities…
Taxation est. · year 1
- Rental income
- $49,944
- − Mortgage interest
- −$13,444
- − Property taxes
- −$908
- − Insurance
- −$1,200
- − Repairs & maintenance
- −$3,996
- − Management
- −$3,996
- − Depreciation
- −$6,982
- Taxable income
- $19,419
- Est. tax owed @ 24.0%
- −$4,661
- After-tax cash flow
- $17,584/yr
For passive investors: Depreciation is non-cash, so a rental often shows a tax loss while cash-flowing — sheltering income. Rental losses are passive: they offset passive income freely, and up to $25,000/yr can offset ordinary (W-2) income if you actively participate and your MAGI is under $100k (phasing out to $0 by $150k); unused losses carry forward. On sale, claimed depreciation is recaptured at up to 25%, and gains may owe capital-gains tax (a 1031 exchange can defer both). Figures are a year-1 estimate at your 24.0% rate — not tax advice; consult a CPA.
Schools (NCES district)
- District
- Buffalo City School District
- NCES district ID
- 3605850
- Math proficiency
- 41% ▲ 11.00%
- Reading proficiency
- 40% ▲ 7.00%
- Median HH income
- $31,665
- Composite
- 33.17/100
- National rank
- #5544
- State rank
- #535 of 590 in NY
Livability — Buffalo
- Score
- 77/100
- State rank
- #195
- US rank
- #3011
Category grades
Schools grade is shown separately in the Schools card above.
Census & demographics
- Census place
- Buffalo, NY
- County
- Erie County · 714,559 people
- City population
- 440,021
- Metro
- Buffalo-Cheektowaga, NY
- Population (ZIP)
- 12,572
- Household income
- $48,476
- Rent vs Own
- Severe rent burden
- 723.0
Population outlook (Erie County) Hauer SSP2
- Today (2025)
- 933,037 people
- By 2030
- 935,181 · +0.2%
- By 2040
- 928,531 · -0.5%
- By 2050
- 905,725 · -2.9%
- By 2075
- 834,037 · -10.6%
- By 2100
- 708,033 · -24.1%
Race, ethnicity, and origin ACS 2023
- Neighborhood character
- Predominantly Black (72%)
- Race & ethnicity
- Black 72% White 15% Asian 6% Two or more races 4% Hispanic / Latino 3%
- Common ancestry
- Romanian 2% Italian 1% Hispanic 0%
- Foreign-born
- 7% · Canada, South Korea, Philippines
- Languages at home
- 89% English-only · Other Indo-European 3% Spanish 2% French/Haitian/Cajun 1%
Political lean MEDSL · Erie
- 2024 margin
- Lean D (+9.7) · D 54.8% · R 45.2%
- 2008→2024 swing
- -7.9pp toward R · 2008: 17.5pp · 2024: 9.7pp
- All cycles
- 2024: D+9.7 2020: D+14.7 2016: D+4.8 2012: D+15.6 2008: D+17.5
Not yet ingested
- Civics
- —
Market trends
- HPI YoY
- ▼ -16.37%
- Current HPI
- 459.2084
- Rent YoY
- —
- Metro
- Buffalo-Cheektowaga, NY
- State GDP YoY
- ▲ 2.60%
- F500 in state
- 92
Industry mix (Fortune 500 HQ in NY)
| Industry | F500 HQs | Revenue |
|---|---|---|
| Financial Services | 10 | $950B |
|
||
| Consumer Goods | 9 | $162B |
|
||
| Insurance | 4 | $225B |
|
||
| Telecommunications | 2 | $144B |
|
||
| Pharmaceuticals | 2 | $112B |
|
||
| Media / Entertainment | 2 | $69B |
|
||
Price history
4 events — show timeline
- 2026-05-15 Pending — WNYREIS
- 2026-05-15 Contingent — WNYREIS
- 2026-05-08 Pending — WNYREIS
- 2026-04-29 Listed $240,000 WNYREIS
Property tax history
+12.6%/yrLatest (2025): $908 · +184.3% YoY. Source: county tax records.
Cash-flow waterfall
monthlySold comps — $/sqft
last 12 mo · ≤1 miLoading sold comps…