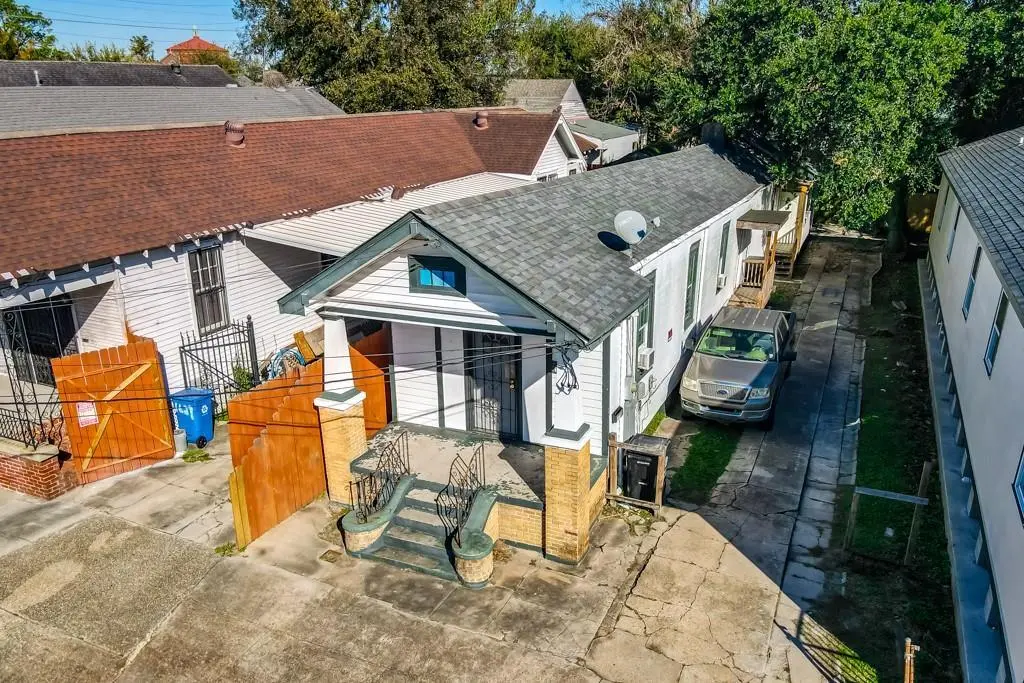
1625-B Mandeville St · New Orleans, LA
Flood risk No data
- FEMA flood zone
- —
- Chance of flooding over 30 yrs
- —
- Est. flood insurance / yr
- —
Fire risk No data
- Est. fire insurance / yr
- —
Heat risk No data
- Hot days now (above threshold)
- —
- Hot days in 30 yrs
- —
Wind risk No data
- Chance of severe wind over 30 yrs
- —
Air-quality risk No data
- Unhealthy air days now
- —
- Unhealthy air days in 30 yrs
- —
Risk factors via First Street. Map © Google.
Why this score? — see what drove the B grade
The composite is a weighted blend of 9 inputs, each scored 0–100. Each bar is that input's sub-score; the figure is the points it added to the 100-point composite (weight × sub-score).
- Cash flow +26.6/30.0
- ARV discount +15.0/15.0
- DSCR +9.1/10.0
- 1% rule +7.1/10.0
- Livability +4.0/5.0
- Condition / age +3.8/5.0
- Rent growth +3.1/5.0
- Schools +1.6/10.0
- Appreciation +0.0/10.0
$179,900
🖨 Deal sheet (PDF) 📄 Offer letter ✓ Due diligence
Listing remarks MLS
This home is great for an owner occupied home. You can live in one unit and let the other cover your mortgage. In an area that is flourishing with tons of renovations, you can't go wrong with this purchase. The front unit has 2 bedrooms and one full bathroom, kitchen & more. The back unit has three bedrooms, 1 bathroom, kitchen, central air/heat & more. The owner updated all the wiring, most plumbing, and sheetrock in 2013. The home also has a newer roof. You can live minutes away from the St. Roch Market.
Key facts
- Updated wiring
- Newer roof
- Built 1980
Tags
Neighborhood map
What this means for you Summary
Snapshot
- This is a 5-bed/2.0-bath single-family listed at $180k. Condition is rated good.
Deal economics
- At list price, monthly cash flow is $480 ($6k/yr) — positive.
- The deal already cash-flows at list — no discount required.
- Meets the 1% rule at list price ($2k rent vs $180k).
- Recommended offer: $158k (12.0% below list) — sets the bar for market timing.
- Cap rate 9.5% vs local median 4.4% in New Orleans — top-decile yield for the area; either an underpriced asset or a hidden risk that comps aren't pricing in. Stress-test before assuming the spread holds.
Location & tenants
- Location reads 81/100 on livability (#3 in LA, #1,383 nationally) — a professional / high-income tenant draw. Strengths: amenities A+, commute A+, health & safety A+; Watch: crime C-, employment D.
- Orleans Parish (urban): math 11% / reading 27% proficiency, ranked #69 of 98 in LA (top 70%) — low school quality limits family demand, transient renter base, plan for 1-2y turnover; 68% free/reduced lunch — lower-income household profile, screen leases tightly.
- Zoned schools: Benjamin Franklin Elem. Math And Science (math 12% / reading 23%, grade F, #479 of 646 statewide, top 75%, 747 students, 98% FRL, charter) — zoned schools average 98% FRL vs 68% district-wide (30 pts higher); higher-poverty schools than district average — tighter screening recommended.
- Market conditions: Rents rising (+2.5%/yr); 587 active listings in the ZIP; 14 comparable units currently listed for rent nearby; rentals at typical pace (median 25d on market — plan ~3-4 weeks tenant-placement turnaround); 710 units permitted in Orleans Parish in 2024 (244 in 5+ unit buildings).
- At $2,182/mo this rent would consume 57% of the median local household income ($46k/yr) (locally 1988% of renters already pay >50% of income on rent) — very limited rent-growth headroom before tenants either downsize or default.
Forward outlook
- Local home prices are declining (-3.0%/yr); year-one equity from $1k of loan paydown is wiped out by about $5k of value loss. Plan a longer hold.
- Orleans County population projected at +61% by 2050 — long-run rental-demand tailwind backs the buy-and-hold thesis.
Negotiation context
- It's been on market 199 days — a 12% lower offer ($158k) is reasonable based on typical stale-listing flexibility.
- 10 sale attempts since 12y ago with the ask held roughly flat each time — persistent listings suggest the price (not the market) is what's stuck; bring a comps-based counter.
- Current owner paid $125k; 44% above their basis — modest negotiation headroom, anchor on the comps not their cost.
Questions for the listing agent
- It's been on market 199 days. Have you received any prior offers? Is the seller open to a 12% concession, seller financing, or rate buy-down credit?
- Why hasn't it sold? Are there any deal-killer items the seller is aware of (foundation, flood, title, zoning, code violations)?
- Is there a deadline driving the sale (1031 exchange, divorce, estate, relocation)? That informs how much negotiation room exists.
- What's the average days-on-market for RENTAL listings here right now (not sales)? A rising rental-DOM trend means longer vacancies and softer asking-rent achievability than the comps imply.
- What's the recent tenant-quality profile in this submarket — average credit score on applications, eviction rate, late-payment / NSF rate, and stable-employment percentage? A property-management company in the area should have these aggregated.
- How much new for-sale + rental construction is in the pipeline within 1–3 miles? Heavy new supply typically softens prices + rents 12–24 months out; constrained supply supports both.
Investment metrics
- 1% rule
- 1.21% ✓
- Cap rate
- 9.50%
- Cash-on-cash
- 11.45%
- DSCR
- 1.51
- GRM
- 6.9
CMA / ARV
- ARV (median comp)
- $338,712
- List price
- $179,900
- Delta
- -46.89%
- Verdict
- UNDERPRICED
- Comps
- 20 within 1.0 mi
Show comp detail 10 sales within ~0.75 mi
| Address | Dist | Beds/Ba | Sqft | Sold | Price | $/sf | Match |
|---|---|---|---|---|---|---|---|
| 2138 Pauger St | 0.40mi | 4/2.0 (-1) | 1,700 (-0%) | 16mo | $70,000 | $41 | 63 |
| 1607 Arts St | 0.27mi | 4/3.0 (-1) | 1,907 (+12%) | 6mo | $275,000 | $144 | 53 |
| 2534 Franklin Ave | 0.75mi | 4/2.0 (-1) | 1,771 (+4%) | 2mo | $50,000 | $28 | 52 |
| 917 Franklin Ave | 0.56mi | 4/2.0 (-1) | 1,912 (+12%) | 2mo | $145,000 | $76 | 47 |
| 1833 Saint Ferdinand St | 0.55mi | 4/2.5 (-1) | 1,551 (-9%) | 8mo | $130,000 | $84 | 46 |
| 827 Port St | 0.63mi | 4/2.0 (-1) | 1,837 (+8%) | 10mo | $730,000 | $397 | 44 |
| 1629 Pauger St | 0.60mi | 4/3.0 (-1) | 1,589 (-7%) | 10mo | $449,000 | $283 | 43 |
| 1718 N Robertson St | 0.50mi | 5/2.0 | 1,459 (-14%) | 12mo | $220,000 | $151 | 43 |
| 1200 Saint Ferdinand St | 0.51mi | 6/3.0 (+1) | 1,616 (-5%) | 21mo | $149,000 | $92 | 41 |
| 1919 N Prieur St | 0.52mi | 4/2.0 (-1) | 1,945 (+14%) | 8mo | $245,000 | $126 | 40 |
Match score weights: distance 35% · size 25% · config 20% · recency 20%. Top-matched comps best support the ARV.
Projected returns pro-forma
-3.0% appreciation · 2.49% rent growth · sell at horizon
- IRR
- 0.2%
- Equity multiple
- 1.01×
- Total profit
- $370
- Equity at exit
- $26,824
- IRR
- 9.3%
- Equity multiple
- 1.70×
- Total profit
- $35,336
- Equity at exit
- $15,554
Cash invested: $50,372 (down + closing). Projections, not guarantees.
Landlord ↔ Tenant lean methodology
- Overall (STATE)
- 90 Strongly Landlord-Friendly
- State Louisiana
- 90 Strongly Landlord-Friendly · R+12
- County
- — inherits STATE
- City
- — inherits STATE
ZIP-level market 70117
- Rents YoY
- 2.5%
- Active inventory
- 587
- Price-to-rent
- 6.9×
Monthly cashflow live
- Estimated rent
- $2,182 high interval (Pro) →
- Mortgage (P&I)
- −$943
- Tax est. 1.5%
- −$225 /mo · $2,698/yr
- Insurance
- −$75
- HOA
- −$0
- Vacancy / Maint / Mgmt
- −$458
- Net cashflow
- $480
Break-even live
Sensitivity live
| Price | -10% $605 | -5% $543 | +0% $480 | +5% $418 | +10% $356 |
|---|---|---|---|---|---|
| Rent | -10% $308 | -5% $394 | +0% $480 | +5% $567 | +10% $653 |
| Rate | -1.0pp $571 | -0.5pp $526 | base $480 | +0.5pp $434 | +1.0pp $386 |
UW: 25.0% down · 7.5% · 30yr · 1.5% tax · 5.0% vac · 8.0% maint · 8.0% mgmt
Financing live
Cash to close
- Down payment
- $44,975
- Closing costs
- $5,397
- Reserves months
- —
- Total cash needed
- —
Loan-product check · same deal, 3 products live
Conventional
25% down · 7.5% · 30yr
- Down + closing
- —
- Monthly P&I
- —
- Monthly cashflow
- —
- DSCR
- —
- Eligible?
- —
Personal DTI + credit; lowest rate.
DSCR
20% down · 8.5% · 30yr
- Down + closing
- —
- Monthly P&I
- —
- Monthly cashflow
- —
- DSCR
- —
- Eligible?
- —
No personal income docs; deal must DSCR.
Hard money
10% down · 12.0% · 12mo
- Down + closing
- —
- Monthly P&I
- —
- Monthly cashflow
- —
- DSCR
- —
- Eligible?
- —
Short-term bridge; refi at stabilization.
Rent comps 14 comps
| Address | Beds | Baths | Sqft | Rent | $/sqft | DOM | Units | Dist |
|---|---|---|---|---|---|---|---|---|
| 2107 Elysian Fields Ave New Orleans, LA | 4.0 | 2.0 | 1794 | $1,650 | $0.92 | 4d | 1 | 0.36mi |
| 2317 N Rampart St Unit 1272378P New Orleans, LA | 3.0–6.0 | 2.0–4.0 | 1581 | $6,144 | $3.88 | 4d | 2 | 0.43mi |
| 2515 N Galvez St Unit 2515 New Orleans, LA | 4.0 | 2.0 | 1200 | $1,900 | $1.58 | 25d | 1 | 0.47mi |
| 2515 N Galvez St New Orleans, LA | 4.0 | 2.0 | 1200 | $1,200 | $1.00 | 12d | 1 | 0.47mi |
| 2920 Pauger St New Orleans, LA | 4.0 | 2.0 | 1882 | $1,995 | $1.06 | 25d | 1 | 0.57mi |
| 632 Mandeville St Unit 2B New Orleans, LA | 4.0 | 4.5 | 1337 | $4,500 | $3.37 | 18d | 1 | 0.65mi |
| 3228 Pauger St New Orleans, LA | 5.0 | 2.0 | 1600 | $2,100 | $1.31 | 25d | 1 | 0.75mi |
| 1418 Royal St Unit 1418 New Orleans, LA | 4.0 | 2.0 | 1300 | $2,450 | $1.88 | 25d | 1 | 0.76mi |
| 5624-5626 Saint Claude ST New Orleans, LA | 4.0 | 3.0 | 1521 | $2,300 | $1.51 | 25d | 1 | 0.94mi |
| 2019 Gallier St New Orleans, LA | 4.0 | 2.0 | 1400 | $2,200 | $1.57 | 25d | 1 | 1.12mi |
| 811 Burgundy St New Orleans, LA | 4.0 | 2.5 | 2059 | $5,000 | $2.43 | 45d | 1 | 1.14mi |
| 3021 Republic St New Orleans, LA | 4.0 | 2.0 | 1125 | $2,200 | $1.96 | 25d | 1 | 1.37mi |
| 2739 Bay St Unit B New Orleans, LA | 4.0 | 2.0 | 1400 | $1,800 | $1.29 | 21d | 1 | 1.43mi |
| 249 Vallette St New Orleans, LA | 4.0 | 2.0 | 1734 | $2,500 | $1.44 | 17d | 1 | 1.46mi |
Listing history 15 events
-
2025-11-11$179,900 Active 523-char remark
Show marketing remark (519 chars)
This home is great for an owner occupied home. You can live in one unit and let the other cover your mortgage. In an area that is flourishing with tons of renovations, you can't go wrong with this purchase. The front unit has 2 bedrooms and one full bathroom, kitchen & more. The back unit has three bedrooms, 1 bathroom, kitchen, central air/heat & more. The owner updated all the wiring, most plumbing, and sheetrock in 2013. The home also has a newer roof. You can live minutes away from the St. Roch Market.
-
2025-11-11$179,900 Active 519-char remark
Show marketing remark (519 chars)
This home is great for an owner occupied home. You can live in one unit and let the other cover your mortgage. In an area that is flourishing with tons of renovations, you can't go wrong with this purchase. The front unit has 2 bedrooms and one full bathroom, kitchen & more. The back unit has three bedrooms, 1 bathroom, kitchen, central air/heat & more. The owner updated all the wiring, most plumbing, and sheetrock in 2013. The home also has a newer roof. You can live minutes away from the St. Roch Market.
-
2025-01-03$199,900 Active
-
2019-09-20soldstatus $125,000 Closed
-
2019-08-26status Pending
-
2019-08-23price $135,000
-
2019-08-16status Active
-
2019-08-07status Pending
-
2019-08-01$135,000
-
2019-08-01$149,900 Active
-
2017-09-07$130,000
-
2016-04-20$129,000
-
2014-04-25soldstatus $21,000
-
2014-02-17$30,000
-
2014-02-17$30,000
ⓘ Source: listings_history table (triggers on properties + properties_extension) + one-shot
backfill from property_details.listing_events for pre-trigger history.
Nearby sold comps map
Loading sold comps map…
Walkable amenities ~0.75 mi
Loading nearby amenities…
Taxation est. · year 1
- Rental income
- $26,183
- − Mortgage interest
- −$10,077
- − Property taxes
- −$2,698
- − Insurance
- −$900
- − Repairs & maintenance
- −$2,095
- − Management
- −$2,095
- − Depreciation
- −$5,233
- Taxable income
- $3,085
- Est. tax owed @ 24.0%
- −$740
- After-tax cash flow
- $5,025/yr
For passive investors: Depreciation is non-cash, so a rental often shows a tax loss while cash-flowing — sheltering income. Rental losses are passive: they offset passive income freely, and up to $25,000/yr can offset ordinary (W-2) income if you actively participate and your MAGI is under $100k (phasing out to $0 by $150k); unused losses carry forward. On sale, claimed depreciation is recaptured at up to 25%, and gains may owe capital-gains tax (a 1031 exchange can defer both). Figures are a year-1 estimate at your 24.0% rate — not tax advice; consult a CPA.
Condition & rehab AI · 12 photos
This single-family home is in good condition with recent updates, making it a great investment opportunity for both resale and rental.
Value-add opportunities
- Both Paint exterior and interior — Fresh paint enhances curb appeal and interior aesthetics
- Both Replace air conditioning unit — Modern AC improves comfort and energy efficiency
- Both Install smart home devices — Enhances convenience and energy savings
Renovation cost estimate screening
Value-add ROI direction
- Both Paint exterior and interior — Fresh paint enhances curb appeal and interior aesthetics ↑
- Both Replace air conditioning unit — Modern AC improves comfort and energy efficiency ↑
- Both Install smart home devices — Enhances convenience and energy savings ↑
ⓘ Cost ranges are severity-bucket heuristics (US national rule-of-thumb). Get contractor quotes + a written scope before underwriting a rehab budget.
Schools (NCES district)
- District
- Orleans Parish
- NCES district ID
- 2201170
- Math proficiency
- 11% ▼ -52.00%
- Reading proficiency
- 27% ▼ -46.00%
- Median HH income
- $37,011
- Composite
- 15.78/100
- National rank
- #9271
- State rank
- #69 of 98 in LA
Livability — New Orleans
- Score
- 81/100
- State rank
- #3
- US rank
- #1383
Category grades
Schools grade is shown separately in the Schools card above.
Census & demographics
- Census place
- New Orleans, LA
- County
- Orleans Parish · 338,817 people
- City population
- 338,817
- Metro
- New Orleans-Metairie, LA
- Population (ZIP)
- 25,652
- Household income
- $45,764
- Rent vs Own
- Severe rent burden
- 1988.0
Population outlook (Orleans County) Hauer SSP2
- Today (2025)
- 513,025 people
- By 2030
- 575,781 · +12.2%
- By 2040
- 700,174 · +36.5%
- By 2050
- 826,541 · +61.1%
- By 2075
- 1,123,374 · +119.0%
- By 2100
- 1,355,609 · +164.2%
Race, ethnicity, and origin ACS 2023
- Neighborhood character
- Majority Black (60%)
- Race & ethnicity
- Black 60% White 30% Two or more races 6% Hispanic / Latino 5%
- Common ancestry
- Lithuanian 5% Italian 1% Romanian 1%
- Foreign-born
- 5% · Canada, South Korea
- Languages at home
- 93% English-only · Spanish 3% Other Indo-European 1% French/Haitian/Cajun 1%
Political lean MEDSL · Orleans
- 2024 margin
- Solid D (+67.0) · D 82.2% · R 15.2% · Other 2.7%
- 2008→2024 swing
- +6.7pp toward D · 2008: 60.3pp · 2024: 67.0pp
- All cycles
- 2024: D+67.0 2020: D+68.2 2016: D+66.2 2012: D+62.5 2008: D+60.3
Not yet ingested
- Civics
- —
Market trends
- HPI YoY
- ▼ -177.22%
- Current HPI
- 184.6061
- Rent YoY
- ▲ 2.49%
- Metro
- New Orleans-Metairie, LA
- State GDP YoY
- ▲ 3.29%
- F500 in state
- 10
Industry mix (Fortune 500 HQ in LA)
| Industry | F500 HQs | Revenue |
|---|---|---|
| Telecommunications | 2 | $23B |
|
||
| Utilities | 1 | $12B |
|
||
| Wholesale / Distribution | 1 | $5B |
|
||
| Advertising | 1 | $2B |
|
||
Price history
+499.7% since first listed15 events — show timeline
- 2025-11-11 Listed $179,900 AcadianaMLS
- 2025-11-11 Listed $179,900 GSREIN
- 2025-01-03 Listed $199,900 AcadianaMLS
- 2019-09-20 Sold (MLS) $125,000 GSREIN
- 2019-08-26 Pending — GSREIN
- 2019-08-23 Price Changed $135,000 GSREIN
- 2019-08-16 Relisted — GSREIN
- 2019-08-07 Pending — GSREIN
- 2019-08-01 Listed $149,900 GSREIN
- 2019-08-01 Listed $135,000 AcadianaMLS
- 2017-09-07 Listed $130,000 AcadianaMLS
- 2016-04-20 Listed $129,000 AcadianaMLS
- 2014-04-25 Sold (MLS) $21,000 GSREIN
- 2014-02-17 Listed $30,000 AcadianaMLS
- 2014-02-17 Listed $30,000 GSREIN
Cash-flow waterfall
monthlySold comps — $/sqft
last 12 mo · ≤1 miLoading sold comps…