542 Public · Naylor, MO
Flood risk No data
- FEMA flood zone
- —
- Chance of flooding over 30 yrs
- —
- Est. flood insurance / yr
- —
Fire risk No data
- Est. fire insurance / yr
- —
Heat risk No data
- Hot days now (above threshold)
- —
- Hot days in 30 yrs
- —
Wind risk No data
- Chance of severe wind over 30 yrs
- —
Air-quality risk No data
- Unhealthy air days now
- —
- Unhealthy air days in 30 yrs
- —
Risk factors via First Street. Map © Google.
Why this score? — see what drove the C+ grade
The composite is a weighted blend of 9 inputs, each scored 0–100. Each bar is that input's sub-score; the figure is the points it added to the 100-point composite (weight × sub-score).
- Cash flow +24.2/30.0
- DSCR +7.8/10.0
- ARV discount +7.5/15.0
- 1% rule +6.3/10.0
- Appreciation +5.0/10.0
- Schools +4.3/10.0
- Livability +3.0/5.0
- Rent growth +2.5/5.0
- Condition / age +2.2/5.0
$99,900
🖨 Deal sheet (PDF) 📄 Offer letter ✓ Due diligence
Listing remarks
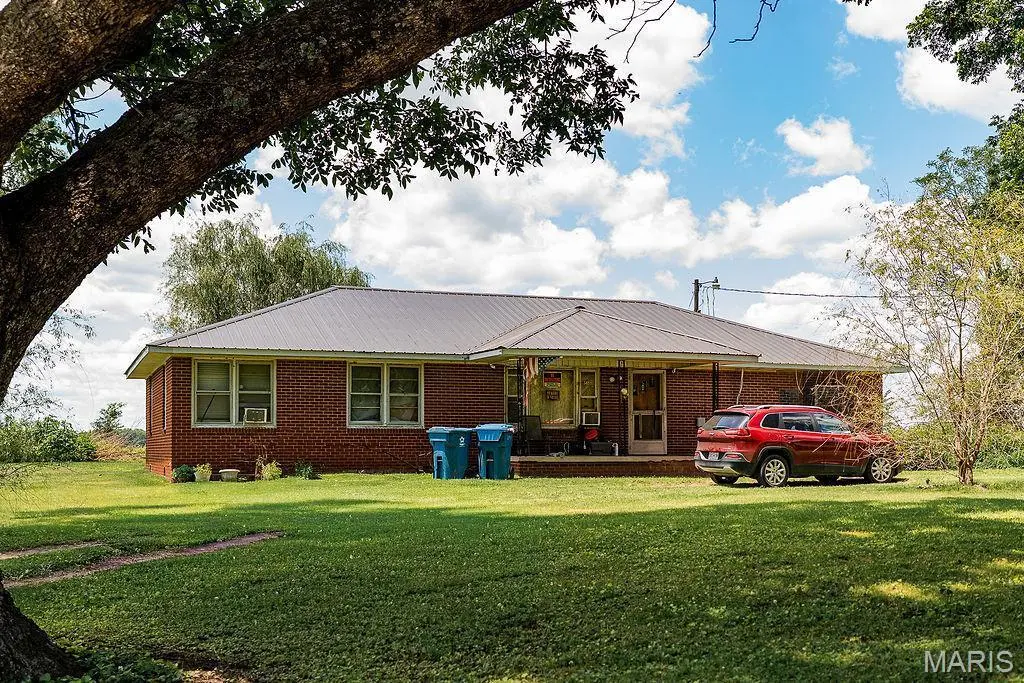
Enjoy peaceful country living with this 3-bedroom, 2-bath home situated on approximately 1 acre and surrounded by beautiful farmland views. Offering 1,711 square feet of living space, this property features a newer metal roof installed in December 2025, a newer HVAC unit installed in 2022, a solid brick exterior, hardwood flooring, and a bonus room that could serve as an office, playroom, or additional living space. Don’t forget the covered front porch, perfect for enjoying the quiet surroundings. With plenty of room both inside and out, this home offers an excellent opportunity for a first-time buyer, investor, or anyone looking to add their own personal touches. Conveniently located
Key facts
- Hardwood flooring
- Covered front porch
- Bonus room
Tags
Property features AI
Finance
- Financial info: Lease not considered
Exterior
- Parking: No parking details provided
- Security: No security features listed
- Utilities: Public water; Public sewer; 220-volt electric service; Cable available; Electricity connected; Sewer connected; Water connected
- Home design: Single-family residence; One level
- Construction: Brick construction; Slab foundation; Built year sourced from public records
- Exterior features: Entry steps/stairs; Exterior lighting; Private yard; Outdoor storage; Some trees on the lot
Interior
- Kitchen: Electric oven; Refrigerator
- Bedrooms: Three bedrooms on the main level (all bedrooms located on main level)
- Flooring: Hardwood flooring; Linoleum flooring
- Bathrooms: Two full bathrooms on the main level
- Heating & cooling: Electric heating; Central air; Ceiling fans; Window air conditioning units
- Interior features: Laminate countertops; 10 total rooms
- Laundry & utility: Main-level laundry
Neighborhood map
What this means for you Summary
Snapshot
- This is a 3-bed/2.0-bath single-family listed at $100k. Condition is rated fair.
Deal economics
- At list price, monthly cash flow is $200 ($2k/yr) — positive.
- The deal already cash-flows at list — no discount required.
- Meets the 1% rule at list price ($1k rent vs $100k).
Location & tenants
- Location reads 59/100 on livability (#537 in MO) — a working-class tenant base; expect higher turnover. Strengths: cost of living A+, housing A+; Watch: health & safety C-, crime F, amenities F.
- Naylor R-II (rural): math 50% / reading 50% proficiency, ranked #138 of 535 in MO (top 26%) — acceptable for families but not a draw, mixed tenant base, ~2y average lease.
- Zoned schools: Naylor Elem. (math 37% / reading 42%, grade F, #537 of 1,115 statewide, top 53%, 220 students, 66% FRL); Naylor High School (math 27% / reading 47%, grade F, #291 of 521 statewide, top 60%, 159 students, 55% FRL).
- Market conditions: 7 active listings in the ZIP.
Forward outlook
- In year one you build about $4k of equity ($691 loan paydown + $3k appreciation (3.0% local appreciation)).
- Ripley County population projected at -20% by 2050 — secular population decline; favor cash flow + early exit over multi-decade hold.
- At projected returns (3.0% appreciation + 3.0% rent growth), your $28k cash investment doubles in ~5 years — after that, you're playing with house money.
- By year 9, paydown + projected appreciation supports a ~$31k cash-out refi (75% LTV) — recoverable capital for the next deal without selling this one.
Negotiation context
- Only 4 days on market — expect competitive offers; lowballing is unlikely to land.
Risks & watch-outs
- Watch-outs: built in 1957 — expect roof / HVAC / electrical / plumbing capex.
Questions for the listing agent
- Have any recent inspections been done? Can we get a copy of the seller's disclosures and any deferred-maintenance estimates?
- Built in 1957 — when were the roof, HVAC, electrical panel, plumbing, and water heater last replaced?
- Is there a deadline driving the sale (1031 exchange, divorce, estate, relocation)? That informs how much negotiation room exists.
- Schools are D-rated, which usually means shorter tenancies and higher turnover. Who's the typical renter profile here, and what's been the actual vacancy rate?
- Crime grade is F in this area — have there been break-ins, vandalism, or insurance claims at this property in the last 3 years? What carrier currently insures it and at what premium?
- What's the average days-on-market for RENTAL listings here right now (not sales)? A rising rental-DOM trend means longer vacancies and softer asking-rent achievability than the comps imply.
- What's the recent tenant-quality profile in this submarket — average credit score on applications, eviction rate, late-payment / NSF rate, and stable-employment percentage? A property-management company in the area should have these aggregated.
- How much new for-sale + rental construction is in the pipeline within 1–3 miles? Heavy new supply typically softens prices + rents 12–24 months out; constrained supply supports both.
Investment metrics
- 1% rule
- 1.13% ✓
- Cap rate
- 8.69%
- Cash-on-cash
- 8.58%
- DSCR
- 1.38
- GRM
- 7.4
CMA / ARV
- ARV (on-the-fly)
- $208,742
- Comps found
- 2
Show comp detail 2 sales within ~0.75 mi
| Address | Dist | Beds/Ba | Sqft | Sold | Price | $/sf | Match |
|---|---|---|---|---|---|---|---|
| 408 S Lyons Ave | 0.28mi | 4/3.0 (+1) | 1,728 (+1%) | 4mo | $210,000 | $122 | 73 |
| 109 E Wood St | 0.16mi | 2/2.0 (-1) | 1,537 (-10%) | 18mo | $19,900 | $13 | 56 |
Match score weights: distance 35% · size 25% · config 20% · recency 20%. Top-matched comps best support the ARV.
Projected returns pro-forma
3.0% appreciation · 3.0% rent growth · sell at horizon
- IRR
- 15.5%
- Equity multiple
- 1.89×
- Total profit
- $24,783
- Equity at exit
- $44,919
- IRR
- 17.2%
- Equity multiple
- 3.52×
- Total profit
- $70,421
- Equity at exit
- $69,226
Cash invested: $27,972 (down + closing). Projections, not guarantees.
Landlord ↔ Tenant lean methodology
- Overall (STATE)
- 81 Strongly Landlord-Friendly
- State Missouri
- 81 Strongly Landlord-Friendly · R+10
- County
- — inherits STATE
- City
- — inherits STATE
ZIP-level market 63953
- Active inventory
- 7
- Price-to-rent
- 7.4×
Monthly cashflow live
- Estimated rent
- $1,127 medium interval (Pro) →
- Mortgage (P&I)
- −$524
- Tax est. 1.5%
- −$125 /mo · $1,498/yr
- Insurance
- −$42
- HOA
- −$0
- Vacancy / Maint / Mgmt
- −$237
- Net cashflow
- $200
Break-even live
Sensitivity live
| Price | -10% $269 | -5% $234 | +0% $200 | +5% $165 | +10% $131 |
|---|---|---|---|---|---|
| Rent | -10% $111 | -5% $155 | +0% $200 | +5% $244 | +10% $289 |
| Rate | -1.0pp $250 | -0.5pp $225 | base $200 | +0.5pp $174 | +1.0pp $148 |
UW: 25.0% down · 7.5% · 30yr · 1.5% tax · 5.0% vac · 8.0% maint · 8.0% mgmt
Financing live
Cash to close
- Down payment
- $24,975
- Closing costs
- $2,997
- Reserves months
- —
- Total cash needed
- —
Loan-product check · same deal, 3 products live
Conventional
25% down · 7.5% · 30yr
- Down + closing
- —
- Monthly P&I
- —
- Monthly cashflow
- —
- DSCR
- —
- Eligible?
- —
Personal DTI + credit; lowest rate.
DSCR
20% down · 8.5% · 30yr
- Down + closing
- —
- Monthly P&I
- —
- Monthly cashflow
- —
- DSCR
- —
- Eligible?
- —
No personal income docs; deal must DSCR.
Hard money
10% down · 12.0% · 12mo
- Down + closing
- —
- Monthly P&I
- —
- Monthly cashflow
- —
- DSCR
- —
- Eligible?
- —
Short-term bridge; refi at stabilization.
Listing history 4 events
-
2026-06-21days on market $99,900 Active 4 DOM
-
2026-06-18days on market $99,900 Active 2 DOM
-
2026-06-17remarks 693-char remark
-
2026-06-17$99,900 Active 1 DOM
ⓘ Source: listings_history table (triggers on properties + properties_extension) + one-shot
backfill from property_details.listing_events for pre-trigger history.
Nearby sold comps map
Loading sold comps map…
Walkable amenities ~0.75 mi
Loading nearby amenities…
Taxation est. · year 1
- Rental income
- $13,523
- − Mortgage interest
- −$5,596
- − Property taxes
- −$1,498
- − Insurance
- −$500
- − Repairs & maintenance
- −$1,082
- − Management
- −$1,082
- − Depreciation
- −$2,906
- Taxable income
- $859
- Est. tax owed @ 24.0%
- −$206
- After-tax cash flow
- $2,192/yr
For passive investors: Depreciation is non-cash, so a rental often shows a tax loss while cash-flowing — sheltering income. Rental losses are passive: they offset passive income freely, and up to $25,000/yr can offset ordinary (W-2) income if you actively participate and your MAGI is under $100k (phasing out to $0 by $150k); unused losses carry forward. On sale, claimed depreciation is recaptured at up to 25%, and gains may owe capital-gains tax (a 1031 exchange can defer both). Figures are a year-1 estimate at your 24.0% rate — not tax advice; consult a CPA.
Condition & rehab AI · 12 photos
This 3-bedroom, 2-bath home requires moderate renovations to update the kitchen and bathrooms, and replace worn flooring. The solid brick exterior and newer roof contribute to its fair condition, but the interior needs significant work to improve its resale value.
Repairs flagged
- Major kitchen appliances — need replacement
- Major bathroom fixtures — need replacement
- Major flooring — need replacement
Value-add opportunities
- Resale update kitchen appliances — modern appliances attract buyers
- Resale update bathroom fixtures — modern fixtures attract buyers
- Resale update flooring — new flooring enhances curb appeal
Renovation cost estimate screening
| Repair item | Severity | Est. cost |
|---|---|---|
| kitchen appliances · need replacement | Major | $15,000–50,000 |
| bathroom fixtures · need replacement | Major | $15,000–50,000 |
| flooring · need replacement | Major | $15,000–50,000 |
| Total estimated repair cost · 3 items | $45,000–150,000 |
Value-add ROI direction
- Resale update kitchen appliances — modern appliances attract buyers ↑
- Resale update bathroom fixtures — modern fixtures attract buyers ↑
- Resale update flooring — new flooring enhances curb appeal ↑
ⓘ Cost ranges are severity-bucket heuristics (US national rule-of-thumb). Get contractor quotes + a written scope before underwriting a rehab budget.
Schools (NCES district)
- District
- Naylor R-II
- NCES district ID
- 2921720
- Math proficiency
- 50% ▲ 5.00%
- Reading proficiency
- 50% ▲ 3.00%
- Median HH income
- $31,842
- Composite
- 43.07/100
- National rank
- #6636
- State rank
- #138 of 535 in MO
Livability — Naylor
- Score
- 59/100
- State rank
- #537
- US rank
- #20039
Category grades
Schools grade is shown separately in the Schools card above.
Census & demographics
- Census place
- Naylor, MO
- Population (ZIP)
- 684
Population outlook (Ripley County) Hauer SSP2
- Today (2025)
- 13,011 people
- By 2030
- 12,515 · -3.8%
- By 2040
- 11,512 · -11.5%
- By 2050
- 10,427 · -19.9%
- By 2075
- 7,833 · -39.8%
- By 2100
- 5,692 · -56.3%
Race, ethnicity, and origin ACS 2023
- Neighborhood character
- Predominantly White (85%)
- Race & ethnicity
- White 85% Two or more races 9% Hispanic / Latino 2%
- Common ancestry
- Lithuanian 3% Iranian 3% Serbian 2%
- Languages at home
- 98% English-only · German/W. Germanic 2%
Political lean MEDSL · Ripley
- 2024 margin
- Solid R (+73.0) · D 13.2% · R 86.2%
- 2008→2024 swing
- -43.0pp toward R · 2008: -30.1pp · 2024: -73.0pp
- All cycles
- 2024: R+73.0 2020: R+70.1 2016: R+66.9 2012: R+44.6 2008: R+30.1
Not yet ingested
- Civics
- —
Market trends
- HPI YoY
- —
- Current HPI
- —
- Rent YoY
- —
- Metro
- —
- State GDP YoY
- ▲ 1.84%
- F500 in state
- 20
Industry mix (Fortune 500 HQ in MO)
| Industry | F500 HQs | Revenue |
|---|---|---|
| Healthcare | 1 | $163B |
|
||
| Insurance | 1 | $21B |
|
||
| Industrial Technology | 1 | $17B |
|
||
| Retail | 1 | $16B |
|
||
| Industrial Distribution | 1 | $10B |
|
||
| Utilities | 1 | $9B |
|
||
Price history
1 event — show timeline
- 2026-06-16 Listed $99,900 MARIS as Distributed by MLS Grid
Cash-flow waterfall
monthlySold comps — $/sqft
last 12 mo · ≤1 miLoading sold comps…