203 N Cory Pl Pl · Sioux Falls, SD
Flood risk 1/10 · Minimal
- FEMA flood zone
- X (unshaded)
- Chance of flooding over 30 yrs
- 0.0%
- Est. flood insurance / yr
- $473 – $860
Fire risk 1/10 · Minimal
- Est. fire insurance / yr
- $1,342 – $2,492
Heat risk 2/10 · Minimal
- Hot days now (above 99°F)
- 7 days/yr
- Hot days in 30 yrs
- 14 days/yr
Wind risk 2/10 · Minimal
- Chance of severe wind over 30 yrs
- —
Air-quality risk 2/10 · Minimal
- Unhealthy air days now
- 1 days/yr
- Unhealthy air days in 30 yrs
- 1 days/yr
Risk factors via First Street. Map © Google.
Why this score? — see what drove the C+ grade
The composite is a weighted blend of 9 inputs, each scored 0–100. Each bar is that input's sub-score; the figure is the points it added to the 100-point composite (weight × sub-score).
- Cash flow +30.0/30.0
- DSCR +10.0/10.0
- 1% rule +8.4/10.0
- Schools +5.7/10.0
- Livability +4.2/5.0
- Rent growth +3.4/5.0
- Condition / age +2.2/5.0
- ARV discount +0.0/15.0
- Appreciation +0.0/10.0
$150,000
🖨 Deal sheet 📄 Offer letter ✓ Due diligence
Listing remarks MLS
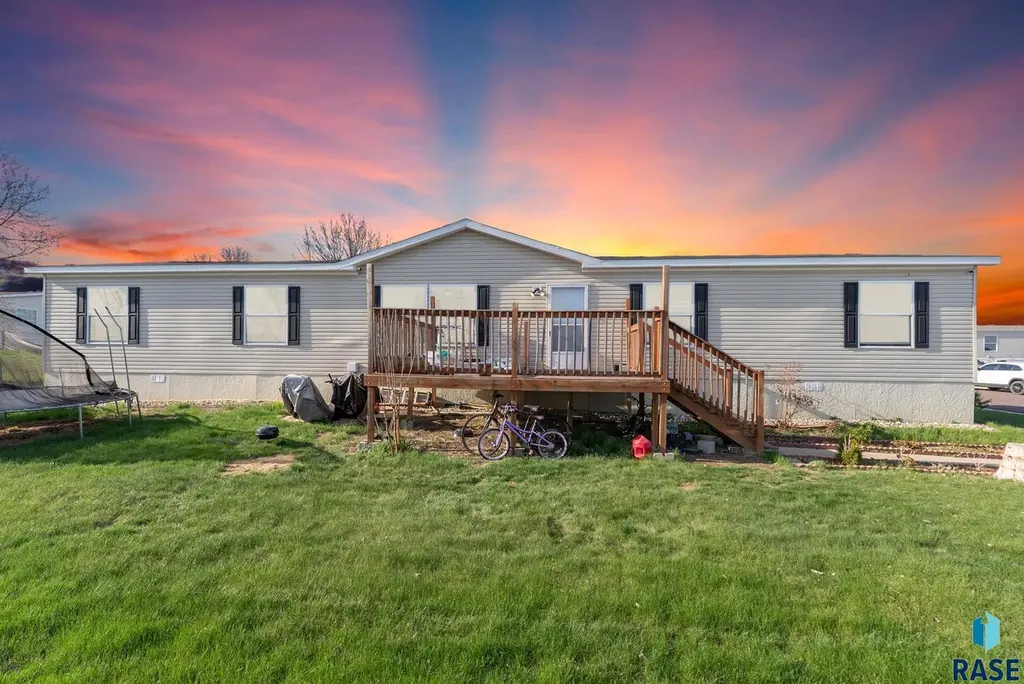
Welcome to 203 N Cory Pl in Sioux Falls — a rare opportunity to own a spacious 2,100+ sq ft mobile home in a desirable east-side location. Built in 2020, this newer home offers a well-designed 4 bed, 2 bath layout with plenty of room to live comfortably and entertain. Enjoy modern construction, open living spaces, and updated features throughout. Situated in a growing area with convenient access to shopping, parks, and main roads, this home delivers both comfort and location. Large homes with this much square footage and newer build at this price point are hard to find especially in this area so don’t wait.
Key facts
- Built 2020
- Listed 57 days
Neighborhood map
What this means for you Summary
Snapshot
- This is a 4-bed/2.0-bath manufactured listed at $150k. Condition is rated fair.
Deal economics
- At list price, monthly cash flow is $666 ($8k/yr) — positive.
- The deal already cash-flows at list — no discount required.
- Meets the 1% rule at list price ($2k rent vs $150k).
- Recommended offer: $146k (3.0% below list) — sets the bar for market timing.
- Cap rate 11.6% vs local median 2.6% in Sioux Falls — top-decile yield for the area; either an underpriced asset or a hidden risk that comps aren't pricing in. Stress-test before assuming the spread holds.
Location & tenants
- Location reads 85/100 on livability (#3 in SD, #610 nationally) — a professional / high-income tenant draw. Strengths: amenities A+, commute A+, cost of living A+; Watch: crime F.
- Brandon Valley School District 49-2 (town): math 60% / reading 70% proficiency, ranked #1 of 59 in SD (top 2%) — acceptable for families but not a draw, mixed tenant base, ~2y average lease; only 12% free/reduced lunch — higher-income household profile.
- Market conditions: Rents rising (+3.5%/yr); 499 active listings in the ZIP; 7 comparable units currently listed for rent nearby; rentals at typical pace (median 21d on market — plan ~3-4 weeks tenant-placement turnaround); solid renter incomes; 2,425 units permitted in Minnehaha County in 2024 (1,367 in 5+ unit buildings).
Forward outlook
- Local home prices are declining (-3.0%/yr); year-one equity from $1k of loan paydown is wiped out by about $4k of value loss. Plan a longer hold.
- Minnehaha County population projected at +46% by 2050 — long-run rental-demand tailwind backs the buy-and-hold thesis.
- At projected returns (-3.0% appreciation + 3.5% rent growth), your $42k cash investment doubles in ~7 years — after that, you're playing with house money.
Negotiation context
- It's been on market 57 days — a 3% lower offer ($146k) is reasonable based on typical stale-listing flexibility.
Questions for the listing agent
- It's been on market 57 days. Have you received any prior offers? Is the seller open to a 3% concession, seller financing, or rate buy-down credit?
- Have any recent inspections been done? Can we get a copy of the seller's disclosures and any deferred-maintenance estimates?
- Is there a deadline driving the sale (1031 exchange, divorce, estate, relocation)? That informs how much negotiation room exists.
- Schools are B-rated — typically a magnet for longer-tenancy family renters. What's the average tenant stay here, and is there a school-zone premium baked into asking?
- Crime grade is F in this area — have there been break-ins, vandalism, or insurance claims at this property in the last 3 years? What carrier currently insures it and at what premium?
- What's the average days-on-market for RENTAL listings here right now (not sales)? A rising rental-DOM trend means longer vacancies and softer asking-rent achievability than the comps imply.
- What's the recent tenant-quality profile in this submarket — average credit score on applications, eviction rate, late-payment / NSF rate, and stable-employment percentage? A property-management company in the area should have these aggregated.
- How much new for-sale + rental construction is in the pipeline within 1–3 miles? Heavy new supply typically softens prices + rents 12–24 months out; constrained supply supports both.
Investment metrics
- 1% rule
- 1.34% ✓
- Cap rate
- 11.62%
- Cash-on-cash
- 19.01%
- DSCR
- 1.85
- GRM
- 6.2
CMA / ARV
- ARV (median comp)
- $105,250
- List price
- $150,000
- Delta
- 42.52%
- Verdict
- OVERPRICED
- Comps
- 2 within 2.0 mi
Show comp detail 1 sale within ~0.75 mi
| Address | Dist | Beds/Ba | Sqft | Sold | Price | $/sf | Match |
|---|---|---|---|---|---|---|---|
| 112 N Caley Pl | 0.11mi | 4/2.0 | 2,304 (+8%) | 16mo | $120,000 | $52 | 68 |
Match score weights: distance 35% · size 25% · config 20% · recency 20%. Top-matched comps best support the ARV.
Projected returns pro-forma
-3.0% appreciation · 3.46% rent growth · sell at horizon
- IRR
- 11.3%
- Equity multiple
- 1.45×
- Total profit
- $18,973
- Equity at exit
- $22,365
- IRR
- 20.7%
- Equity multiple
- 2.78×
- Total profit
- $74,805
- Equity at exit
- $12,969
Cash invested: $42,000 (down + closing). Projections, not guarantees.
Landlord ↔ Tenant lean methodology
- Overall (STATE)
- 83 Strongly Landlord-Friendly
- State South Dakota
- 83 Strongly Landlord-Friendly · R+16
- County
- — inherits STATE
- City
- — inherits STATE
ZIP-level market 57110
- Home prices YoY
- -29.6%
- Rents YoY
- 3.5%
- Active inventory
- 499
- Price-to-rent
- 6.2×
Monthly cashflow live
- Estimated rent
- $2,009 high interval (Pro) →
- Mortgage (P&I)
- −$787
- Tax from tax record
- −$72 /mo · $867/yr
- Insurance
- −$62
- HOA
- −$0
- Vacancy / Maint / Mgmt
- −$422
- Net cashflow
- $666
Break-even live
UW: 25.0% down · 7.5% · 30yr · 1.5% tax · 5.0% vac · 8.0% maint · 8.0% mgmt
Financing live
Cash to close
- Down payment
- $37,500
- Closing costs
- $4,500
- Reserves months
- —
- Total cash needed
- —
Loan-product check · same deal, 3 products live
Conventional
25% down · 7.5% · 30yr
- Down + closing
- —
- Monthly P&I
- —
- Monthly cashflow
- —
- DSCR
- —
- Eligible?
- —
Personal DTI + credit; lowest rate.
DSCR
20% down · 8.5% · 30yr
- Down + closing
- —
- Monthly P&I
- —
- Monthly cashflow
- —
- DSCR
- —
- Eligible?
- —
No personal income docs; deal must DSCR.
Hard money
10% down · 12.0% · 12mo
- Down + closing
- —
- Monthly P&I
- —
- Monthly cashflow
- —
- DSCR
- —
- Eligible?
- —
Short-term bridge; refi at stabilization.
Rent comps 7 comps
| Address | Beds | Baths | Sqft | Rent | $/sqft | DOM | Units | Dist |
|---|---|---|---|---|---|---|---|---|
| 5213 E Prospect St Sioux Falls, SD | 4.0 | 2.0 | 1750 | $1,995 | $1.14 | 21d | 1 | 0.71mi |
| 626 N Sycamore Ave Sioux Falls, SD | 4.0 | 3.0 | 2364 | $2,200 | $0.93 | 13d | 1 | 0.72mi |
| 6544 E Pine Grove Pl Sioux Falls, SD | 3.0 | 2.0 | 1557 | $2,240 | $1.44 | 13d | 1 | 0.72mi |
| 4001 E 20th St Sioux Falls, SD | 5.0 | 2.0 | 2000 | $2,000 | $1.00 | 13d | 1 | 1.35mi |
| 3210 E 3rd St Unit 3210 Sioux Falls, SD | 3.0 | 2.0 | 2100 | $1,895 | $0.90 | 21d | 1 | 1.40mi |
| 6006 E Copper PL Sioux Falls, SD | 3.0 | 2.5 | 1527 | $1,800 | $1.18 | 21d | 1 | 1.48mi |
| 5700 Hitching Pl Unit 5725 Sioux Falls, SD | 3.0 | 2.5 | 1435 | $1,650 | $1.15 | 43d | 1 | 1.48mi |
Listing history 16 events
-
2026-06-18days on market $150,000 Active 57 DOM
-
2026-06-17days on market $150,000 Active 56 DOM
-
2026-06-16days on market $150,000 Active 55 DOM
-
2026-06-15days on market $150,000 Active 54 DOM
-
2026-06-14days on market $150,000 Active 52 DOM
-
2026-06-13days on market $150,000 Active 51 DOM
-
2026-06-10days on market $150,000 Active 49 DOM
-
2026-06-09days on market $150,000 Active 48 DOM
-
2026-06-09price $150,000 Active 47 DOM
-
2026-06-08days on market $155,000 Active 47 DOM
-
2026-06-07days on market $155,000 Active 46 DOM
-
2026-06-02days on market $155,000 Active 41 DOM
-
2026-06-01days on market $155,000 Active 40 DOM
-
2026-05-31days on market $155,000 Active 39 DOM
-
2026-05-30days on market $155,000 Active 38 DOM
-
2026-04-22$155,000 Active 626-char remark
Show marketing remark (626 chars)
Welcome to 203 N Cory Pl in Sioux Falls — a rare opportunity to own a spacious 2,100+ sq ft mobile home in a desirable east-side location. Built in 2020, this newer home offers a well-designed 4 bed, 2 bath layout with plenty of room to live comfortably and entertain. Enjoy modern construction, open living spaces, and updated features throughout. Situated in a growing area with convenient access to shopping, parks, and main roads, this home delivers both comfort and location. Large homes with this much square footage and newer build at this price point are hard to find especially in this area so don’t wait.
ⓘ Source: listings_history table (triggers on properties + properties_extension) + one-shot
backfill from property_details.listing_events for pre-trigger history.
Tax reassessment forecast SD · Resets to sale price
- Current annual tax
- $867 · $72/mo
- Projected year-2 tax
- $1,965 · $164/mo
- Expected delta
- +$1,098/yr (+$92/mo · 126.7%)
ⓘ Screening estimate from a state-policy table — verify with the county assessor before closing.
Climate risk First Street
- Flood 1/10 Low FEMA zone X (unshaded) · 0% chance over 30 yrs
- Wildfire 1/10 Low
- Heat 2/10 Low 7 d/yr ≥99°F today · 14 d/yr by 30 yrs out
- Wind 2/10 Low
- Air quality 2/10 Low 1 unhealthy d/yr today · 1 by 30 yrs out
Nearby sold comps map
Loading sold comps map…
Walkable amenities ~0.75 mi
Loading nearby amenities…
Taxation est. · year 1
- Rental income
- $24,104
- − Mortgage interest
- −$8,402
- − Property taxes
- −$867
- − Insurance
- −$750
- − Repairs & maintenance
- −$1,928
- − Management
- −$1,928
- − Depreciation
- −$4,364
- Taxable income
- $5,865
- Est. tax owed @ 24.0%
- −$1,408
- After-tax cash flow
- $6,579/yr
For passive investors: Depreciation is non-cash, so a rental often shows a tax loss while cash-flowing — sheltering income. Rental losses are passive: they offset passive income freely, and up to $25,000/yr can offset ordinary (W-2) income if you actively participate and your MAGI is under $100k (phasing out to $0 by $150k); unused losses carry forward. On sale, claimed depreciation is recaptured at up to 25%, and gains may owe capital-gains tax (a 1031 exchange can defer both). Figures are a year-1 estimate at your 24.0% rate — not tax advice; consult a CPA.
Condition & rehab AI · 12 photos
This mobile home requires moderate repairs and maintenance, particularly in the paint and kitchen cabinets. Painting and updating the cabinets can significantly increase its resale value.
Repairs flagged
- Major paint — paint appears worn and needs touch-up
- Minor kitchen cabinets — slight wear
- Minor bathroom cabinets — slight wear
Value-add opportunities
- Resale painting — Fresh paint can significantly improve the home's curb appeal and value
- Resale kitchen cabinets — Newer, more modern cabinets can enhance the kitchen's appearance and functionality
- Resale bathroom cabinets — Upgrading the bathroom cabinets can improve the home's overall aesthetic and functionality
Renovation cost estimate screening
| Repair item | Severity | Est. cost |
|---|---|---|
| paint · paint appears worn and needs touch-up | Major | $15,000–50,000 |
| kitchen cabinets · slight wear | Minor | $500–3,000 |
| bathroom cabinets · slight wear | Minor | $500–3,000 |
| Total estimated repair cost · 3 items | $16,000–56,000 |
Value-add ROI direction
- Resale painting — Fresh paint can significantly improve the home's curb appeal and value ↑
- Resale kitchen cabinets — Newer, more modern cabinets can enhance the kitchen's appearance and functionality ↑
- Resale bathroom cabinets — Upgrading the bathroom cabinets can improve the home's overall aesthetic and functionality ↑
ⓘ Cost ranges are severity-bucket heuristics (US national rule-of-thumb). Get contractor quotes + a written scope before underwriting a rehab budget.
Schools (NCES district)
- District
- Brandon Valley School District 49-2
- NCES district ID
- 4607950
- Math proficiency
- 60% ▼ -6.00%
- Reading proficiency
- 70% ▼ -2.00%
- Median HH income
- $73,211
- Composite
- 57.4/100
- National rank
- #1078
- State rank
- #1 of 59 in SD
Livability — Sioux Falls
- Score
- 85/100
- State rank
- #3
- US rank
- #610
Category grades
Schools grade is shown separately in the Schools card above.
Census & demographics
- Census place
- Sioux Falls, SD
- County
- Minnehaha County · 191,523 people
- City population
- 207,623
- Metro
- Sioux Falls, SD
- Population (ZIP)
- 23,313
- Household income
- $88,955
- Rent vs Own
- Severe rent burden
- 635.0
Population outlook (Minnehaha County) Hauer SSP2
- Today (2025)
- 222,323 people
- By 2030
- 241,430 · +8.6%
- By 2040
- 281,643 · +26.7%
- By 2050
- 325,574 · +46.4%
- By 2075
- 469,313 · +111.1%
- By 2100
- 664,763 · +199.0%
Race, ethnicity, and origin ACS 2023
- Neighborhood character
- Predominantly White (78%)
- Race & ethnicity
- White 78% Black 7% Two or more races 5% Hispanic / Latino 5% Asian 4%
- Common ancestry
- Portuguese 11% Iranian 8% Romanian 2%
- Foreign-born
- 12% · Canada, India, South Korea
- Languages at home
- 85% English-only · Spanish 5% Other Indo-European 3% Other Asian/Pacific 1%
Political lean MEDSL · Minnehaha
- 2024 margin
- R (+12.7) · D 42.5% · R 55.2% · Other 2.4%
- 2008→2024 swing
- -13.4pp toward R · 2008: 0.7pp · 2024: -12.7pp
- All cycles
- 2024: R+12.7 2020: R+9.5 2016: R+14.6 2012: R+7.4 2008: D+0.7
Not yet ingested
- Civics
- —
Market trends
- HPI YoY
- ▼ -88.96%
- Current HPI
- 211.5301
- Rent YoY
- ▲ 3.46%
- Metro
- Sioux Falls, SD
- State GDP YoY
- ▲ 0.70%
- F500 in state
- 2
Industry mix (Fortune 500 HQ in SD)
| Industry | F500 HQs | Revenue |
|---|---|---|
| Utilities | 1 | $1B |
|
||
Price history
1 event — show timeline
- 2026-04-22 Listed $155,000 REALTOR® Association of the Sioux Empire
Property tax history
-0.3%/yrLatest (2024): $867 · -4.7% YoY. Source: county tax records.
Cash-flow waterfall
monthlySold comps — $/sqft
last 12 mo · ≤1 miLoading sold comps…