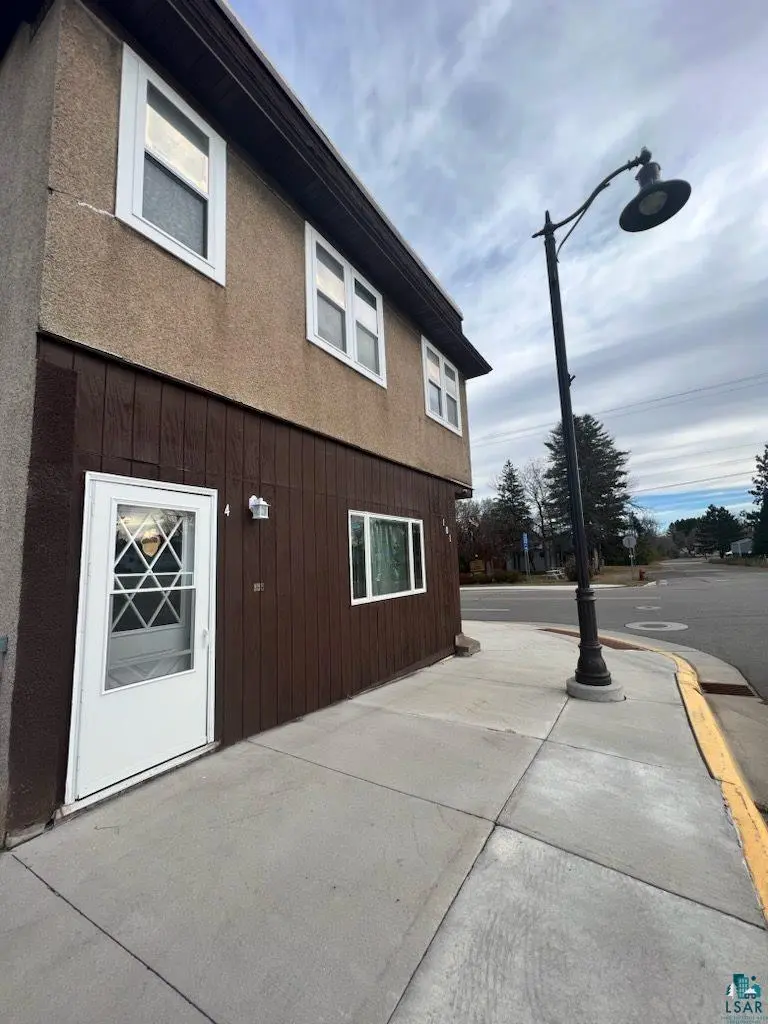
 Fourplex
101 7th Ave Ave W · Floodwood, MN
Flood risk 6/10 · Moderate
- FEMA flood zone
- X
- Chance of flooding over 30 yrs
- 0.7%
- Est. flood insurance / yr
- $473 – $860
Fire risk 4/10 · Minor
- Est. fire insurance / yr
- $888 – $1,650
Heat risk 1/10 · Minimal
- Hot days now (above 91°F)
- 7 days/yr
- Hot days in 30 yrs
- 13 days/yr
Wind risk 1/10 · Minimal
- Chance of severe wind over 30 yrs
- —
Air-quality risk 1/10 · Minimal
- Unhealthy air days now
- 0 days/yr
- Unhealthy air days in 30 yrs
- 0 days/yr
Risk factors via First Street. Map © Google.
Why this score? — see what drove the B+ grade
The composite is a weighted blend of 9 inputs, each scored 0–100. Each bar is that input's sub-score; the figure is the points it added to the 100-point composite (weight × sub-score).
- Cash flow +30.0/30.0
- 1% rule +10.0/10.0
- DSCR +10.0/10.0
- Appreciation +8.2/10.0
- ARV discount +7.5/15.0
- Schools +4.0/10.0
- Livability +3.3/5.0
- Rent growth +2.5/5.0
- Condition / age +2.5/5.0
$199,900
🖨 Deal sheet 📄 Offer letter ✓ Due diligence
Multi-family units
County records classify this as Multi-Family (5+ Unit). Listing-text estimate: 4 units. estimate disagrees with records
5+ unit building — per-unit beds/baths from public records are typically unavailable; the breakdown below (if shown) is an estimate from the listing text.
Listing remarks MLS
Awesome 4-plex on the main drag in Floodwood!! Fully leased - all units are really nice. Numbers available on request. Seller is a licensed real estate broker in the state of Minnesota.
Key facts
- 6,413 sq ft lot
- Built 1965
- Listed 73 days
Neighborhood map
What this means for you Summary
Snapshot
- This is a 4 × 6-bed/5.0-bath units multifamily listed at $200k.
Deal economics
- At list price, monthly cash flow is $2k ($27k/yr) — positive. Per door: $569/mo.
- The deal already cash-flows at list — no discount required.
- Meets the 1% rule at list price ($5k rent vs $200k).
- Recommended offer: $188k (6.0% below list) — sets the bar for market timing.
Location & tenants
- Location reads 66/100 on livability (#502 in MN) — a middle-class / working-renter tenant base. Strengths: crime A+, cost of living A+, housing A+; Watch: health & safety D, amenities F, commute F.
- Floodwood Public School District (rural): math 40% / reading 50% proficiency, ranked #334 of 467 in MN (top 72%) — families likely to look elsewhere, expect single-tenant / working-renter base with shorter leases.
- Market conditions: 23 active listings in the ZIP; 639 units permitted in St. Louis County in 2024 (338 in 5+ unit buildings).
Forward outlook
- In year one you build about $14k of equity ($1k loan paydown + $13k appreciation (6.5% local appreciation)).
- At projected returns (6.5% appreciation + 3.0% rent growth), your $56k cash investment doubles in ~2 years — after that, you're playing with house money.
- By year 3, paydown + projected appreciation supports a ~$35k cash-out refi (75% LTV) — recoverable capital for the next deal without selling this one.
Negotiation context
- It's been on market 74 days — a 6% lower offer ($188k) is reasonable based on typical stale-listing flexibility.
- 6 sale attempts since 3y ago with the ask held roughly flat each time — persistent listings suggest the price (not the market) is what's stuck; bring a comps-based counter.
- Current owner paid $90k; list at $200k implies a 122% gain — meaningful room to come down on a strong offer.
Risks & watch-outs
- Climate carrying-cost: major flood risk — expect insurance premiums to compound above CPI over the hold.
Questions for the listing agent
- It's been on market 74 days. Have you received any prior offers? Is the seller open to a 6% concession, seller financing, or rate buy-down credit?
- Can we see the unit-by-unit rent roll, current vacancy, and any below-market leases? What's the average tenancy length?
- What capital expenditures (roof, boiler, parking lot, exteriors) have been made in the last 5 years, and what's planned in the next 2?
- Built in 1965 — when were the roof, HVAC, electrical panel, plumbing, and water heater last replaced?
- Why hasn't it sold? Are there any deal-killer items the seller is aware of (foundation, flood, title, zoning, code violations)?
- Is there a deadline driving the sale (1031 exchange, divorce, estate, relocation)? That informs how much negotiation room exists.
- What's the average days-on-market for RENTAL listings here right now (not sales)? A rising rental-DOM trend means longer vacancies and softer asking-rent achievability than the comps imply.
- What's the recent tenant-quality profile in this submarket — average credit score on applications, eviction rate, late-payment / NSF rate, and stable-employment percentage? A property-management company in the area should have these aggregated.
- How much new apartment / multifamily construction is in the pipeline within 1–3 miles? Heavy new supply (>2% of stock underway) typically softens rents 12–24 months out; light construction supports rent growth.
Investment metrics
- 1% rule
- 2.37% ✓
- Cap rate
- 19.96%
- Cash-on-cash
- 48.80%
- DSCR
- 3.17
- GRM
- 3.5
CMA / ARV
No comps found within radius.
Projected returns pro-forma
6.45% appreciation · 3.0% rent growth · sell at horizon
- IRR
- 58.3%
- Equity multiple
- 4.72×
- Total profit
- $208,188
- Equity at exit
- $131,389
- IRR
- 54.8%
- Equity multiple
- 9.89×
- Total profit
- $497,837
- Equity at exit
- $243,372
Cash invested: $55,972 (down + closing). Projections, not guarantees.
Landlord ↔ Tenant lean methodology
- Overall (STATE)
- 46 Balanced
- State Minnesota
- 46 Balanced · D+2
- County
- — inherits STATE
- City
- — inherits STATE
ZIP-level market 55736
- Home prices YoY
- 3.0%
- Active inventory
- 23
- Price-to-rent
- 14.1×
Monthly cashflow live
- Estimated rent
- $4,742 medium interval (Pro) →
- Mortgage (P&I)
- −$1,048
- Tax from tax record
- −$338 /mo · $4,062/yr
- Insurance
- −$83
- HOA
- −$0
- Vacancy / Maint / Mgmt
- −$996
- Net cashflow
- $2,276
Break-even live
4-unit breakdown (identical units grouped — click to expand)
| Units | Beds | Baths | Est. rent |
|---|---|---|---|
| 4× units | 6 | 5 | $4,744 |
| #1 | 6 | 5 | $1,186 |
| #2 | 6 | 5 | $1,186 |
| #3 | 6 | 5 | $1,186 |
| #4 | 6 | 5 | $1,186 |
| Total (4 units) | $4,742 | ||
UW: 25.0% down · 7.5% · 30yr · 1.5% tax · 5.0% vac · 8.0% maint · 8.0% mgmt
Financing live
Cash to close
- Down payment
- $49,975
- Closing costs
- $5,997
- Reserves months
- —
- Total cash needed
- —
Loan-product check · same deal, 3 products live
Conventional
25% down · 7.5% · 30yr
- Down + closing
- —
- Monthly P&I
- —
- Monthly cashflow
- —
- DSCR
- —
- Eligible?
- —
Personal DTI + credit; lowest rate.
DSCR
20% down · 8.5% · 30yr
- Down + closing
- —
- Monthly P&I
- —
- Monthly cashflow
- —
- DSCR
- —
- Eligible?
- —
No personal income docs; deal must DSCR.
Hard money
10% down · 12.0% · 12mo
- Down + closing
- —
- Monthly P&I
- —
- Monthly cashflow
- —
- DSCR
- —
- Eligible?
- —
Short-term bridge; refi at stabilization.
Listing history 31 events
-
2026-06-19days on market $199,900 Active 74 DOM
-
2026-06-18days on market $199,900 Active 73 DOM
-
2026-06-17days on market $199,900 Active 72 DOM
-
2026-06-16days on market $199,900 Active 71 DOM
-
2026-06-15days on market $199,900 Active 70 DOM
-
2026-06-14days on market $199,900 Active 68 DOM
-
2026-06-13days on market $199,900 Active 67 DOM
-
2026-06-10days on market $199,900 Active 65 DOM
-
2026-06-09days on market $199,900 Active 64 DOM
-
2026-06-08days on market $199,900 Active 63 DOM
-
2026-06-07days on market $199,900 Active 62 DOM
-
2026-06-05days on market $199,900 Active 59 DOM
-
2026-06-02days on market $199,900 Active 57 DOM
-
2026-06-01days on market $199,900 Active 56 DOM
-
2026-05-31days on market $199,900 Active 55 DOM
-
2026-05-30days on market $199,900 Active 54 DOM
-
2026-04-07$199,900 Active 185-char remark
Show marketing remark (185 chars)
Awesome 4-plex on the main drag in Floodwood!! Fully leased - all units are really nice. Numbers available on request. Seller is a licensed real estate broker in the state of Minnesota.
-
2025-10-30historical
-
2025-10-20status Active
-
2025-10-06status Pending
-
2025-08-01price $209,900
-
2025-03-29$229,900 Active
-
2023-10-04historical $500
-
2023-08-29$500
-
2023-08-20historical $500
-
2023-08-19$500
-
2023-07-16historical $600
-
2023-07-15$600
-
2022-05-26soldstatus $90,000
-
2019-02-25soldstatus $90,000
-
2008-06-13soldstatus $77,000
ⓘ Source: listings_history table (triggers on properties + properties_extension) + one-shot
backfill from property_details.listing_events for pre-trigger history.
Tax reassessment forecast MN · Partial reset (capped growth)
- Current annual tax
- $4,062 · $338/mo
- Projected year-2 tax
- $4,062 · $338/mo
- Expected delta
- $0/yr ($0/mo · 0.0%)
ⓘ Screening estimate from a state-policy table — verify with the county assessor before closing.
Climate risk First Street
- Flood 6/10 Major FEMA zone X · 70% chance over 30 yrs
- Wildfire 4/10 Moderate
- Heat 1/10 Low 7 d/yr ≥91°F today · 13 d/yr by 30 yrs out
- Wind 1/10 Low
- Air quality 1/10 Low 0 unhealthy d/yr today · 0 by 30 yrs out
Nearby sold comps map
Loading sold comps map…
Walkable amenities ~0.75 mi
Loading nearby amenities…
Taxation est. · year 1
- Rental income
- $56,904
- − Mortgage interest
- −$11,198
- − Property taxes
- −$4,062
- − Insurance
- −$1,000
- − Repairs & maintenance
- −$4,552
- − Management
- −$4,552
- − Depreciation
- −$5,815
- Taxable income
- $25,725
- Est. tax owed @ 24.0%
- −$6,174
- After-tax cash flow
- $21,139/yr
For passive investors: Depreciation is non-cash, so a rental often shows a tax loss while cash-flowing — sheltering income. Rental losses are passive: they offset passive income freely, and up to $25,000/yr can offset ordinary (W-2) income if you actively participate and your MAGI is under $100k (phasing out to $0 by $150k); unused losses carry forward. On sale, claimed depreciation is recaptured at up to 25%, and gains may owe capital-gains tax (a 1031 exchange can defer both). Figures are a year-1 estimate at your 24.0% rate — not tax advice; consult a CPA.
Schools (NCES district)
- District
- Floodwood Public School District
- NCES district ID
- 2712210
- Math proficiency
- 40% ▼ -5.00%
- Reading proficiency
- 50% ▬ 0.00%
- Median HH income
- $38,487
- Composite
- 39.74/100
- National rank
- #7994
- State rank
- #334 of 467 in MN
Livability — Floodwood
- Score
- 66/100
- State rank
- #502
- US rank
- #12027
Category grades
Schools grade is shown separately in the Schools card above.
Census & demographics
- Census place
- Floodwood, MN
- Population (ZIP)
- 1,326
Population outlook (St. Louis County) Hauer SSP2
- Today (2025)
- 202,411 people
- By 2030
- 203,234 · +0.4%
- By 2040
- 202,520 · +0.1%
- By 2050
- 200,853 · -0.8%
- By 2075
- 200,943 · -0.7%
- By 2100
- 192,058 · -5.1%
Race, ethnicity, and origin ACS 2023
- Neighborhood character
- Predominantly White (94%)
- Race & ethnicity
- White 94% Two or more races 3%
- Common ancestry
- Portuguese 9% Romanian 8% Lithuanian 1%
- Foreign-born
- 0%
- Languages at home
- 98% English-only · Spanish 1%
Political lean MEDSL · St. Louis
- 2024 margin
- D (+13.7) · D 55.9% · R 42.2% · Other 1.8%
- 2008→2024 swing
- -18.8pp toward R · 2008: 32.5pp · 2024: 13.7pp
- All cycles
- 2024: D+13.7 2020: D+15.6 2016: D+11.8 2012: D+29.6 2008: D+32.5
Not yet ingested
- Civics
- —
Market trends
- HPI YoY
- ▲ 6.45%
- Current HPI
- 222.9135
- Rent YoY
- —
- Metro
- —
- State GDP YoY
- ▲ 2.41%
- F500 in state
- 34
Industry mix (Fortune 500 HQ in MN)
| Industry | F500 HQs | Revenue |
|---|---|---|
| Healthcare | 2 | $407B |
|
||
| Retail | 2 | $150B |
|
||
| Consumer Goods | 2 | $32B |
|
||
| Industrial Machinery | 2 | $6B |
|
||
| Agriculture | 1 | $40B |
|
||
| Healthcare / Medical Devices | 1 | $32B |
|
||
Price history
+159.6% since first listed15 events — show timeline
- 2026-04-07 Listed $199,900 LSAR
- 2025-10-30 Listing Removed — NORTHSTARMLS as Distributed by MLS Grid
- 2025-10-20 Relisted — NORTHSTARMLS as Distributed by MLS Grid
- 2025-10-06 Pending — NORTHSTARMLS as Distributed by MLS Grid
- 2025-08-01 Price Changed $209,900 NORTHSTARMLS as Distributed by MLS Grid
- 2025-03-29 Listed $229,900 NORTHSTARMLS as Distributed by MLS Grid
- 2023-10-04 Rental Removed $500 APPFOLIO
- 2023-08-29 Listed for Rent $500 APPFOLIO
- 2023-08-20 Rental Removed $500 APPFOLIO
- 2023-08-19 Listed for Rent $500 APPFOLIO
- 2023-07-16 Rental Removed $600 APPFOLIO
- 2023-07-15 Listed for Rent $600 APPFOLIO
- 2022-05-26 Sold (Public Records) $90,000 Public Records
- 2019-02-25 Sold (Public Records) $90,000 Public Records
- 2008-06-13 Sold (Public Records) $77,000 Public Records
Property tax history
+7.8%/yrLatest (2025): $4,062 · +14.9% YoY. Source: county tax records.
Cash-flow waterfall
monthlySold comps — $/sqft
last 12 mo · ≤1 miLoading sold comps…