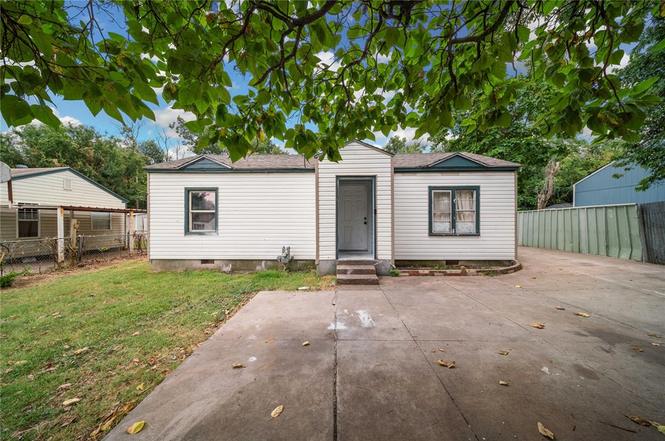
3820 SW 34th St · Oklahoma City, OK
Flood risk 1/10 · Minimal
- FEMA flood zone
- X (unshaded)
- Chance of flooding over 30 yrs
- 0.0%
- Est. flood insurance / yr
- $507 – $1,088
Fire risk 2/10 · Minimal
- Est. fire insurance / yr
- $2,463 – $4,575
Heat risk 5/10 · Moderate
- Hot days now (above 107°F)
- 7 days/yr
- Hot days in 30 yrs
- 18 days/yr
Wind risk 2/10 · Minimal
- Chance of severe wind over 30 yrs
- 4.0%
Air-quality risk 1/10 · Minimal
- Unhealthy air days now
- 0 days/yr
- Unhealthy air days in 30 yrs
- 0 days/yr
Risk factors via First Street. Map © Google.
Why this score? — see what drove the C- grade
The composite is a weighted blend of 9 inputs, each scored 0–100. Each bar is that input's sub-score; the figure is the points it added to the 100-point composite (weight × sub-score).
- Cash flow +19.0/30.0
- ARV discount +15.0/15.0
- DSCR +6.0/10.0
- Livability +4.0/5.0
- 1% rule +3.9/10.0
- Rent growth +2.8/5.0
- Condition / age +2.5/5.0
- Schools +0.7/10.0
- Appreciation +0.0/10.0
$114,000
🖨 Deal sheet 📄 Offer letter ✓ Due diligence
Listing remarks
Welcome to 3820 SW 34th Street, Oklahoma City, OK 73119! Whether you're looking to expand your investment portfolio or purchase a home to make your own, this property offers flexibility and potential. Conveniently located in an established neighborhood with quick access to major highways, shopping, dining, and everyday amenities, this property presents an excellent opportunity for investors and owner-occupants alike. Don't miss your chance to add value and maximize the potential of this Oklahoma City property.
Key facts
- 5,998 sq ft lot
- Built 1950
- Listed 2 days
Tags
Property features AI
Finance
- Other: Located in Airport Heights addition; Occupied: No; Listing status: Active; Living area reported by assessor
- Financial info: Not assumable
- HOA & community: No mandatory association dues
Exterior
- Utilities: No flood insurance required (per listing); Homestead status claimed
- Home design: Single family residence; One story; Existing property
- Construction: Composition roof (replaced 2020); Other construction materials; Post-tension foundation
- Exterior features: Interior lot
Interior
- Bedrooms: 2 bedrooms
- Bathrooms: 1 full bathroom
- Heating & cooling: No cooling specified
- Interior features: One living area; No fireplace; No central cooling
Neighborhood map
What this means for you Summary
Snapshot
- This is a 2-bed/1.0-bath single-family listed at $114k.
Deal economics
- At list price, monthly cash flow is $119 ($1k/yr) — positive.
- The deal already cash-flows at list — no discount required.
- To meet the 1% rule (rent ≥ 1% of price), the offer needs to be $102k (10.8% below list).
- Recommended offer: $102k (10.8% below list) — sets the bar for 1% rule.
- Cap rate 7.5% vs local median 3.7% in Oklahoma City — top-decile yield for the area; either an underpriced asset or a hidden risk that comps aren't pricing in. Stress-test before assuming the spread holds.
Location & tenants
- Location reads 80/100 on livability (#3 in OK, #1,635 nationally) — a professional / high-income tenant draw. Strengths: amenities A+, commute A+, cost of living A+; Watch: crime F.
- Oklahoma City (urban): math 7% / reading 10% proficiency, ranked #254 of 270 in OK (top 94%) — low school quality limits family demand, transient renter base, plan for 1-2y turnover; 82% free/reduced lunch — lower-income household profile, screen leases tightly.
- Zoned schools: Adams Es (math 8% / reading 2%, grade F, #766 of 845 statewide, top 94%, 406 students, 0% FRL); Capitol Hill Hs (math 2% / reading 4%, grade F, #444 of 447 statewide, top 99%, 1,455 students, 0% FRL) — zoned schools average 0% FRL vs 82% district-wide (82 pts lower); this property's tenant base skews higher-income than the district average.
- Market conditions: Rents rising (+1.1%/yr); 93 active listings in the ZIP; 15 comparable units currently listed for rent nearby; rentals at typical pace (median 17d on market — plan ~3-4 weeks tenant-placement turnaround); 40% of comp listings sitting > 30 days — soft ceiling on asking rent; 5,365 units permitted in Oklahoma County in 2024 (569 in 5+ unit buildings).
Forward outlook
- Local home prices are declining (-3.0%/yr); year-one equity from $788 of loan paydown is wiped out by about $3k of value loss. Plan a longer hold.
- Oklahoma County population projected at +41% by 2050 — long-run rental-demand tailwind backs the buy-and-hold thesis.
Negotiation context
- Only 2 days on market — expect competitive offers; lowballing is unlikely to land.
- 3 sale attempts with the ask held roughly flat each time — persistent listings suggest the price (not the market) is what's stuck; bring a comps-based counter.
- Current owner paid $3k; list at $114k implies a 3700% gain — meaningful room to come down on a strong offer.
Risks & watch-outs
- Watch-outs: built in 1950 — expect roof / HVAC / electrical / plumbing capex.
- Climate carrying-cost: extreme-heat days projected 7→18/yr by 2055 (HVAC capex compounding) — expect insurance premiums to compound above CPI over the hold.
Questions for the listing agent
- Built in 1950 — when were the roof, HVAC, electrical panel, plumbing, and water heater last replaced?
- Is there a deadline driving the sale (1031 exchange, divorce, estate, relocation)? That informs how much negotiation room exists.
- Schools are F-rated, which usually means shorter tenancies and higher turnover. Who's the typical renter profile here, and what's been the actual vacancy rate?
- Crime grade is F in this area — have there been break-ins, vandalism, or insurance claims at this property in the last 3 years? What carrier currently insures it and at what premium?
- What's the average days-on-market for RENTAL listings here right now (not sales)? A rising rental-DOM trend means longer vacancies and softer asking-rent achievability than the comps imply.
- What's the recent tenant-quality profile in this submarket — average credit score on applications, eviction rate, late-payment / NSF rate, and stable-employment percentage? A property-management company in the area should have these aggregated.
- How much new for-sale + rental construction is in the pipeline within 1–3 miles? Heavy new supply typically softens prices + rents 12–24 months out; constrained supply supports both.
Investment metrics
- 1% rule
- 0.89% ✗
- Cap rate
- 7.54%
- Cash-on-cash
- 4.46%
- DSCR
- 1.20
- GRM
- 9.3
CMA / ARV
- ARV (on-the-fly)
- $138,978
- Comps found
- 12
Show comp detail 12 sales within ~0.75 mi
| Address | Dist | Beds/Ba | Sqft | Sold | Price | $/sf | Match |
|---|---|---|---|---|---|---|---|
| 3809 SW 40th Pl | 0.32mi | 2/1.0 | 1,004 (-9%) | 7mo | $70,000 | $70 | 65 |
| 3825 SW 39th St | 0.25mi | 3/1.0 (+1) | 1,155 (+5%) | 15mo | $145,000 | $126 | 63 |
| 3200 S Stults Ave | 0.60mi | 3/1.0 (+1) | 1,076 (-2%) | 1mo | $137,800 | $128 | 62 |
| 3224 S Goff Ave | 0.43mi | 3/1.0 (+1) | 990 (-10%) | 1mo | $81,000 | $82 | 57 |
| 3520 S Parkview Ave | 0.64mi | 3/1.0 (+1) | 1,068 (-3%) | 5mo | $110,000 | $103 | 56 |
| 3427 Campbell Pl | 0.66mi | 2/1.0 | 1,008 (-9%) | 0mo | $52,000 | $52 | 55 |
| 3623 SW 40th St | 0.41mi | 3/2.0 (+1) | 1,028 (-7%) | 11mo | $165,000 | $161 | 51 |
| 3745 SW 43rd St | 0.54mi | 3/1.0 (+1) | 1,160 (+5%) | 13mo | $55,000 | $47 | 50 |
| 3522 SW 39th St | 0.47mi | 3/2.0 (+1) | 1,008 (-9%) | 6mo | $160,000 | $159 | 49 |
| 3840 SW 39th St | 0.28mi | 3/1.0 (+1) | 960 (-13%) | 16mo | $140,000 | $146 | 47 |
| 3901 S Goff Ave | 0.48mi | 3/1.5 (+1) | 1,208 (+10%) | 15mo | $155,000 | $128 | 42 |
| 3725 SW 25th St | 0.73mi | 3/1.5 (+1) | 1,264 (+15%) | 1mo | $99,900 | $79 | 34 |
Match score weights: distance 35% · size 25% · config 20% · recency 20%. Top-matched comps best support the ARV.
Projected returns pro-forma
-3.0% appreciation · 1.13% rent growth · sell at horizon
- IRR
- -11.3%
- Equity multiple
- 0.60×
- Total profit
- $-12,847
- Equity at exit
- $16,998
- IRR
- -4.7%
- Equity multiple
- 0.72×
- Total profit
- $-9,079
- Equity at exit
- $9,857
Cash invested: $31,920 (down + closing). Projections, not guarantees.
Landlord ↔ Tenant lean methodology
- Overall (STATE)
- 83 Strongly Landlord-Friendly
- State Oklahoma
- 83 Strongly Landlord-Friendly · R+20
- County
- — inherits STATE
- City
- — inherits STATE
ZIP-level market 73119
- Home prices YoY
- -14.4%
- Rents YoY
- 1.1%
- Active inventory
- 93
- Price-to-rent
- 9.3×
Monthly cashflow live
- Estimated rent
- $1,016 high interval (Pro) →
- Mortgage (P&I)
- −$598
- Tax from tax record
- −$39 /mo · $469/yr
- Insurance
- −$48
- HOA
- −$0
- Vacancy / Maint / Mgmt
- −$213
- Net cashflow
- $119
Break-even live
UW: 25.0% down · 7.5% · 30yr · 1.5% tax · 5.0% vac · 8.0% maint · 8.0% mgmt
Financing live
Cash to close
- Down payment
- $28,500
- Closing costs
- $3,420
- Reserves months
- —
- Total cash needed
- —
Loan-product check · same deal, 3 products live
Conventional
25% down · 7.5% · 30yr
- Down + closing
- —
- Monthly P&I
- —
- Monthly cashflow
- —
- DSCR
- —
- Eligible?
- —
Personal DTI + credit; lowest rate.
DSCR
20% down · 8.5% · 30yr
- Down + closing
- —
- Monthly P&I
- —
- Monthly cashflow
- —
- DSCR
- —
- Eligible?
- —
No personal income docs; deal must DSCR.
Hard money
10% down · 12.0% · 12mo
- Down + closing
- —
- Monthly P&I
- —
- Monthly cashflow
- —
- DSCR
- —
- Eligible?
- —
Short-term bridge; refi at stabilization.
Rent comps 15 comps
| Address | Beds | Baths | Sqft | Rent | $/sqft | DOM | Units | Dist |
|---|---|---|---|---|---|---|---|---|
| 3416 S Liberty Ave Oklahoma City, OK | 3.0 | 2.0 | 1400 | $1,195 | $0.85 | 2d | 1 | 0.28mi |
| 3100 Dumas Ln Apt 28 Oklahoma City, OK | 2.0 | 1.0 | 800 | $695 | $0.87 | 17d | 1 | 0.46mi |
| 2904 S Portland Ave Oklahoma City, OK | 3.0 | 1.0 | 1000 | $1,150 | $1.15 | 43d | 1 | 0.51mi |
| 3500 SW 29th Pl Oklahoma City, OK | 2.0 | 1.0 | 800 | $695 | $0.87 | 43d | 1 | 0.52mi |
| 3937 SW 27th Pl Oklahoma City, OK | 3.0 | 1.0 | 720 | $1,079 | $1.50 | 3d | 1 | 0.52mi |
| 3800 SW 42nd St Oklahoma City, OK | 2.0 | 1.0 | 790 | $895 | $1.13 | 43d | 1 | 0.55mi |
| 3801 SW 43rd St Oklahoma City, OK | 2.0 | 1.0 | 720 | $925 | $1.28 | 43d | 1 | 0.58mi |
| 3430 SW 29th Pl Unit 3430 Oklahoma City, OK | 3.0 | 1.0 | 760 | $850 | $1.12 | 43d | 1 | 0.59mi |
| 3705 SW 44th St Oklahoma City, OK | 3.0 | 2.0 | 1224 | $1,541 | $1.26 | 2d | 1 | 0.65mi |
| 3120 S Woodward Ave Oklahoma City, OK | 2.0 | 1.0 | 740 | $800 | $1.08 | 2d | 1 | 0.66mi |
| 3912 SW 25th St Oklahoma City, OK | 3.0 | 1.0 | 744 | $695 | $0.93 | 3d | 1 | 0.67mi |
| 3932 SW 23rd St Oklahoma City, OK | 3.0 | 1.0 | 744 | $825 | $1.11 | 17d | 1 | 0.80mi |
| 3128 SW 27th St Oklahoma City, OK | 2.0 | 1.0 | 740 | $880 | $1.19 | 2d | 1 | 0.98mi |
| 2921 SW 28th St Oklahoma City, OK | 3.0 | 1.0 | 1125 | $1,490 | $1.32 | 43d | 1 | 1.23mi |
| 3200 SW 20th St Oklahoma City, OK | 3.0 | 1.0 | 1032 | $1,000 | $0.97 | 20d | 1 | 1.28mi |
Listing history 3 events
-
2026-06-18days on market $114,000 Active 2 DOM
-
2026-06-16remarks 515-char remark
-
2026-06-16$114,000 Active 1 DOM
ⓘ Source: listings_history table (triggers on properties + properties_extension) + one-shot
backfill from property_details.listing_events for pre-trigger history.
Tax reassessment forecast OK · Resets to sale price
- Current annual tax
- $469 · $39/mo
- Projected year-2 tax
- $1,026 · $86/mo
- Expected delta
- +$557/yr (+$46/mo · 118.6%)
ⓘ Screening estimate from a state-policy table — verify with the county assessor before closing.
Climate risk First Street
- Flood 1/10 Low FEMA zone X (unshaded) · 0% chance over 30 yrs
- Wildfire 2/10 Low
- Heat 5/10 Major 7 d/yr ≥107°F today · 18 d/yr by 30 yrs out
- Wind 2/10 Low 4% chance of damaging wind over 30 yrs
- Air quality 1/10 Low 0 unhealthy d/yr today · 0 by 30 yrs out
Nearby sold comps map
Loading sold comps map…
Walkable amenities ~0.75 mi
Loading nearby amenities…
Taxation est. · year 1
- Rental income
- $12,198
- − Mortgage interest
- −$6,386
- − Property taxes
- −$469
- − Insurance
- −$570
- − Repairs & maintenance
- −$976
- − Management
- −$976
- − Depreciation
- −$3,316
- Taxable loss
- −$496
- Est. tax savings @ 24.0%
- +$119
- After-tax cash flow
- $1,542/yr
For passive investors: Depreciation is non-cash, so a rental often shows a tax loss while cash-flowing — sheltering income. Rental losses are passive: they offset passive income freely, and up to $25,000/yr can offset ordinary (W-2) income if you actively participate and your MAGI is under $100k (phasing out to $0 by $150k); unused losses carry forward. On sale, claimed depreciation is recaptured at up to 25%, and gains may owe capital-gains tax (a 1031 exchange can defer both). Figures are a year-1 estimate at your 24.0% rate — not tax advice; consult a CPA.
Schools (NCES district)
- District
- Oklahoma City
- NCES district ID
- 4022770
- Math proficiency
- 7% ▼ -5.00%
- Reading proficiency
- 10% ▼ -6.00%
- Median HH income
- $35,606
- Composite
- 7.0/100
- National rank
- #9970
- State rank
- #254 of 270 in OK
Livability — Oklahoma City
- Score
- 80/100
- State rank
- #3
- US rank
- #1635
Category grades
Schools grade is shown separately in the Schools card above.
Census & demographics
- Census place
- Oklahoma City, OK
- County
- Oklahoma County · 771,644 people
- City population
- 498,656
- Metro
- Oklahoma City, OK
- Population (ZIP)
- 30,398
- Household income
- $45,421
- Rent vs Own
- Severe rent burden
- 1221.0
Population outlook (Oklahoma County) Hauer SSP2
- Today (2025)
- 911,875 people
- By 2030
- 982,413 · +7.7%
- By 2040
- 1,130,468 · +24.0%
- By 2050
- 1,288,422 · +41.3%
- By 2075
- 1,711,482 · +87.7%
- By 2100
- 2,088,448 · +129.0%
Race, ethnicity, and origin ACS 2023
- Neighborhood character
- Majority Hispanic (63%)
- Race & ethnicity
- Hispanic / Latino 63% Two or more races 24% White 24% Native American 7% Black 6%
- Hispanic origin (detail)
- Mexican 58%
- Common ancestry
- Slovak 1% Lithuanian 1%
- Foreign-born
- 28% · Canada
- Languages at home
- 45% English-only · Spanish 54%
Political lean MEDSL · Oklahoma
- 2024 margin
- Toss-up / Even · D 48.0% · R 49.7% · Other 2.3%
- 2008→2024 swing
- +15.1pp toward D · 2008: -16.8pp · 2024: -1.7pp
- All cycles
- 2024: R+1.7 2020: R+1.1 2016: R+10.5 2012: R+16.7 2008: R+16.8
Not yet ingested
- Civics
- —
Market trends
- HPI YoY
- ▼ -50.15%
- Current HPI
- 297.1117
- Rent YoY
- ▲ 1.13%
- Metro
- Oklahoma City, OK
- State GDP YoY
- ▲ 1.55%
- F500 in state
- 6
Industry mix (Fortune 500 HQ in OK)
| Industry | F500 HQs | Revenue |
|---|---|---|
| Energy | 3 | $48B |
|
||
Price history
+3700.0% since first listed7 events — show timeline
- 2026-06-16 Listed $114,000 MLSOK
- 2026-03-19 Listing Removed — MLSOK
- 2026-02-12 Listed $119,800 MLSOK
- 2025-12-30 Listing Removed — MLSOK
- 2025-08-26 Price Changed $120,000 MLSOK
- 2025-08-04 Listed $135,000 MLSOK
- 1996-09-04 Sold (Public Records) $3,000 Public Records
Property tax history
+1.5%/yrLatest (2025): $469 · +4.4% YoY. Source: county tax records.
Cash-flow waterfall
monthlySold comps — $/sqft
last 12 mo · ≤1 miLoading sold comps…