 Fourplex
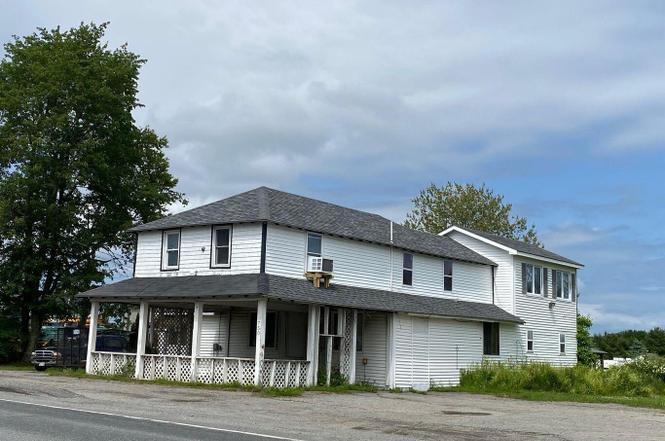
754 Bar Harbor Rd · Trenton, ME
Flood risk 1/10 · Minimal
- FEMA flood zone
- X (unshaded)
- Chance of flooding over 30 yrs
- 0.0%
- Est. flood insurance / yr
- $473 – $860
Fire risk 2/10 · Minimal
- Est. fire insurance / yr
- $669 – $1,243
Heat risk 4/10 · Minor
- Hot days now (above 87°F)
- 7 days/yr
- Hot days in 30 yrs
- 15 days/yr
Wind risk 6/10 · Moderate
- Chance of severe wind over 30 yrs
- 57.0%
Air-quality risk 1/10 · Minimal
- Unhealthy air days now
- 0 days/yr
- Unhealthy air days in 30 yrs
- 0 days/yr
Risk factors via First Street. Map © Google.
Why this score? — see what drove the C- grade
The composite is a weighted blend of 9 inputs, each scored 0–100. Each bar is that input's sub-score; the figure is the points it added to the 100-point composite (weight × sub-score).
- Cash flow +20.9/30.0
- ARV discount +7.5/15.0
- DSCR +6.7/10.0
- 1% rule +4.8/10.0
- Schools +4.3/10.0
- Rent growth +2.5/5.0
- Livability +2.5/5.0
- Condition / age +2.5/5.0
- Appreciation +0.0/10.0
$699,000
🖨 Deal sheet 📄 Offer letter ✓ Due diligence
Multi-family units
County records classify this as Multi-Family (2-4 Unit). Listing-text estimate: 4 units. confirmed
Listing remarks
This property, sometimes referred to as the ''Green Moth, '' presents an excellent opportunity for investors seeking reliable rental. This property has 2.19 acres. The property features a total of 11 rental units, which include four year-round apartments in the main building, six cabins, and one camper. The seasonal cabins are currently leased for six months at a time, making them particularly suitable for workforce housing needs. Situated conveniently close to Mount Desert Island (MDI) and Ellsworth. Advance notice is required for all showings. All existing leases will be honored by the future owner. Property taxes will be established at the time of sale.
Key facts
- One camper
- Six cabins
- 2.19 acres
Tags
Property features AI
Finance
- Financial info: Property configured as an 11-unit multi-family (10 one-bedroom units, 1 two-bedroom unit); Gross income reported: $68,335; Operating expenses reported: $44,960; Actual rents vary by unit (examples): $700–$850 depending on unit
- HOA & community: No cats or dogs allowed
Exterior
- Parking: On-site common parking with 11–20 gravel spaces
- Utilities: Private well water; Septic system (private sewer) with septic design available; Electric water heaters (tank)
- Home design: Multi-level building
- Construction: Built in 1900; Wood siding and vinyl siding with wood frame construction; Fiberglass shingle roof; Stone and concrete perimeter foundation
- Exterior features: Porch; Outbuilding; Pasture/field and open level lot; Near golf course, near town, rural setting; Private road frontage with gravel surface
Interior
- Kitchen: Some units include refrigerators (varies by unit)
- Bedrooms: Total building includes one 2-bedroom unit and ten 1-bedroom units (units listed are primarily first-floor)
- Flooring: Wood flooring; Vinyl flooring
- Bathrooms: 11 full bathrooms total
- Heating & cooling: Heating present; Radiator heating; Direct vent heaters; Circuit breaker electrical system
- Interior features: First-floor bedroom(s); Shower(s); Partially furnished; Double-pane windows; Internet access available
- Laundry & utility: Dedicated water heaters for each unit; Mixed electric metering (some units have dedicated electric meters, others do not)
Neighborhood map
What this means for you Summary
Snapshot
- This is a 4 × 3-bed/2.8-bath units multifamily listed at $699k.
Deal economics
- At list price, monthly cash flow is $974 ($12k/yr) — positive. Per door: $243/mo.
- The deal already cash-flows at list — no discount required.
- To meet the 1% rule (rent ≥ 1% of price), the offer needs to be $685k (2.0% below list).
- Recommended offer: $615k (12.0% below list) — sets the bar for market timing.
Location & tenants
- Location reads: area grade C — affects rentability + tenant quality, not the cash-flow math above.
- Trenton Public Schools (rural): math 35% / reading 60% proficiency, ranked #66 of 185 in ME (top 36%) — families likely to look elsewhere, expect single-tenant / working-renter base with shorter leases.
- Market conditions: 152 active listings in the ZIP; 270 units permitted in Hancock County in 2024 (0 in 5+ unit buildings).
Forward outlook
- Local home prices are declining (-3.0%/yr); year-one equity from $5k of loan paydown is wiped out by about $21k of value loss. Plan a longer hold.
- Hancock County population projected at -14% by 2050 — secular population decline; favor cash flow + early exit over multi-decade hold.
Negotiation context
- It's been on market 219 days — a 12% lower offer ($615k) is reasonable based on typical stale-listing flexibility.
Risks & watch-outs
- Watch-outs: built in 1900 — expect roof / HVAC / electrical / plumbing capex.
- Climate carrying-cost: major wind risk, 57% chance of damaging wind over 30y — expect insurance premiums to compound above CPI over the hold.
Questions for the listing agent
- It's been on market 219 days. Have you received any prior offers? Is the seller open to a 12% concession, seller financing, or rate buy-down credit?
- Can we see the unit-by-unit rent roll, current vacancy, and any below-market leases? What's the average tenancy length?
- What capital expenditures (roof, boiler, parking lot, exteriors) have been made in the last 5 years, and what's planned in the next 2?
- Built in 1900 — when were the roof, HVAC, electrical panel, plumbing, and water heater last replaced?
- Why hasn't it sold? Are there any deal-killer items the seller is aware of (foundation, flood, title, zoning, code violations)?
- Is there a deadline driving the sale (1031 exchange, divorce, estate, relocation)? That informs how much negotiation room exists.
- What's the average days-on-market for RENTAL listings here right now (not sales)? A rising rental-DOM trend means longer vacancies and softer asking-rent achievability than the comps imply.
- What's the recent tenant-quality profile in this submarket — average credit score on applications, eviction rate, late-payment / NSF rate, and stable-employment percentage? A property-management company in the area should have these aggregated.
- How much new apartment / multifamily construction is in the pipeline within 1–3 miles? Heavy new supply (>2% of stock underway) typically softens rents 12–24 months out; light construction supports rent growth.
Investment metrics
- 1% rule
- 0.98% ✗
- Cap rate
- 7.96%
- Cash-on-cash
- 5.97%
- DSCR
- 1.27
- GRM
- 8.5
CMA / ARV
No comps found within radius.
Projected returns pro-forma
-3.0% appreciation · 3.0% rent growth · sell at horizon
- IRR
- -7.1%
- Equity multiple
- 0.74×
- Total profit
- $-51,399
- Equity at exit
- $104,223
- IRR
- 2.5%
- Equity multiple
- 1.18×
- Total profit
- $34,525
- Equity at exit
- $60,437
Cash invested: $195,720 (down + closing). Projections, not guarantees.
Landlord ↔ Tenant lean methodology
- Overall (STATE)
- 41 Moderately Tenant-Leaning
- State Maine
- 41 Moderately Tenant-Leaning · D+2
- County
- — inherits STATE
- City
- — inherits STATE
ZIP-level market 04605
- Home prices YoY
- -27.0%
- Active inventory
- 152
- Price-to-rent
- 34.0×
Monthly cashflow live
- Estimated rent
- $6,849 medium interval (Pro) →
- Mortgage (P&I)
- −$3,666
- Tax from tax record
- −$480 /mo · $5,763/yr
- Insurance
- −$291
- HOA
- −$0
- Vacancy / Maint / Mgmt
- −$1,438
- Net cashflow
- $974
Break-even live
4-unit breakdown (identical units grouped — click to expand)
| Units | Beds | Baths | Est. rent |
|---|---|---|---|
| 4× units | 3 | 2.8 | $6,848 |
| #1 | 3 | 2.8 | $1,712 |
| #2 | 3 | 2.8 | $1,712 |
| #3 | 3 | 2.8 | $1,712 |
| #4 | 3 | 2.8 | $1,712 |
| Total (4 units) | $6,849 | ||
UW: 25.0% down · 7.5% · 30yr · 1.5% tax · 5.0% vac · 8.0% maint · 8.0% mgmt
Financing live
Cash to close
- Down payment
- $174,750
- Closing costs
- $20,970
- Reserves months
- —
- Total cash needed
- —
Loan-product check · same deal, 3 products live
Conventional
25% down · 7.5% · 30yr
- Down + closing
- —
- Monthly P&I
- —
- Monthly cashflow
- —
- DSCR
- —
- Eligible?
- —
Personal DTI + credit; lowest rate.
DSCR
20% down · 8.5% · 30yr
- Down + closing
- —
- Monthly P&I
- —
- Monthly cashflow
- —
- DSCR
- —
- Eligible?
- —
No personal income docs; deal must DSCR.
Hard money
10% down · 12.0% · 12mo
- Down + closing
- —
- Monthly P&I
- —
- Monthly cashflow
- —
- DSCR
- —
- Eligible?
- —
Short-term bridge; refi at stabilization.
Listing history 16 events
-
2026-06-18days on market $699,000 Active 219 DOM
-
2026-06-17days on market $699,000 Active 218 DOM
-
2026-06-16days on market $699,000 Active 217 DOM
-
2026-06-15days on market $699,000 Active 216 DOM
-
2026-06-13days on market $699,000 Active 214 DOM
-
2026-06-12days on market $699,000 Active 213 DOM
-
2026-06-09days on market $699,000 Active 210 DOM
-
2026-06-08days on market $699,000 Active 209 DOM
-
2026-06-07days on market $699,000 Active 208 DOM
-
2026-06-07days on market $699,000 Active 207 DOM
-
2026-06-04days on market $699,000 Active 204 DOM
-
2026-06-02days on market $699,000 Active 203 DOM
-
2026-06-01days on market $699,000 Active 202 DOM
-
2026-05-31days on market $699,000 Active 201 DOM
-
2026-05-31days on market $699,000 Active 200 DOM
-
2025-11-11$699,000 Active
ⓘ Source: listings_history table (triggers on properties + properties_extension) + one-shot
backfill from property_details.listing_events for pre-trigger history.
Tax reassessment forecast ME · Partial reset (capped growth)
- Current annual tax
- $5,763 · $480/mo
- Projected year-2 tax
- $7,635 · $636/mo
- Expected delta
- +$1,872/yr (+$156/mo · 32.5%)
ⓘ Screening estimate from a state-policy table — verify with the county assessor before closing.
Climate risk First Street
- Flood 1/10 Low FEMA zone X (unshaded) · 0% chance over 30 yrs
- Wildfire 2/10 Low
- Heat 4/10 Moderate 7 d/yr ≥87°F today · 15 d/yr by 30 yrs out
- Wind 6/10 Major 57% chance of damaging wind over 30 yrs
- Air quality 1/10 Low 0 unhealthy d/yr today · 0 by 30 yrs out
Nearby sold comps map
Loading sold comps map…
Walkable amenities ~0.75 mi
Loading nearby amenities…
Taxation est. · year 1
- Rental income
- $82,188
- − Mortgage interest
- −$39,155
- − Property taxes
- −$5,763
- − Insurance
- −$3,495
- − Repairs & maintenance
- −$6,575
- − Management
- −$6,575
- − Depreciation
- −$20,335
- Taxable income
- $291
- Est. tax owed @ 24.0%
- −$70
- After-tax cash flow
- $11,613/yr
For passive investors: Depreciation is non-cash, so a rental often shows a tax loss while cash-flowing — sheltering income. Rental losses are passive: they offset passive income freely, and up to $25,000/yr can offset ordinary (W-2) income if you actively participate and your MAGI is under $100k (phasing out to $0 by $150k); unused losses carry forward. On sale, claimed depreciation is recaptured at up to 25%, and gains may owe capital-gains tax (a 1031 exchange can defer both). Figures are a year-1 estimate at your 24.0% rate — not tax advice; consult a CPA.
Schools (NCES district)
- District
- Trenton Public Schools
- NCES district ID
- 2312980
- Math proficiency
- 35% ▼ -5.00%
- Reading proficiency
- 60% ▲ 5.00%
- Median HH income
- $51,204
- Composite
- 42.9/100
- National rank
- #6710
- State rank
- #66 of 185 in ME
Livability — Trenton
No livability data for this city. (Only ~50 U.S. cities are tracked.)
Census & demographics
- Population (ZIP)
- 14,695
Population outlook (Hancock County) Hauer SSP2
- Today (2025)
- 53,608 people
- By 2030
- 52,594 · -1.9%
- By 2040
- 49,556 · -7.6%
- By 2050
- 46,152 · -13.9%
- By 2075
- 39,678 · -26.0%
- By 2100
- 33,690 · -37.2%
Race, ethnicity, and origin ACS 2023
- Neighborhood character
- Predominantly White (91%)
- Race & ethnicity
- White 91% Two or more races 4% Hispanic / Latino 2% Asian 1% Black 1%
- Common ancestry
- Lithuanian 9% Slovak 5% Romanian 3%
- Foreign-born
- 3% · Canada, South Korea
- Languages at home
- 97% English-only · German/W. Germanic 1% Other Indo-European 1%
Political lean MEDSL · Hancock
- 2024 margin
- D (+11.8) · D 54.7% · R 42.9% · Other 2.4%
- 2008→2024 swing
- -7.5pp toward R · 2008: 19.3pp · 2024: 11.8pp
- All cycles
- 2024: D+11.8 2020: D+12.4 2016: D+7.6 2012: D+16.7 2008: D+19.3
Not yet ingested
- Civics
- —
Market trends
- HPI YoY
- ▼ -69.32%
- Current HPI
- 187.7717
- Rent YoY
- —
- Metro
- —
- State GDP YoY
- —
- F500 in state
- 0
Price history
1 event — show timeline
- 2025-11-11 Listed $699,000 MREIS
Property tax history
+3.8%/yrLatest (2025): $5,763 · +3.8% YoY. Source: county tax records.
Cash-flow waterfall
monthlySold comps — $/sqft
last 12 mo · ≤1 miLoading sold comps…