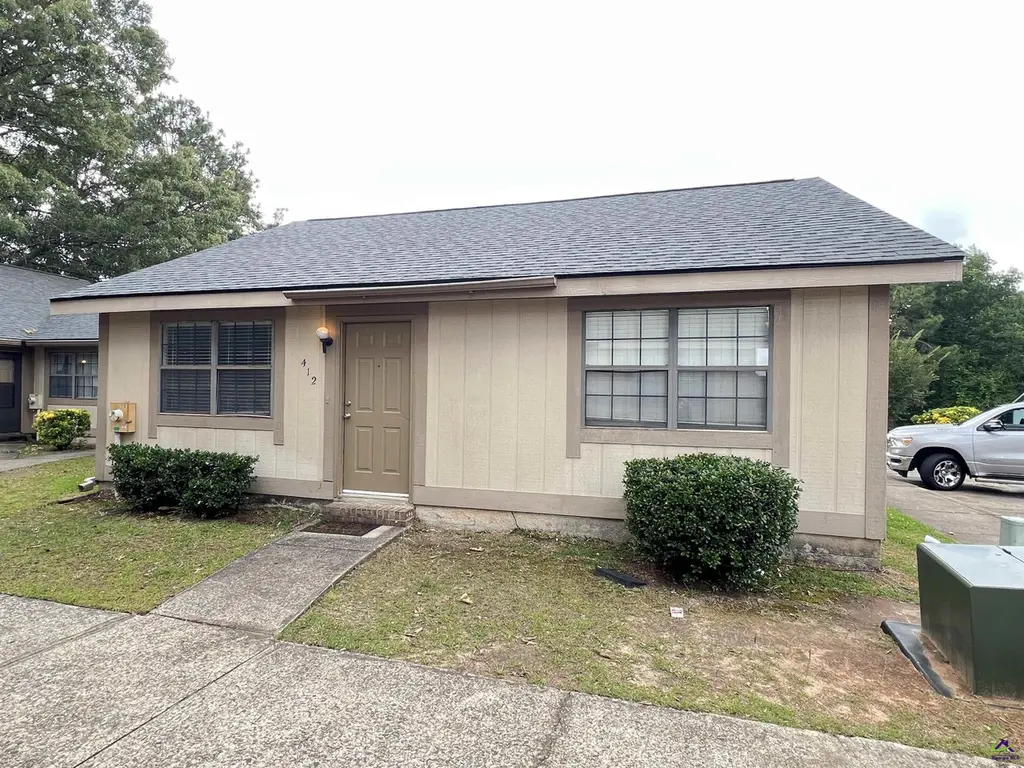
412 Tallulah Trail Trl · Warner Robins, GA
Flood risk 1/10 · Minimal
- FEMA flood zone
- X (unshaded)
- Chance of flooding over 30 yrs
- 0.0%
- Est. flood insurance / yr
- $507 – $1,088
Fire risk 2/10 · Minimal
- Est. fire insurance / yr
- $963 – $1,789
Heat risk 7/10 · Major
- Hot days now (above 108°F)
- 7 days/yr
- Hot days in 30 yrs
- 18 days/yr
Wind risk 6/10 · Moderate
- Chance of severe wind over 30 yrs
- 76.0%
Air-quality risk 3/10 · Minor
- Unhealthy air days now
- 2 days/yr
- Unhealthy air days in 30 yrs
- 4 days/yr
Risk factors via First Street. Map © Google.
Why this score? — see what drove the C- grade
The composite is a weighted blend of 9 inputs, each scored 0–100. Each bar is that input's sub-score; the figure is the points it added to the 100-point composite (weight × sub-score).
- Cash flow +19.2/30.0
- ARV discount +7.5/15.0
- 1% rule +6.6/10.0
- DSCR +6.1/10.0
- Schools +3.9/10.0
- Livability +3.2/5.0
- Rent growth +2.9/5.0
- Condition / age +2.5/5.0
- Appreciation +0.0/10.0
$105,000
🖨 Deal sheet 📄 Offer letter ✓ Due diligence
Listing remarks
BETTER LOOK AT ME!. .. I won't last long. Cute Home conveniently located to Robins AFB, schools and shopping; covered patio; great room with volume ceiling; nice kitchen with dishwasher, range, refrigerator and eating area; nice size master bedroom; plus extra bedroom and hall bath; condo fee covers all exterior maintenance, monthly pest control, insurance, yard maintenance, pool and clubhouse. .. CALL TODAY!
Key facts
- Volume ceiling
- Covered patio
- Kitchen with range
Tags
Property features AI
Finance
- Other: Subdivision: Harbour Towne
- HOA & community: Homeowners association with a $200 monthly fee
Exterior
- Parking: No garage
- Utilities: Public water; Public sewer; Cable connected; Underground utilities
- Home design: Residential condominium; One level; Slab foundation
- Exterior features: Covered patio/porch; Community pool; Community clubhouse
Interior
- Kitchen: Electric range; Dishwasher; Disposal; Refrigerator
- Flooring: Carpet; Vinyl
- Bathrooms: 1 full bathroom
- Heating & cooling: Central heating; Heat pump; Central air
- Interior features: Ceiling fan(s); High-speed internet; Storage; Double pane windows; Blinds
- Laundry & utility: Dedicated laundry room
Neighborhood map
What this means for you Summary
Snapshot
- This is a 2-bed/1.0-bath condo listed at $105k.
Deal economics
- At list price, monthly cash flow is $114 ($1k/yr) — positive.
- The deal already cash-flows at list — no discount required.
- Meets the 1% rule at list price ($1k rent vs $105k).
- Recommended offer: $103k (1.5% below list) — sets the bar for market timing.
- Cap rate 7.6% vs local median 4.9% in Warner Robins — top-decile yield for the area; either an underpriced asset or a hidden risk that comps aren't pricing in. Stress-test before assuming the spread holds.
Location & tenants
- Location reads 65/100 on livability (#227 in GA) — a middle-class / working-renter tenant base. Strengths: cost of living A+, housing A+, health & safety A+; Watch: employment D+, crime F, amenities F.
- Houston County (urban): math 43% / reading 46% proficiency, ranked #23 of 174 in GA (top 13%) — families likely to look elsewhere, expect single-tenant / working-renter base with shorter leases.
- Zoned schools: Russell Elementary School (math 51% / reading 41%, grade D-, #316 of 1,228 statewide, top 26%, 645 students, 84% FRL); Warner Robins Middle School (math 25% / reading 37%, grade F, #237 of 470 statewide, top 51%, 813 students, 84% FRL); Warner Robins High School (math 7% / reading 21%, grade F, #322 of 424 statewide, top 76%, 1,816 students, 84% FRL) — zoned schools average 84% FRL vs 46% district-wide (38 pts higher); higher-poverty schools than district average — tighter screening recommended.
- Zoned-school proficiency averages 30% at this address vs 44% district-wide (-14 pts) — the specific schools serving this property underperform the Houston County average; the district grade overstates school quality for this exact location.
- Market conditions: Rents rising (+1.7%/yr); 286 active listings in the ZIP; 14 comparable units currently listed for rent nearby; rentals at typical pace (median 21d on market — plan ~3-4 weeks tenant-placement turnaround); solid renter incomes; 1,545 units permitted in Houston County in 2024 (336 in 5+ unit buildings).
- This rent is only 18% of the median local income ($83k/yr) — well below the 30% rent-burden line; pricing power to push rent on renewal without tenant pushback.
Forward outlook
- Local home prices are declining (-3.0%/yr); year-one equity from $726 of loan paydown is wiped out by about $3k of value loss. Plan a longer hold.
- Houston County population projected at +22% by 2050 — long-run rental-demand tailwind backs the buy-and-hold thesis.
Negotiation context
- It's been on market 24 days — a 2% lower offer ($103k) is reasonable based on typical stale-listing flexibility.
- Current owner paid $38k; list at $105k implies a 180% gain — meaningful room to come down on a strong offer.
Risks & watch-outs
- Climate carrying-cost: major wind risk, 76% chance of damaging wind over 30y; extreme-heat days projected 7→18/yr by 2055 (HVAC capex compounding) — expect insurance premiums to compound above CPI over the hold.
Questions for the listing agent
- What does the HOA fee cover, when was the last increase, and are there any pending special assessments or reserve-fund shortfalls?
- Any open or pending special assessments — roof, HVAC, plumbing, elevator, façade? What's the per-unit balance and payoff schedule, and is the seller paying it off at close or rolling it to the buyer?
- Is there a deadline driving the sale (1031 exchange, divorce, estate, relocation)? That informs how much negotiation room exists.
- Schools are D-rated, which usually means shorter tenancies and higher turnover. Who's the typical renter profile here, and what's been the actual vacancy rate?
- Crime grade is F in this area — have there been break-ins, vandalism, or insurance claims at this property in the last 3 years? What carrier currently insures it and at what premium?
- What's the average days-on-market for RENTAL listings here right now (not sales)? A rising rental-DOM trend means longer vacancies and softer asking-rent achievability than the comps imply.
- What's the recent tenant-quality profile in this submarket — average credit score on applications, eviction rate, late-payment / NSF rate, and stable-employment percentage? A property-management company in the area should have these aggregated.
- How much new apartment / multifamily construction is in the pipeline within 1–3 miles? Heavy new supply (>2% of stock underway) typically softens rents 12–24 months out; light construction supports rent growth.
Investment metrics
- 1% rule
- 1.16% ✓
- Cap rate
- 7.60%
- Cash-on-cash
- 4.66%
- DSCR
- 1.21
- GRM
- 7.2
CMA / ARV
No comps found within radius.
Projected returns pro-forma
-3.0% appreciation · 1.67% rent growth · sell at horizon
- IRR
- -10.7%
- Equity multiple
- 0.62×
- Total profit
- $-11,259
- Equity at exit
- $15,656
- IRR
- -3.5%
- Equity multiple
- 0.78×
- Total profit
- $-6,498
- Equity at exit
- $9,078
Cash invested: $29,400 (down + closing). Projections, not guarantees.
Landlord ↔ Tenant lean methodology
- Overall (STATE)
- 90 Strongly Landlord-Friendly
- State Georgia
- 90 Strongly Landlord-Friendly · R+3
- County
- — inherits STATE
- City
- — inherits STATE
ZIP-level market 31088
- Rents YoY
- 1.7%
- Active inventory
- 286
- Price-to-rent
- 7.2×
Monthly cashflow live
- Estimated rent
- $1,222 high interval (Pro) →
- Mortgage (P&I)
- −$551
- Tax from tax record
- −$57 /mo · $684/yr
- Insurance
- −$44
- HOA
- −$200
- Vacancy / Maint / Mgmt
- −$257
- Net cashflow
- $114
Break-even live
UW: 25.0% down · 7.5% · 30yr · 1.5% tax · 5.0% vac · 8.0% maint · 8.0% mgmt
Financing live
Cash to close
- Down payment
- $26,250
- Closing costs
- $3,150
- Reserves months
- —
- Total cash needed
- —
Loan-product check · same deal, 3 products live
Conventional
25% down · 7.5% · 30yr
- Down + closing
- —
- Monthly P&I
- —
- Monthly cashflow
- —
- DSCR
- —
- Eligible?
- —
Personal DTI + credit; lowest rate.
DSCR
20% down · 8.5% · 30yr
- Down + closing
- —
- Monthly P&I
- —
- Monthly cashflow
- —
- DSCR
- —
- Eligible?
- —
No personal income docs; deal must DSCR.
Hard money
10% down · 12.0% · 12mo
- Down + closing
- —
- Monthly P&I
- —
- Monthly cashflow
- —
- DSCR
- —
- Eligible?
- —
Short-term bridge; refi at stabilization.
Rent comps 14 comps
| Address | Beds | Baths | Sqft | Rent | $/sqft | DOM | Units | Dist |
|---|---|---|---|---|---|---|---|---|
| 218 Tallulah Trl Warner Robins, GA | 2.0 | 2.0 | 1050 | $1,200 | $1.14 | 43d | 1 | 0.16mi |
| 501 Leisure Lake Dr Warner Robins, GA | 1.0 | 1.0 | 750 | $1,045 | $1.39 | 13d | 1 | 0.29mi |
| 210 Southland Station Dr Warner Robins, GA | 1.0–3.0 | 1.0–2.0 | 1135 | $1,208 | $1.06 | 13d | 15 | 0.36mi |
| 800 Leisure Lake Dr Warner Robins, GA | 1.0–2.0 | 1.0–2.0 | 950 | $1,365 | $1.44 | 13d | 34 | 0.49mi |
| 251 Randy Cir Warner Robins, GA | 3.0 | 2.0 | 1025 | $1,275 | $1.24 | 21d | 1 | 0.93mi |
| 114 Forrester Dr Warner Robins, GA | 3.0 | 1.0 | 810 | $1,100 | $1.36 | 21d | 1 | 1.02mi |
| 134 Garland Ter Warner Robins, GA | 1.0 | 1.0 | 614 | $850 | $1.38 | 13d | 1 | 1.07mi |
| 642 Maplewood Dr Bonaire, GA | 3.0 | 2.0 | 1100 | $1,400 | $1.27 | 43d | 1 | 1.30mi |
| 615 Cedarwood Dr Unit 611 Bonaire, GA | 3.0 | 1.0 | 902 | $1,095 | $1.21 | 21d | 1 | 1.33mi |
| 615 Cedarwood Dr Unit 504 Bonaire, GA | 2.0 | 1.0 | 704 | $950 | $1.35 | 43d | 1 | 1.33mi |
| 114 Forrester Dr Warner Robins, GA | 3.0 | 1.0 | 810 | $1,100 | $1.36 | 43d | 1 | 1.36mi |
| 627 Maplewood Dr Bonaire, GA | 3.0 | 2.0 | 1080 | $975 | $0.90 | 21d | 1 | 1.37mi |
| 614 Cedarwood Dr Bonaire, GA | 3.0 | 1.0 | 902 | $925 | $1.03 | 21d | 1 | 1.38mi |
| 1311 Alma Ave Warner Robins, GA | 3.0 | 1.0 | 1073 | $1,150 | $1.07 | 43d | 1 | 1.42mi |
HOA detail condo
- Monthly dues
- $200 · $2,400/yr
- Likely covers
- exterior maint.pool
- Assessments
- None detected in remarks — confirm with the listing agent.
Listing history 19 events
-
2026-06-19days on market $105,000 Active 24 DOM
-
2026-06-18days on market $105,000 Active 23 DOM
-
2026-06-17days on market $105,000 Active 22 DOM
-
2026-06-16days on market $105,000 Active 21 DOM
-
2026-06-15days on market $105,000 Active 20 DOM
-
2026-06-14days on market $105,000 Active 18 DOM
-
2026-06-13days on market $105,000 Active 17 DOM
-
2026-06-10days on market $105,000 Active 15 DOM
-
2026-06-09days on market $105,000 Active 14 DOM
-
2026-06-08days on market $105,000 Active 13 DOM
-
2026-06-07days on market $105,000 Active 12 DOM
-
2026-06-05days on market $105,000 Active 9 DOM
-
2026-06-03days on market $105,000 Active 8 DOM
-
2026-06-02days on market $105,000 Active 7 DOM
-
2026-06-01days on market $105,000 Active 6 DOM
-
2026-05-31days on market $105,000 Active 5 DOM
-
2026-05-30days on market $105,000 Active 4 DOM
-
2026-05-26$105,000 Active
-
2001-11-16soldstatus $37,500
ⓘ Source: listings_history table (triggers on properties + properties_extension) + one-shot
backfill from property_details.listing_events for pre-trigger history.
Tax reassessment forecast GA · Resets to sale price
- Current annual tax
- $684 · $57/mo
- Projected year-2 tax
- $966 · $80/mo
- Expected delta
- +$282/yr (+$23/mo · 41.2%)
ⓘ Screening estimate from a state-policy table — verify with the county assessor before closing.
Climate risk First Street
- Flood 1/10 Low FEMA zone X (unshaded) · 0% chance over 30 yrs
- Wildfire 2/10 Low
- Heat 7/10 Severe 7 d/yr ≥108°F today · 18 d/yr by 30 yrs out
- Wind 6/10 Major 76% chance of damaging wind over 30 yrs
- Air quality 3/10 Moderate 2 unhealthy d/yr today · 4 by 30 yrs out
Nearby sold comps map
Loading sold comps map…
Walkable amenities ~0.75 mi
Loading nearby amenities…
Taxation est. · year 1
- Rental income
- $14,667
- − Mortgage interest
- −$5,882
- − Property taxes
- −$684
- − Insurance
- −$525
- − Repairs & maintenance
- −$1,173
- − Management
- −$1,173
- − HOA
- −$2,400
- − Depreciation
- −$3,055
- Taxable loss
- −$225
- Est. tax savings @ 24.0%
- +$54
- After-tax cash flow
- $1,424/yr
For passive investors: Depreciation is non-cash, so a rental often shows a tax loss while cash-flowing — sheltering income. Rental losses are passive: they offset passive income freely, and up to $25,000/yr can offset ordinary (W-2) income if you actively participate and your MAGI is under $100k (phasing out to $0 by $150k); unused losses carry forward. On sale, claimed depreciation is recaptured at up to 25%, and gains may owe capital-gains tax (a 1031 exchange can defer both). Figures are a year-1 estimate at your 24.0% rate — not tax advice; consult a CPA.
Schools (NCES district)
- District
- Houston County
- NCES district ID
- 1302880
- Math proficiency
- 43% ▼ -7.00%
- Reading proficiency
- 46% ▼ -2.00%
- Median HH income
- $54,823
- Composite
- 38.68/100
- National rank
- #4144
- State rank
- #23 of 174 in GA
Livability — Warner Robins
- Score
- 65/100
- State rank
- #227
- US rank
- #13290
Category grades
Schools grade is shown separately in the Schools card above.
Census & demographics
- Census place
- Warner Robins, GA
- County
- Houston County · 157,321 people
- City population
- 92,102
- Metro
- Warner Robins, GA
- Population (ZIP)
- 58,585
- Household income
- $83,082
- Rent vs Own
- Severe rent burden
- 1668.0
Population outlook (Houston County) Hauer SSP2
- Today (2025)
- 169,502 people
- By 2030
- 178,486 · +5.3%
- By 2040
- 194,642 · +14.8%
- By 2050
- 207,119 · +22.2%
- By 2075
- 231,480 · +36.6%
- By 2100
- 235,034 · +38.7%
Race, ethnicity, and origin ACS 2023
- Neighborhood character
- Diverse neighborhood (Simpson 0.63)
- Race & ethnicity
- White 51% Black 32% Two or more races 9% Hispanic / Latino 7% Asian 4%
- Hispanic origin (detail)
- Mexican 4%
- Common ancestry
- Romanian 2% Slovak 2% Lithuanian 2%
- Foreign-born
- 9% · Canada, Vietnam, Jamaica
- Languages at home
- 90% English-only · Spanish 5% Other Asian/Pacific 2% Vietnamese 2%
Political lean MEDSL · Houston
- 2024 margin
- R (+11.3) · D 44.0% · R 55.3%
- 2008→2024 swing
- +8.9pp toward D · 2008: -20.2pp · 2024: -11.3pp
- All cycles
- 2024: R+11.3 2020: R+12.4 2016: R+21.6 2012: R+20.7 2008: R+20.2
Not yet ingested
- Civics
- —
Market trends
- HPI YoY
- ▼ -135.75%
- Current HPI
- 219.8261
- Rent YoY
- ▲ 1.67%
- Metro
- Warner Robins, GA
- State GDP YoY
- ▲ 2.66%
- F500 in state
- 28
Industry mix (Fortune 500 HQ in GA)
| Industry | F500 HQs | Revenue |
|---|---|---|
| Paper / Packaging | 2 | $29B |
|
||
| Retail | 1 | $160B |
|
||
| Transportation / Logistics | 1 | $91B |
|
||
| Airlines | 1 | $62B |
|
||
| Consumer Goods | 1 | $47B |
|
||
| Utilities | 1 | $25B |
|
||
Price history
+180.0% since first listed2 events — show timeline
- 2026-05-26 Listed $105,000 CGMLS
- 2001-11-16 Sold (Public Records) $37,500 Public Records
Property tax history
+6.6%/yrLatest (2025): $684 · +8.4% YoY. Source: county tax records.
Cash-flow waterfall
monthlySold comps — $/sqft
last 12 mo · ≤1 miLoading sold comps…