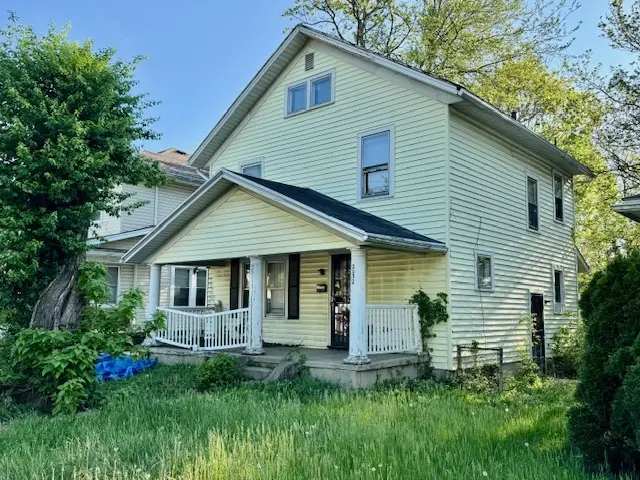
2032 Rugby Rd · Dayton, OH
Flood risk 1/10 · Minimal
- FEMA flood zone
- X (unshaded)
- Chance of flooding over 30 yrs
- 0.0%
- Est. flood insurance / yr
- $473 – $860
Fire risk 1/10 · Minimal
- Est. fire insurance / yr
- $713 – $1,323
Heat risk 3/10 · Minor
- Hot days now (above 104°F)
- 7 days/yr
- Hot days in 30 yrs
- 18 days/yr
Wind risk 2/10 · Minimal
- Chance of severe wind over 30 yrs
- —
Air-quality risk 3/10 · Minor
- Unhealthy air days now
- 2 days/yr
- Unhealthy air days in 30 yrs
- 4 days/yr
Risk factors via First Street. Map © Google.
Why this score? — see what drove the B+ grade
The composite is a weighted blend of 9 inputs, each scored 0–100. Each bar is that input's sub-score; the figure is the points it added to the 100-point composite (weight × sub-score).
- Cash flow +30.0/30.0
- ARV discount +15.0/15.0
- 1% rule +10.0/10.0
- DSCR +10.0/10.0
- Rent growth +3.3/5.0
- Livability +3.2/5.0
- Condition / age +2.5/5.0
- Schools +1.3/10.0
- Appreciation +0.0/10.0
$44,990
🖨 Deal sheet 📄 Offer letter ✓ Due diligence
Listing remarks MLS
AS IS. All room sizes are approximate. Rely on your own inspections. GREAT INVESTMENT OPPORTUNITY!
Key facts
- Covered front porch
- Natural woodwork
- Ornate staircase
Tags
Property features AI
Finance
- Financial info: Offered for sale
Exterior
- Parking: Detached two-car garage
- Utilities: Natural gas available; Public water; Sewer available (storm sewer)
- Home design: Two-story frame home with vinyl siding
- Construction: Frame construction; Vinyl siding
- Exterior features: Porch; Lot approximately 40 x 140 (about 0.1286 acres); Residential zoning
Interior
- Kitchen: Kitchen on main level (approx. 10x9)
- Bedrooms: Three second-floor bedrooms (approx. 12x11, 13x12, 13x10)
- Bathrooms: One full bathroom
- Heating & cooling: Forced air heating; Natural gas heating
- Interior features: Full unfinished basement; Breakfast nook; Porch (listed under exterior features but accessible from interior spaces)
- Laundry & utility: Main laundry room in basement (approx. 10x10); Gas water heater
Neighborhood map
What this means for you Summary
Snapshot
- This is a 3-bed/1.0-bath single-family listed at $45k.
Deal economics
- At list price, monthly cash flow is $567 ($7k/yr) — positive.
- The deal already cash-flows at list — no discount required.
- Meets the 1% rule at list price ($1k rent vs $45k).
- Recommended offer: $44k (3.0% below list) — sets the bar for market timing.
- Cap rate 21.4% vs local median 7.4% in Dayton — top-decile yield for the area; either an underpriced asset or a hidden risk that comps aren't pricing in. Stress-test before assuming the spread holds.
Location & tenants
- Location reads 65/100 on livability (#716 in OH) — a middle-class / working-renter tenant base. Strengths: cost of living A+, housing A+, health & safety A; Watch: schools C-, amenities C-, crime F.
- Dayton City (urban): math 12% / reading 21% proficiency, ranked #641 of 656 in OH (top 98%) — low school quality limits family demand, transient renter base, plan for 1-2y turnover; 74% free/reduced lunch — lower-income household profile, screen leases tightly.
- Market conditions: Rents rising (+3.0%/yr); 156 active listings in the ZIP; 40 comparable units currently listed for rent nearby; rentals lingering (median 44d on market — plan ~5-8 weeks vacancy on turnover, expect pricing pressure); 55% of comp listings sitting > 30 days — soft ceiling on asking rent; lower-income renter base — watch delinquency; 907 units permitted in Montgomery County in 2024 (416 in 5+ unit buildings).
- This rent runs 33% of the median local income ($42k/yr) — at the standard rent-burdened threshold; future hikes will face affordability resistance.
Forward outlook
- Local home prices are declining (-3.0%/yr); year-one equity from $312 of loan paydown is wiped out by about $1k of value loss. Plan a longer hold.
- Montgomery County population projected at -10% by 2050 — secular population decline; favor cash flow + early exit over multi-decade hold.
- At projected returns (-3.0% appreciation + 3.0% rent growth), your $13k cash investment doubles in ~3 years — after that, you're playing with house money.
Negotiation context
- It's been on market 35 days — a 3% lower offer ($44k) is reasonable based on typical stale-listing flexibility.
- 3 sale attempts since 13y ago with the ask held roughly flat each time — persistent listings suggest the price (not the market) is what's stuck; bring a comps-based counter.
Risks & watch-outs
- Watch-outs: built in 1925 — expect roof / HVAC / electrical / plumbing capex.
Questions for the listing agent
- It's been on market 35 days. Have you received any prior offers? Is the seller open to a 3% concession, seller financing, or rate buy-down credit?
- Built in 1925 — when were the roof, HVAC, electrical panel, plumbing, and water heater last replaced?
- Is there a deadline driving the sale (1031 exchange, divorce, estate, relocation)? That informs how much negotiation room exists.
- Crime grade is F in this area — have there been break-ins, vandalism, or insurance claims at this property in the last 3 years? What carrier currently insures it and at what premium?
- What's the average days-on-market for RENTAL listings here right now (not sales)? A rising rental-DOM trend means longer vacancies and softer asking-rent achievability than the comps imply.
- What's the recent tenant-quality profile in this submarket — average credit score on applications, eviction rate, late-payment / NSF rate, and stable-employment percentage? A property-management company in the area should have these aggregated.
- How much new for-sale + rental construction is in the pipeline within 1–3 miles? Heavy new supply typically softens prices + rents 12–24 months out; constrained supply supports both.
Investment metrics
- 1% rule
- 2.52% ✓
- Cap rate
- 21.41%
- Cash-on-cash
- 54.00%
- DSCR
- 3.40
- GRM
- 3.3
CMA / ARV
- ARV (median comp)
- $73,749
- List price
- $44,990
- Delta
- -39.00%
- Verdict
- UNDERPRICED
- Comps
- 20 within 1.0 mi
Show comp detail 12 sales within ~0.75 mi
| Address | Dist | Beds/Ba | Sqft | Sold | Price | $/sf | Match |
|---|---|---|---|---|---|---|---|
| 2032 Rugby Rd | 0.00mi | 3/1.0 | 1,422 (0%) | 0mo | $44,990 | $32 | 100 |
| 17 Marie Ave | 0.34mi | 4/1.5 (+1) | 1,424 (+0%) | 0mo | $70,000 | $49 | 76 |
| 117 Valleyview Dr | 0.30mi | 2/1.0 (-1) | 1,381 (-3%) | 1mo | $50,000 | $36 | 75 |
| 423 Sandalwood Dr | 0.54mi | 3/1.5 | 1,444 (+2%) | 0mo | $62,000 | $43 | 70 |
| 2401 Rugby Rd | 0.45mi | 3/1.5 | 1,368 (-4%) | 2mo | $89,000 | $65 | 69 |
| 1013 Sherwood Dr | 0.56mi | 3/1.5 | 1,428 (+0%) | 3mo | $174,900 | $122 | 69 |
| 50 Woodcrest Ave | 0.50mi | 3/1.0 | 1,500 (+6%) | 2mo | $155,000 | $103 | 66 |
| 23 W Norman Ave | 0.71mi | 3/1.0 | 1,472 (+4%) | 3mo | $39,000 | $26 | 59 |
| 1516 Kumler Ave | 0.63mi | 3/1.5 | 1,516 (+7%) | 1mo | $100,000 | $66 | 57 |
| 1034 Bertram Ave | 0.60mi | 3/3.0 | 1,326 (-7%) | 1mo | $178,000 | $134 | 52 |
| 1204 Kenyon Pl | 0.69mi | 3/1.0 | 1,256 (-12%) | 3mo | $80,000 | $64 | 46 |
| 1312 Earlham Dr | 0.65mi | 2/2.0 (-1) | 1,228 (-14%) | 3mo | $103,500 | $84 | 35 |
Match score weights: distance 35% · size 25% · config 20% · recency 20%. Top-matched comps best support the ARV.
Projected returns pro-forma
-3.0% appreciation · 3.03% rent growth · sell at horizon
- IRR
- 52.2%
- Equity multiple
- 3.29×
- Total profit
- $28,875
- Equity at exit
- $6,708
- IRR
- 57.5%
- Equity multiple
- 6.71×
- Total profit
- $71,886
- Equity at exit
- $3,890
Cash invested: $12,597 (down + closing). Projections, not guarantees.
Landlord ↔ Tenant lean methodology
- Overall (STATE)
- 73 Landlord-Friendly
- State Ohio
- 73 Landlord-Friendly · R+6
- County
- — inherits STATE
- City
- — inherits STATE
ZIP-level market 45406
- Rents YoY
- 3.0%
- Active inventory
- 156
- Price-to-rent
- 3.3×
Monthly cashflow live
- Estimated rent
- $1,133 high interval (Pro) →
- Mortgage (P&I)
- −$236
- Tax from tax record
- −$73 /mo · $880/yr
- Insurance
- −$19
- HOA
- −$0
- Vacancy / Maint / Mgmt
- −$238
- Net cashflow
- $567
Break-even live
UW: 25.0% down · 7.5% · 30yr · 1.5% tax · 5.0% vac · 8.0% maint · 8.0% mgmt
Financing live
Cash to close
- Down payment
- $11,248
- Closing costs
- $1,350
- Reserves months
- —
- Total cash needed
- —
Loan-product check · same deal, 3 products live
Conventional
25% down · 7.5% · 30yr
- Down + closing
- —
- Monthly P&I
- —
- Monthly cashflow
- —
- DSCR
- —
- Eligible?
- —
Personal DTI + credit; lowest rate.
DSCR
20% down · 8.5% · 30yr
- Down + closing
- —
- Monthly P&I
- —
- Monthly cashflow
- —
- DSCR
- —
- Eligible?
- —
No personal income docs; deal must DSCR.
Hard money
10% down · 12.0% · 12mo
- Down + closing
- —
- Monthly P&I
- —
- Monthly cashflow
- —
- DSCR
- —
- Eligible?
- —
Short-term bridge; refi at stabilization.
Rent comps 40 comps
| Address | Beds | Baths | Sqft | Rent | $/sqft | DOM | Units | Dist |
|---|---|---|---|---|---|---|---|---|
| 628 W Norman Ave Unit 628 Dayton, OH | 2.0 | 1.0 | 918 | $795 | $0.87 | 43d | 1 | 0.11mi |
| 439 W Fairview Ave Dayton, OH | 3.0 | 1.0 | 1500 | $1,200 | $0.80 | 43d | 1 | 0.22mi |
| 1004 W Fairview Ave Dayton, OH | 2.0 | 1.0 | 1053 | $950 | $0.90 | 23d | 1 | 0.23mi |
| 2232 Salem Ave Dayton, OH | 3.0 | 1.0 | 1250 | $1,200 | $0.96 | 3d | 1 | 0.25mi |
| 2247 Salem Ave Unit 2247 Dayton, OH | 3.0 | 1.5 | 1300 | $1,350 | $1.04 | 3d | 1 | 0.25mi |
| 2247 Salem Ave Unit 2249 Dayton, OH | 3.0 | 1.5 | 1300 | $1,400 | $1.08 | 43d | 1 | 0.25mi |
| 412 W Parkwood Dr Unit 1 Dayton, OH | 2.0 | 1.0 | 900 | $875 | $0.97 | 23d | 1 | 0.27mi |
| 1019 Cherry Dr Dayton, OH | 4.0 | 1.0 | 1057 | $1,125 | $1.06 | 43d | 1 | 0.30mi |
| 2333 Rustic Rd Dayton, OH | 2.0 | 1.0 | 1000 | $840 | $0.84 | 43d | 1 | 0.32mi |
| 2333 Rustic Rd Unit 4 Dayton, OH | 2.0 | 1.0 | 1000 | $840 | $0.84 | 2d | 1 | 0.32mi |
| 1743 Radcliffe Rd Dayton, OH | 3.0 | 1.5 | 1729 | $1,200 | $0.69 | 43d | 1 | 0.33mi |
| 1207 W Fairview Ave Dayton, OH | 2.0 | 1.0 | 1023 | $825 | $0.81 | 3d | 1 | 0.35mi |
| 1207 W Fairview Ave Dayton, OH | 2.0 | 1.0 | 1023 | $825 | $0.81 | 43d | 1 | 0.35mi |
| 201 W Norman Ave Dayton, OH | 3.0 | 1.0 | 1424 | $1,200 | $0.84 | 43d | 1 | 0.40mi |
| 181 W Norman Ave Dayton, OH | 3.0 | 2.0 | 1228 | $1,150 | $0.94 | 43d | 1 | 0.42mi |
| 1927 Burroughs Dr Dayton, OH | 3.0 | 2.0 | 1409 | $1,245 | $0.88 | 14d | 1 | 0.44mi |
| 167 W Hudson Ave Dayton, OH | 3.0 | 1.5 | 1344 | $1,185 | $0.88 | 43d | 1 | 0.47mi |
| 101 W Norman Ave Unit 101 Dayton, OH | 3.0 | 1.0 | 1600 | $945 | $0.59 | 43d | 1 | 0.57mi |
| 234 Santa Clara Ave Dayton, OH | 3.0 | 1.0 | 1368 | $1,125 | $0.82 | 43d | 1 | 0.59mi |
| 26 W Beechwood Ave Dayton, OH | 3.0 | 1.5 | 1468 | $1,050 | $0.72 | 43d | 1 | 0.60mi |
| 2141 Philadelphia Dr Dayton, OH | 3.0 | 1.0 | 1736 | $1,395 | $0.80 | 43d | 1 | 0.60mi |
| 265 Victor Ave Dayton, OH | 3.0 | 1.0 | 1204 | $900 | $0.75 | 43d | 1 | 0.61mi |
| 41 W Fairview Ave Unit 2 Dayton, OH | 3.0 | 1.0 | 1452 | $1,200 | $0.83 | 14d | 1 | 0.64mi |
| 2327 N Main St Unit 2 Dayton, OH | 2.0 | 1.0 | 900 | $1,200 | $1.33 | 23d | 1 | 0.69mi |
| 518 Delaware Ave Dayton, OH | 2.0 | 1.0 | 1500 | $750 | $0.50 | 43d | 1 | 0.73mi |
| 39 E Maplewood Ave Dayton, OH | 4.0 | 1.5 | 1560 | $1,050 | $0.67 | 3d | 1 | 0.76mi |
| 38 Pointview Ave Dayton, OH | 2.0 | 1.0 | 1140 | $900 | $0.79 | 14d | 1 | 0.77mi |
| 42 Pointview Ave Unit 42 Dayton, OH | 3.0 | 2.0 | 1240 | $1,200 | $0.97 | 3d | 1 | 0.77mi |
| 65 E Maplewood Ave Dayton, OH | 2.0 | 1.0 | 1064 | $723 | $0.68 | 43d | 1 | 0.79mi |
| 31 E Norman Ave Dayton, OH | 3.0 | 1.0 | 1100 | $1,150 | $1.05 | 23d | 1 | 0.81mi |
| 1225 Amherst Pl Dayton, OH | 3.0 | 1.0 | 1548 | $1,300 | $0.84 | 14d | 1 | 0.82mi |
| 1378 Cory Dr Dayton, OH | 2.0 | 1.0 | 1300 | $975 | $0.75 | 43d | 1 | 0.82mi |
| 1067 Salem Ave Dayton, OH | 2.0 | 1.0 | 1100 | $900 | $0.82 | 43d | 1 | 0.82mi |
| 1067 Salem Ave Unit 3 Dayton, OH | 2.0 | 1.5 | 1100 | $900 | $0.82 | 43d | 1 | 0.82mi |
| 1067 Salem Ave Unit 2 Dayton, OH | 2.0 | 1.5 | 1100 | $900 | $0.82 | 43d | 1 | 0.82mi |
| 147 Laura Ave Dayton, OH | 2.0 | 1.0 | 1096 | $975 | $0.89 | 23d | 1 | 0.85mi |
| 152 Laura Ave Dayton, OH | 2.0 | 1.0 | 990 | $895 | $0.90 | 43d | 1 | 0.86mi |
| 101 E Bruce Ave Dayton, OH | 3.0 | 1.0 | 1455 | $1,150 | $0.79 | 2d | 1 | 0.91mi |
| 202 E Bruce Ave Apt 2 Dayton, OH | 2.0 | 1.0 | 1250 | $800 | $0.64 | 23d | 1 | 0.98mi |
| 220 Fernwood Ave Dayton, OH | 2.0 | 1.0 | 884 | $900 | $1.02 | 3d | 1 | 0.98mi |
Listing history 8 events
-
2026-05-31status $44,990 Pending 35 DOM
-
2026-05-11price $55,000 786-char remark
-
2026-04-23$59,900 Active 786-char remark
-
2013-07-15soldstatus $6,107 Closed 98-char remark
Show marketing remark (98 chars)
AS IS. All room sizes are approximate. Rely on your own inspections. GREAT INVESTMENT OPPORTUNITY!
-
2013-07-15soldstatus $6,107 98-char remark
Show marketing remark (98 chars)
AS IS. All room sizes are approximate. Rely on your own inspections. GREAT INVESTMENT OPPORTUNITY!
-
2013-02-04historical 98-char remark
Show marketing remark (98 chars)
AS IS. All room sizes are approximate. Rely on your own inspections. GREAT INVESTMENT OPPORTUNITY!
-
2013-01-10$7,000 98-char remark
Show marketing remark (98 chars)
AS IS. All room sizes are approximate. Rely on your own inspections. GREAT INVESTMENT OPPORTUNITY!
-
1991-08-19soldstatus $43,000
ⓘ Source: listings_history table (triggers on properties + properties_extension) + one-shot
backfill from property_details.listing_events for pre-trigger history.
Tax reassessment forecast OH · Partial reset (capped growth)
- Current annual tax
- $880 · $73/mo
- Projected year-2 tax
- $880 · $73/mo
- Expected delta
- $0/yr ($0/mo · 0.0%)
ⓘ Screening estimate from a state-policy table — verify with the county assessor before closing.
Climate risk First Street
- Flood 1/10 Low FEMA zone X (unshaded) · 0% chance over 30 yrs
- Wildfire 1/10 Low
- Heat 3/10 Moderate 7 d/yr ≥104°F today · 18 d/yr by 30 yrs out
- Wind 2/10 Low
- Air quality 3/10 Moderate 2 unhealthy d/yr today · 4 by 30 yrs out
Nearby sold comps map
Loading sold comps map…
Walkable amenities ~0.75 mi
Loading nearby amenities…
Taxation est. · year 1
- Rental income
- $13,593
- − Mortgage interest
- −$2,520
- − Property taxes
- −$880
- − Insurance
- −$225
- − Repairs & maintenance
- −$1,087
- − Management
- −$1,087
- − Depreciation
- −$1,309
- Taxable income
- $6,484
- Est. tax owed @ 24.0%
- −$1,556
- After-tax cash flow
- $5,246/yr
For passive investors: Depreciation is non-cash, so a rental often shows a tax loss while cash-flowing — sheltering income. Rental losses are passive: they offset passive income freely, and up to $25,000/yr can offset ordinary (W-2) income if you actively participate and your MAGI is under $100k (phasing out to $0 by $150k); unused losses carry forward. On sale, claimed depreciation is recaptured at up to 25%, and gains may owe capital-gains tax (a 1031 exchange can defer both). Figures are a year-1 estimate at your 24.0% rate — not tax advice; consult a CPA.
Schools (NCES district)
- District
- Dayton City
- NCES district ID
- 3904384
- Math proficiency
- 12% ▼ -12.00%
- Reading proficiency
- 21% ▼ -11.00%
- Median HH income
- $28,688
- Composite
- 12.94/100
- National rank
- #9579
- State rank
- #641 of 656 in OH
Livability — Dayton
- Score
- 65/100
- State rank
- #716
- US rank
- #12895
Category grades
Schools grade is shown separately in the Schools card above.
Census & demographics
- Census place
- Dayton, OH
- County
- Montgomery County · 459,541 people
- City population
- 164,387
- Metro
- Dayton-Kettering, OH
- Population (ZIP)
- 19,991
- Household income
- $41,796
- Rent vs Own
- Severe rent burden
- 1504.0
Population outlook (Montgomery County) Hauer SSP2
- Today (2025)
- 523,241 people
- By 2030
- 514,948 · -1.6%
- By 2040
- 493,378 · -5.7%
- By 2050
- 469,639 · -10.2%
- By 2075
- 418,360 · -20.0%
- By 2100
- 353,315 · -32.5%
Race, ethnicity, and origin ACS 2023
- Neighborhood character
- Predominantly Black (75%)
- Race & ethnicity
- Black 75% White 16% Two or more races 7% Hispanic / Latino 3%
- Common ancestry
- Italian 2% Lithuanian 1% Slovak 1%
- Foreign-born
- 2% · Canada
- Languages at home
- 97% English-only · Spanish 1%
Political lean MEDSL · Montgomery
- 2024 margin
- Toss-up / Even · D 49.8% · R 49.3%
- 2008→2024 swing
- -5.8pp toward R · 2008: 6.2pp · 2024: 0.5pp
- All cycles
- 2024: D+0.5 2020: D+2.2 2016: R+1.2 2012: D+3.1 2008: D+6.2
Not yet ingested
- Civics
- —
Market trends
- HPI YoY
- ▼ -113.75%
- Current HPI
- 197.1302
- Rent YoY
- ▲ 3.03%
- Metro
- Dayton-Kettering, OH
- State GDP YoY
- ▲ 1.98%
- F500 in state
- 48
Industry mix (Fortune 500 HQ in OH)
| Industry | F500 HQs | Revenue |
|---|---|---|
| Insurance | 3 | $145B |
|
||
| Industrial Machinery | 3 | $49B |
|
||
| Financial Services | 3 | $24B |
|
||
| Consumer Goods | 2 | $93B |
|
||
| Aerospace / Defense | 2 | $47B |
|
||
| Utilities | 2 | $33B |
|
||
Price history
+4.6% since first listed13 events — show timeline
- 2026-06-17 Listed $44,990 CBRMLS
- 2026-06-17 Sold (MLS) $44,990 CBRMLS
- 2026-06-10 Sold (MLS) $44,990 Dayton MLS
- 2026-05-30 Pending — Dayton MLS
- 2026-05-22 Price Changed $44,990 Dayton MLS
- 2026-05-19 Price Changed $49,990 Dayton MLS
- 2026-05-11 Price Changed $55,000 Dayton MLS
- 2026-04-23 Listed $59,900 Dayton MLS
- 2013-07-15 Sold (MLS) $6,107 Dayton MLS
- 2013-07-15 Sold (MLS) $6,107 Dayton MLS
- 2013-02-04 Listing Removed — Dayton MLS
- 2013-01-10 Listed $7,000 Dayton MLS
- 1991-08-19 Sold (Public Records) $43,000 Public Records
Property tax history
-2.4%/yrLatest (2025): $880 · -8.3% YoY. Source: county tax records.
Cash-flow waterfall
monthlySold comps — $/sqft
last 12 mo · ≤1 miLoading sold comps…