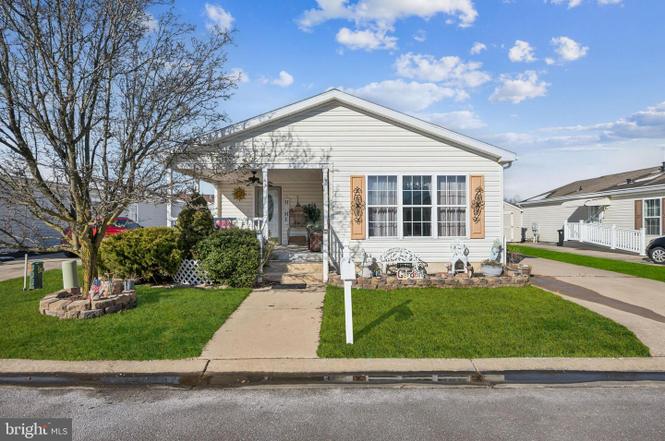
47 Gregory Dr · Sicklerville, NJ
Flood risk No data
- FEMA flood zone
- —
- Chance of flooding over 30 yrs
- —
- Est. flood insurance / yr
- —
Fire risk No data
- Est. fire insurance / yr
- —
Heat risk No data
- Hot days now (above threshold)
- —
- Hot days in 30 yrs
- —
Wind risk No data
- Chance of severe wind over 30 yrs
- —
Air-quality risk No data
- Unhealthy air days now
- —
- Unhealthy air days in 30 yrs
- —
Risk factors via First Street. Map © Google.
Why this score? — see what drove the B- grade
The composite is a weighted blend of 9 inputs, each scored 0–100. Each bar is that input's sub-score; the figure is the points it added to the 100-point composite (weight × sub-score).
- Cash flow +25.4/30.0
- ARV discount +14.7/15.0
- DSCR +8.4/10.0
- 1% rule +6.7/10.0
- Schools +3.0/10.0
- Rent growth +2.5/5.0
- Livability +2.5/5.0
- Condition / age +2.5/5.0
- Appreciation +0.0/10.0
$219,000
🖨 Deal sheet 📄 Offer letter ✓ Due diligence
Listing remarks
HUGE REDUCTION/////////Welcome to your new home in the 55+ Sunny Estates community! So close to all the conveniences of the area. Shopping, transportation, the Jersey Shore and Philadelphia. The owner has spared no expense in finishing off with beautiful hardwood floors and wood cabinetry. The primary suite is completed with it's own beautiful ensuite bath. Conveniently situated off the spacious kitchen is the full sized laundry room which boasts a door to the exterior sitting area surrounded by mature landscaping for optimum privacy. You will love the light streaming in from the skylight in the living space throughout the the open concept floor plan. Most of the furniture can stay or go.
Key facts
- Trex decking
- Spacious porch
- Built 2003
Tags
Property features AI
Finance
- Other: Accessibility with 2+ access exits
- Financial info: Annual ground rent listed under income/expense
- HOA & community: Property manager on site; Ground rent exists with a monthly land lease ($743/month); Approximately 15 years remaining on land lease
Exterior
- Parking: Driveway
- Utilities: Public water; Public sewer; Natural gas service; Electric cooling power
- Home design: Manufactured home; Located in a senior community (55+); Land lease community
- Construction: Vinyl siding; Shingle roof; Estimated year built
- Exterior features: Shed; Above-grade other structures
Interior
- Kitchen: Built-in microwave; Built-in range
- Bedrooms: Two main-level bedrooms
- Flooring: Wood floors
- Bathrooms: Two full bathrooms (including two full on main level)
- Heating & cooling: Forced air heating; Central air conditioning (electric); Natural gas hot water
- Interior features: Ceiling fans; Dining area; Open floor plan; Formal dining room; Eat-in kitchen; Skylights; Window treatments; Wood floors
- Laundry & utility: Main-floor laundry
Neighborhood map
What this means for you Summary
Snapshot
- This is a 2-bed/2.0-bath single-family listed at $219k.
Deal economics
- At list price, monthly cash flow is $504 ($6k/yr) — positive.
- The deal already cash-flows at list — no discount required.
- Meets the 1% rule at list price ($3k rent vs $219k).
- Recommended offer: $193k (12.0% below list) — sets the bar for market timing.
- Cap rate 9.1% vs local median 4.7% in Sicklerville — top-decile yield for the area; either an underpriced asset or a hidden risk that comps aren't pricing in. Stress-test before assuming the spread holds.
Location & tenants
- Location reads: area grade B — affects rentability + tenant quality, not the cash-flow math above.
- Monroe Township Public School District (suburban): math 20% / reading 45% proficiency, ranked #302 of 472 in NJ (top 64%) — families likely to look elsewhere, expect single-tenant / working-renter base with shorter leases.
- Market conditions: 268 active listings in the ZIP; 5 comparable units currently listed for rent nearby; rentals leasing fast (median 1d on market — plan ~1-2 weeks tenant-placement turnaround); solid renter incomes; 1,047 units permitted in Gloucester County in 2024 (183 in 5+ unit buildings).
- This rent runs 32% of the median local income ($97k/yr) — at the standard rent-burdened threshold; future hikes will face affordability resistance.
Forward outlook
- Local home prices are declining (-3.0%/yr); year-one equity from $2k of loan paydown is wiped out by about $7k of value loss. Plan a longer hold.
- Gloucester County population projected to shrink 5% by 2050 — rents likely to lag national; underwrite the cash flow, not the appreciation.
Negotiation context
- It's been on market 147 days — a 12% lower offer ($193k) is reasonable based on typical stale-listing flexibility.
- 2 sale attempts; this cycle's ask has dropped $16k (7%) from the opening price — seller is motivated, your offer sets the floor, not the list.
Questions for the listing agent
- It's been on market 147 days. Have you received any prior offers? Is the seller open to a 12% concession, seller financing, or rate buy-down credit?
- Why hasn't it sold? Are there any deal-killer items the seller is aware of (foundation, flood, title, zoning, code violations)?
- Is there a deadline driving the sale (1031 exchange, divorce, estate, relocation)? That informs how much negotiation room exists.
- What's the average days-on-market for RENTAL listings here right now (not sales)? A rising rental-DOM trend means longer vacancies and softer asking-rent achievability than the comps imply.
- What's the recent tenant-quality profile in this submarket — average credit score on applications, eviction rate, late-payment / NSF rate, and stable-employment percentage? A property-management company in the area should have these aggregated.
- How much new for-sale + rental construction is in the pipeline within 1–3 miles? Heavy new supply typically softens prices + rents 12–24 months out; constrained supply supports both.
Investment metrics
- 1% rule
- 1.17% ✓
- Cap rate
- 9.05%
- Cash-on-cash
- 9.86%
- DSCR
- 1.44
- GRM
- 7.1
CMA / ARV
- ARV (on-the-fly)
- $260,400
- Comps found
- 12
Show comp detail 12 sales within ~0.75 mi
| Address | Dist | Beds/Ba | Sqft | Sold | Price | $/sf | Match |
|---|---|---|---|---|---|---|---|
| 165 Dorian Dr | 0.22mi | 2/2.0 | 1,680 (0%) | 1mo | $259,900 | $155 | 89 |
| 161 Dorian Dr | 0.22mi | 2/2.0 | 1,680 (0%) | 2mo | $265,000 | $158 | 88 |
| 14 Gibson Ln | 0.15mi | 2/2.0 | 1,680 (0%) | 8mo | $235,000 | $140 | 86 |
| 301 Kennedy | 0.15mi | 3/2.0 (+1) | 1,568 (-7%) | 8mo | $129,000 | $82 | 70 |
| 209 Harrison Ave | 0.44mi | 3/2.0 (+1) | 1,700 (+1%) | 3mo | $145,000 | $85 | 70 |
| 200 Harrison Ave | 0.47mi | 3/2.0 (+1) | 1,650 (-2%) | 5mo | $139,500 | $85 | 66 |
| 1510 N Main St | 0.58mi | 3/2.0 (+1) | 1,686 (+0%) | 9mo | $320,000 | $190 | 60 |
| 509 Tuckahoe Rd | 0.67mi | 3/1.5 (+1) | 1,716 (+2%) | 4mo | $360,000 | $210 | 55 |
| 203 Tyler Ave | 0.65mi | 3/3.0 (+1) | 1,680 (0%) | 11mo | $130,000 | $77 | 52 |
| 1804 Lillian Dr | 0.72mi | 3/1.5 (+1) | 1,784 (+6%) | 0mo | $280,000 | $157 | 49 |
| 522 Buchannan Ave | 0.57mi | 3/2.0 (+1) | 1,500 (-11%) | 7mo | $103,000 | $69 | 45 |
| 61 Olympia Ln | 0.71mi | 3/2.5 (+1) | 1,908 (+14%) | 4mo | $435,000 | $228 | 34 |
Match score weights: distance 35% · size 25% · config 20% · recency 20%. Top-matched comps best support the ARV.
Projected returns pro-forma
-3.0% appreciation · 3.0% rent growth · sell at horizon
- IRR
- -1.4%
- Equity multiple
- 0.95×
- Total profit
- $-3,349
- Equity at exit
- $32,654
- IRR
- 8.3%
- Equity multiple
- 1.63×
- Total profit
- $38,575
- Equity at exit
- $18,935
Cash invested: $61,320 (down + closing). Projections, not guarantees.
Landlord ↔ Tenant lean methodology
- Overall (STATE)
- 21 Tenant-Leaning
- State New Jersey
- 21 Tenant-Leaning · D+6
- County
- — inherits STATE
- City
- — inherits STATE
ZIP-level market 08094
- Active inventory
- 268
- Price-to-rent
- 7.1×
Monthly cashflow live
- Estimated rent
- $2,554 medium interval (Pro) →
- Mortgage (P&I)
- −$1,148
- Tax est. 1.5%
- −$274 /mo · $3,285/yr
- Insurance
- −$91
- HOA
- −$0
- Vacancy / Maint / Mgmt
- −$536
- Net cashflow
- $504
Break-even live
UW: 25.0% down · 7.5% · 30yr · 1.5% tax · 5.0% vac · 8.0% maint · 8.0% mgmt
Financing live
Cash to close
- Down payment
- $54,750
- Closing costs
- $6,570
- Reserves months
- —
- Total cash needed
- —
Loan-product check · same deal, 3 products live
Conventional
25% down · 7.5% · 30yr
- Down + closing
- —
- Monthly P&I
- —
- Monthly cashflow
- —
- DSCR
- —
- Eligible?
- —
Personal DTI + credit; lowest rate.
DSCR
20% down · 8.5% · 30yr
- Down + closing
- —
- Monthly P&I
- —
- Monthly cashflow
- —
- DSCR
- —
- Eligible?
- —
No personal income docs; deal must DSCR.
Hard money
10% down · 12.0% · 12mo
- Down + closing
- —
- Monthly P&I
- —
- Monthly cashflow
- —
- DSCR
- —
- Eligible?
- —
Short-term bridge; refi at stabilization.
Rent comps 5 comps
| Address | Beds | Baths | Sqft | Rent | $/sqft | DOM | Units | Dist |
|---|---|---|---|---|---|---|---|---|
| 1616 N Main St Williamstown, NJ | 2.0 | 2.0 | 1064 | $2,500 | $2.35 | 1d | 1 | 0.25mi |
| 1761 Glassboro Cross Keys Rd Williamstown, NJ | 2.0 | 1.0 | 1300 | $2,000 | $1.54 | 19d | 1 | 0.33mi |
| 1000 Fawn Dr Williamstown, NJ | 1.0–2.0 | 1.0–2.0 | 1209 | $5,983 | $4.95 | 1d | 1 | 0.70mi |
| 100 Town Center Blvd Sewell, NJ | 1.0–2.0 | 1.0–2.0 | 1107 | $3,130 | $2.83 | 1d | 16 | 1.20mi |
| 343 Brookdale Blvd Williamstown, NJ | 3.0 | 2.5 | 1438 | $2,500 | $1.74 | 1d | 1 | 1.41mi |
Listing history 21 events
-
2026-06-18days on market $219,000 Active 147 DOM
-
2026-06-17days on market $219,000 Active 146 DOM
-
2026-06-16days on market $219,000 Active 145 DOM
-
2026-06-15days on market $219,000 Active 144 DOM
-
2026-06-13days on market $219,000 Active 142 DOM
-
2026-06-09days on market $219,000 Active 138 DOM
-
2026-06-08days on market $219,000 Active 137 DOM
-
2026-06-07days on market $219,000 Active 136 DOM
-
2026-06-04days on market $219,000 Active 133 DOM
-
2026-06-03days on market $219,000 Active 132 DOM
-
2026-06-02days on market $219,000 Active 131 DOM
-
2026-06-01days on market $219,000 Active 130 DOM
-
2026-05-31days on market $219,000 Active 129 DOM
-
2026-04-10price $229,500
-
2026-01-22$235,000 Active
-
2026-01-10historical
-
2025-11-15price $236,995
-
2025-10-28price $239,995
-
2025-10-14price $259,995
-
2025-10-02price $264,999
-
2025-07-16$269,995 Active
ⓘ Source: listings_history table (triggers on properties + properties_extension) + one-shot
backfill from property_details.listing_events for pre-trigger history.
Nearby sold comps map
Loading sold comps map…
Walkable amenities ~0.75 mi
Loading nearby amenities…
Taxation est. · year 1
- Rental income
- $30,645
- − Mortgage interest
- −$12,267
- − Property taxes
- −$3,285
- − Insurance
- −$1,095
- − Repairs & maintenance
- −$2,452
- − Management
- −$2,452
- − Depreciation
- −$6,371
- Taxable income
- $2,723
- Est. tax owed @ 24.0%
- −$654
- After-tax cash flow
- $5,394/yr
For passive investors: Depreciation is non-cash, so a rental often shows a tax loss while cash-flowing — sheltering income. Rental losses are passive: they offset passive income freely, and up to $25,000/yr can offset ordinary (W-2) income if you actively participate and your MAGI is under $100k (phasing out to $0 by $150k); unused losses carry forward. On sale, claimed depreciation is recaptured at up to 25%, and gains may owe capital-gains tax (a 1031 exchange can defer both). Figures are a year-1 estimate at your 24.0% rate — not tax advice; consult a CPA.
Schools (NCES district)
- District
- Monroe Township Public School District
- NCES district ID
- 3410470
- Math proficiency
- 20% ▼ -24.00%
- Reading proficiency
- 45% ▼ -9.00%
- Median HH income
- $71,557
- Composite
- 30.24/100
- National rank
- #6295
- State rank
- #302 of 472 in NJ
Livability — Sicklerville
No livability data for this city. (Only ~50 U.S. cities are tracked.)
Census & demographics
- County
- Gloucester County · 160,422 people
- City population
- 50,264
- Metro
- Philadelphia-Camden-Wilmington, PA-NJ-DE-MD
- Population (ZIP)
- 41,595
- Household income
- $96,699
- Rent vs Own
- Severe rent burden
- 721.0
Population outlook (Gloucester County) Hauer SSP2
- Today (2025)
- 298,895 people
- By 2030
- 299,031 · +0.0%
- By 2040
- 294,020 · -1.6%
- By 2050
- 284,188 · -4.9%
- By 2075
- 260,720 · -12.8%
- By 2100
- 229,565 · -23.2%
Race, ethnicity, and origin ACS 2023
- Neighborhood character
- Predominantly White (73%)
- Race & ethnicity
- White 73% Hispanic / Latino 11% Black 10% Two or more races 8% Asian 1%
- Hispanic origin (detail)
- Puerto Rican 6% Dominican 1%
- Common ancestry
- Romanian 6% Slovak 2% Lithuanian 1%
- Foreign-born
- 4% · Canada
- Languages at home
- 92% English-only · Spanish 5% Russian/Polish/Slavic 1%
Political lean MEDSL · Gloucester
- 2024 margin
- Toss-up / Even · D 47.8% · R 50.6% · Other 1.6%
- 2008→2024 swing
- -15.0pp toward R · 2008: 12.2pp · 2024: -2.8pp
- All cycles
- 2024: R+2.8 2020: D+1.9 2016: R+0.4 2012: D+10.5 2008: D+12.2
Not yet ingested
- Civics
- —
Market trends
- HPI YoY
- ▼ -213.12%
- Current HPI
- 278.3849
- Rent YoY
- —
- Metro
- Philadelphia-Camden-Wilmington, PA-NJ-DE-MD
- State GDP YoY
- ▲ 2.05%
- F500 in state
- 34
Industry mix (Fortune 500 HQ in NJ)
| Industry | F500 HQs | Revenue |
|---|---|---|
| Consumer Goods | 3 | $31B |
|
||
| Pharmaceuticals | 2 | $153B |
|
||
| Technology | 2 | $21B |
|
||
| Insurance | 2 | $20B |
|
||
| Healthcare | 2 | $19B |
|
||
| Financial Services | 1 | $70B |
|
||
Price history
-15.0% since first listed8 events — show timeline
- 2026-04-10 Price Changed $229,500 BRIGHT MLS
- 2026-01-22 Listed $235,000 BRIGHT MLS
- 2026-01-10 Listing Removed — BRIGHT MLS
- 2025-11-15 Price Changed $236,995 BRIGHT MLS
- 2025-10-28 Price Changed $239,995 BRIGHT MLS
- 2025-10-14 Price Changed $259,995 BRIGHT MLS
- 2025-10-02 Price Changed $264,999 BRIGHT MLS
- 2025-07-16 Listed $269,995 BRIGHT MLS
Cash-flow waterfall
monthlySold comps — $/sqft
last 12 mo · ≤1 miLoading sold comps…