116 Lakehill Ct · Hickory Creek, TX
Flood risk 1/10 · Minimal
- FEMA flood zone
- X (unshaded)
- Chance of flooding over 30 yrs
- 0.0%
- Est. flood insurance / yr
- $507 – $1,088
Fire risk 3/10 · Minor
- Est. fire insurance / yr
- $1,222 – $2,270
Heat risk 7/10 · Major
- Hot days now (above 109°F)
- 7 days/yr
- Hot days in 30 yrs
- 22 days/yr
Wind risk 4/10 · Minor
- Chance of severe wind over 30 yrs
- 22.0%
Air-quality risk 4/10 · Minor
- Unhealthy air days now
- 4 days/yr
- Unhealthy air days in 30 yrs
- 5 days/yr
Risk factors via First Street. Map © Google.
Why this score? — see what drove the B- grade
The composite is a weighted blend of 9 inputs, each scored 0–100. Each bar is that input's sub-score; the figure is the points it added to the 100-point composite (weight × sub-score).
- Cash flow +30.0/30.0
- 1% rule +10.0/10.0
- DSCR +10.0/10.0
- ARV discount +6.2/15.0
- Livability +3.6/5.0
- Schools +3.4/10.0
- Rent growth +2.5/5.0
- Condition / age +2.5/5.0
- Appreciation +0.0/10.0
$545,000
🖨 Deal sheet 📄 Offer letter ✓ Due diligence
Listing remarks MLS
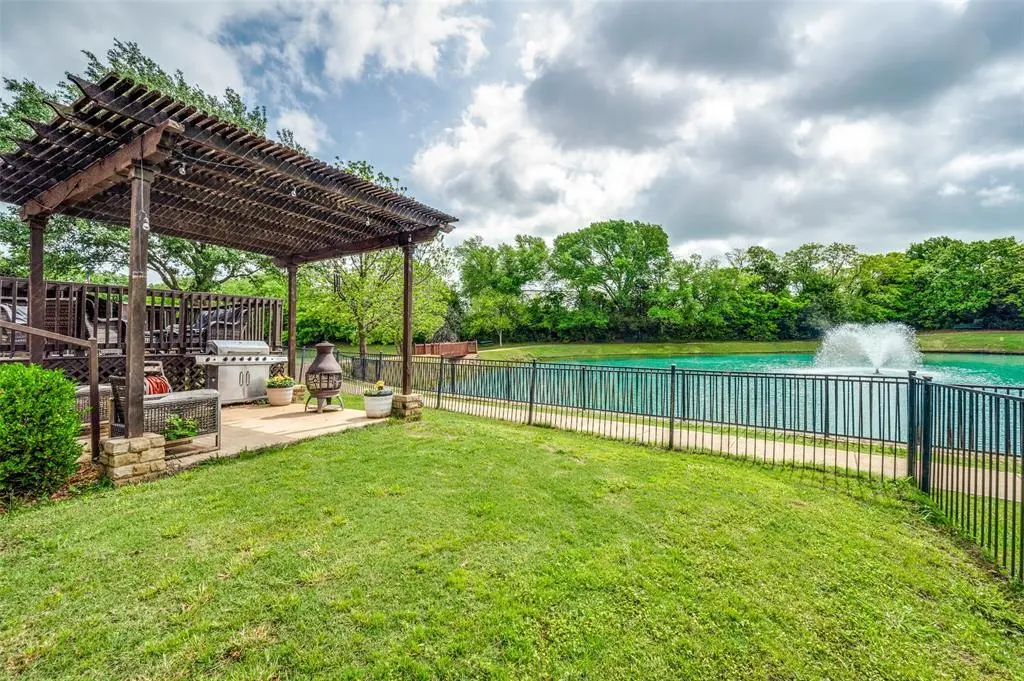
Best Location In The neighborhood! This home sits on the edge of the neighborhood pond and includes the pleasant sounds of the water fountain right outside your back door. The quiet Cul De Sac location offers easy access to the walking trail around the pond tucked away from the rest of the busy neighborhood. Hickory Creek is surrounded by Lake Lewisville and offers lake life at its finest including: many parks, trails, boat launch ramps, community events, and local shopping. Drive to your favorite local restaurant in your golf cart and feel as though you have escaped the big city. This home boasts 5 bedrooms plus a study, as well as 3 additional living areas. Plenty of room for entertaining and play inside and out. The convenient access to major roadways including HOV lanes on I-35, Lake Lewisville Toll Bridge, and 2499 makes it easy to commute to major work areas in Denton, Lewisville, Frisco, Dallas and both DFW airports. This is a must see home to appreciate all it's ideal features including an ideal neighborhood! The neighborhood pool, park, and greenbelt areas are an added bonus for all your outdoor activities right outside your front door.
Key facts
- Greenbelt areas
- Neighborhood pool
- 7,971 sq ft lot
Tags
Neighborhood map
What this means for you Summary
Snapshot
- This is a 3-bed/4.0-bath single-family listed at $545k.
Deal economics
- At list price, monthly cash flow is $6k ($74k/yr) — positive.
- The deal already cash-flows at list — no discount required.
- Meets the 1% rule at list price ($13k rent vs $545k).
- Recommended offer: $512k (6.0% below list) — sets the bar for market timing.
- Cap rate 19.9% vs local median 2.6% in Hickory Creek — top-decile yield for the area; either an underpriced asset or a hidden risk that comps aren't pricing in. Stress-test before assuming the spread holds.
Location & tenants
- Location reads 72/100 on livability (#238 in TX) — a middle-class / working-renter tenant base. Strengths: crime A+, employment A+, housing A+; Watch: cost of living D+, amenities F, commute F.
- Lake Dallas ISD (suburban): math 34% / reading 39% proficiency, ranked #413 of 826 in TX (top 50%) — families likely to look elsewhere, expect single-tenant / working-renter base with shorter leases.
- Market conditions: 130 active listings in the ZIP; 2 comparable units currently listed for rent nearby; 10,531 units permitted in Denton County in 2024 (2,713 in 5+ unit buildings).
Forward outlook
- Local home prices are declining (-3.0%/yr); year-one equity from $4k of loan paydown is wiped out by about $16k of value loss. Plan a longer hold.
- Denton County population projected at +66% by 2050 — long-run rental-demand tailwind backs the buy-and-hold thesis.
- At projected returns (-3.0% appreciation + 3.0% rent growth), your $153k cash investment doubles in ~3 years — after that, you're playing with house money.
Negotiation context
- It's been on market 64 days — a 6% lower offer ($512k) is reasonable based on typical stale-listing flexibility.
- 9 sale attempts since 17y ago with the ask held roughly flat each time — persistent listings suggest the price (not the market) is what's stuck; bring a comps-based counter.
Risks & watch-outs
- Climate carrying-cost: extreme-heat days projected 7→22/yr by 2055 (HVAC capex compounding) — expect insurance premiums to compound above CPI over the hold.
Questions for the listing agent
- It's been on market 64 days. Have you received any prior offers? Is the seller open to a 6% concession, seller financing, or rate buy-down credit?
- What does the HOA fee cover, when was the last increase, and are there any pending special assessments or reserve-fund shortfalls?
- Why hasn't it sold? Are there any deal-killer items the seller is aware of (foundation, flood, title, zoning, code violations)?
- Is there a deadline driving the sale (1031 exchange, divorce, estate, relocation)? That informs how much negotiation room exists.
- Schools are A-rated — typically a magnet for longer-tenancy family renters. What's the average tenant stay here, and is there a school-zone premium baked into asking?
- What's the average days-on-market for RENTAL listings here right now (not sales)? A rising rental-DOM trend means longer vacancies and softer asking-rent achievability than the comps imply.
- What's the recent tenant-quality profile in this submarket — average credit score on applications, eviction rate, late-payment / NSF rate, and stable-employment percentage? A property-management company in the area should have these aggregated.
- How much new for-sale + rental construction is in the pipeline within 1–3 miles? Heavy new supply typically softens prices + rents 12–24 months out; constrained supply supports both.
Investment metrics
- 1% rule
- 2.36% ✓
- Cap rate
- 19.91%
- Cash-on-cash
- 48.65%
- DSCR
- 3.16
- GRM
- 3.5
CMA / ARV
- ARV (median comp)
- $529,882
- List price
- $545,000
- Delta
- 2.85%
- Verdict
- FAIR
- Comps
- 20 within 1.0 mi
Show comp detail 12 sales within ~0.75 mi
| Address | Dist | Beds/Ba | Sqft | Sold | Price | $/sf | Match |
|---|---|---|---|---|---|---|---|
| 115 Lakehill Ct | 0.04mi | 4/3.0 (+1) | 3,243 (-3%) | 12mo | $875,000 | $270 | 74 |
| 100 Red Bluff Ct | 0.33mi | 4/3.0 (+1) | 3,383 (+1%) | 1mo | $724,900 | $214 | 72 |
| 146 Shasta Dr | 0.27mi | 4/2.5 (+1) | 3,293 (-1%) | 3mo | $619,900 | $188 | 72 |
| 201 Barkley Dr | 0.23mi | 4/3.0 (+1) | 3,243 (-3%) | 7mo | $579,900 | $179 | 70 |
| 251 Barkley Dr | 0.45mi | 4/3.5 (+1) | 3,461 (+4%) | 1mo | $649,900 | $188 | 66 |
| 242 Livingston Dr | 0.41mi | 4/3.0 (+1) | 3,203 (-4%) | 2mo | $585,000 | $183 | 64 |
| 219 Livingston Dr | 0.37mi | 4/2.5 (+1) | 3,169 (-5%) | 1mo | $545,000 | $172 | 62 |
| 109 Belton Dr | 0.21mi | 4/3.5 (+1) | 3,584 (+7%) | 13mo | $560,000 | $156 | 60 |
| 1106 Ellard Dr | 0.72mi | 4/3.0 (+1) | 3,392 (+2%) | 2mo | $1,100,000 | $324 | 53 |
| 138 Nix Dr | 0.34mi | 4/3.0 (+1) | 3,062 (-8%) | 10mo | $525,000 | $171 | 53 |
| 3 Texoma Ct | 0.41mi | 4/2.5 (+1) | 2,920 (-12%) | 9mo | $499,000 | $171 | 42 |
| 204 Forestview Rd | 0.75mi | 4/2.5 (+1) | 2,929 (-12%) | 10mo | $440,000 | $150 | 26 |
Match score weights: distance 35% · size 25% · config 20% · recency 20%. Top-matched comps best support the ARV.
Projected returns pro-forma
-3.0% appreciation · 3.0% rent growth · sell at horizon
- IRR
- 46.2%
- Equity multiple
- 3.01×
- Total profit
- $306,034
- Equity at exit
- $81,261
- IRR
- 52.0%
- Equity multiple
- 6.08×
- Total profit
- $775,178
- Equity at exit
- $47,122
Cash invested: $152,600 (down + closing). Projections, not guarantees.
Landlord ↔ Tenant lean methodology
- Overall (STATE)
- 87 Strongly Landlord-Friendly
- State Texas
- 87 Strongly Landlord-Friendly · R+5
- County
- — inherits STATE
- City
- — inherits STATE
ZIP-level market 75065
- Home prices YoY
- -6.8%
- Active inventory
- 130
- Price-to-rent
- 3.5×
Monthly cashflow live
- Estimated rent
- $12,870 medium interval (Pro) →
- Mortgage (P&I)
- −$2,858
- Tax from tax record
- −$847 /mo · $10,168/yr
- Insurance
- −$227
- HOA
- −$48
- Vacancy / Maint / Mgmt
- −$2,703
- Net cashflow
- $6,187
Break-even live
UW: 25.0% down · 7.5% · 30yr · 1.5% tax · 5.0% vac · 8.0% maint · 8.0% mgmt
Financing live
Cash to close
- Down payment
- $136,250
- Closing costs
- $16,350
- Reserves months
- —
- Total cash needed
- —
Loan-product check · same deal, 3 products live
Conventional
25% down · 7.5% · 30yr
- Down + closing
- —
- Monthly P&I
- —
- Monthly cashflow
- —
- DSCR
- —
- Eligible?
- —
Personal DTI + credit; lowest rate.
DSCR
20% down · 8.5% · 30yr
- Down + closing
- —
- Monthly P&I
- —
- Monthly cashflow
- —
- DSCR
- —
- Eligible?
- —
No personal income docs; deal must DSCR.
Hard money
10% down · 12.0% · 12mo
- Down + closing
- —
- Monthly P&I
- —
- Monthly cashflow
- —
- DSCR
- —
- Eligible?
- —
Short-term bridge; refi at stabilization.
Rent comps 2 comps
| Address | Beds | Baths | Sqft | Rent | $/sqft | DOM | Units | Dist |
|---|---|---|---|---|---|---|---|---|
| 201 Barkley Dr Unit 1391266P Hickory Creek, TX | 4.0 | 3.0 | 3239 | $15,242 | $4.71 | 24d | 1 | 0.22mi |
| 201 Barkley Dr Lake Dallas, TX | 4.0 | 3.0 | 3243 | $10,500 | $3.24 | 22d | 1 | 0.22mi |
HOA detail
- Monthly dues
- $48 · $576/yr
- Likely covers
- waterpool
Listing history 50 events
-
2026-06-18days on market $545,000 Active 64 DOM
-
2026-06-17days on market $545,000 Active 63 DOM
-
2026-06-16days on market $545,000 Active 62 DOM
-
2026-06-15days on market $545,000 Active 61 DOM
-
2026-06-13pricedays on market $545,000 Active 59 DOM
-
2026-06-09days on market $549,000 Active 55 DOM
-
2026-06-08days on market $549,000 Active 54 DOM
-
2026-06-07days on market $549,000 Active 53 DOM
-
2026-06-04pricedays on market $549,000 Active 50 DOM
-
2026-06-03days on market $559,000 Active 49 DOM
-
2026-06-02days on market $559,000 Active 48 DOM
-
2026-06-01days on market $559,000 Active 47 DOM
-
2026-05-31days on market $559,000 Active 46 DOM
-
2026-05-08price $559,000 1163-char remark
Show marketing remark (1163 chars)
Best Location In The neighborhood! This home sits on the edge of the neighborhood pond and includes the pleasant sounds of the water fountain right outside your back door. The quiet Cul De Sac location offers easy access to the walking trail around the pond tucked away from the rest of the busy neighborhood. Hickory Creek is surrounded by Lake Lewisville and offers lake life at its finest including: many parks, trails, boat launch ramps, community events, and local shopping. Drive to your favorite local restaurant in your golf cart and feel as though you have escaped the big city. This home boasts 5 bedrooms plus a study, as well as 3 additional living areas. Plenty of room for entertaining and play inside and out. The convenient access to major roadways including HOV lanes on I-35, Lake Lewisville Toll Bridge, and 2499 makes it easy to commute to major work areas in Denton, Lewisville, Frisco, Dallas and both DFW airports. This is a must see home to appreciate all it's ideal features including an ideal neighborhood! The neighborhood pool, park, and greenbelt areas are an added bonus for all your outdoor activities right outside your front door.
-
2026-04-15$565,000 Active 1163-char remark
Show marketing remark (1163 chars)
Best Location In The neighborhood! This home sits on the edge of the neighborhood pond and includes the pleasant sounds of the water fountain right outside your back door. The quiet Cul De Sac location offers easy access to the walking trail around the pond tucked away from the rest of the busy neighborhood. Hickory Creek is surrounded by Lake Lewisville and offers lake life at its finest including: many parks, trails, boat launch ramps, community events, and local shopping. Drive to your favorite local restaurant in your golf cart and feel as though you have escaped the big city. This home boasts 5 bedrooms plus a study, as well as 3 additional living areas. Plenty of room for entertaining and play inside and out. The convenient access to major roadways including HOV lanes on I-35, Lake Lewisville Toll Bridge, and 2499 makes it easy to commute to major work areas in Denton, Lewisville, Frisco, Dallas and both DFW airports. This is a must see home to appreciate all it's ideal features including an ideal neighborhood! The neighborhood pool, park, and greenbelt areas are an added bonus for all your outdoor activities right outside your front door.
-
2026-04-01historical
-
2026-02-10$569,900 Active
-
2023-03-23soldstatus
-
2023-03-22soldstatus Closed
-
2023-02-20status Pending
-
2023-02-17price $554,900
-
2023-02-07soldstatus
-
2023-01-30price $564,900
-
2023-01-19price $570,000
-
2023-01-03price $575,000
-
2022-12-14$594,900 Active
-
2022-12-04price $594,900
-
2022-11-06price $599,900
-
2022-10-06price $605,000
-
2022-09-12price $615,000
-
2022-09-02historical
-
2022-08-29$629,900 Active
-
2022-07-08soldstatus
-
2022-06-13soldstatus
-
2016-01-25soldstatus
-
2016-01-25soldstatus
-
2016-01-22soldstatus Sold
-
2016-01-11status Pending
-
2015-12-07historical Active Contingent
-
2015-11-12$299,000 Active
-
2015-11-11historical
-
2015-09-04price $299,000
-
2015-07-28status Active
-
2015-07-25historical Active Option Contract
-
2015-07-06price $309,000
-
2015-06-18$319,000 Active
-
2015-06-12historical
-
2015-04-10price $319,000
-
2015-03-24$329,900 Active
-
2009-07-06soldstatus
ⓘ Source: listings_history table (triggers on properties + properties_extension) + one-shot
backfill from property_details.listing_events for pre-trigger history.
Tax reassessment forecast TX · Resets to sale price
- Current annual tax
- $10,168 · $847/mo
- Projected year-2 tax
- $10,168 · $847/mo
- Expected delta
- $0/yr ($0/mo · 0.0%)
ⓘ Screening estimate from a state-policy table — verify with the county assessor before closing.
Climate risk First Street
- Flood 1/10 Low FEMA zone X (unshaded) · 0% chance over 30 yrs
- Wildfire 3/10 Moderate
- Heat 7/10 Severe 7 d/yr ≥109°F today · 22 d/yr by 30 yrs out
- Wind 4/10 Moderate 22% chance of damaging wind over 30 yrs
- Air quality 4/10 Moderate 4 unhealthy d/yr today · 5 by 30 yrs out
Nearby sold comps map
Loading sold comps map…
Walkable amenities ~0.75 mi
Loading nearby amenities…
Taxation est. · year 1
- Rental income
- $154,434
- − Mortgage interest
- −$30,528
- − Property taxes
- −$10,168
- − Insurance
- −$2,725
- − Repairs & maintenance
- −$12,355
- − Management
- −$12,355
- − HOA
- −$576
- − Depreciation
- −$15,855
- Taxable income
- $69,873
- Est. tax owed @ 24.0%
- −$16,770
- After-tax cash flow
- $57,468/yr
For passive investors: Depreciation is non-cash, so a rental often shows a tax loss while cash-flowing — sheltering income. Rental losses are passive: they offset passive income freely, and up to $25,000/yr can offset ordinary (W-2) income if you actively participate and your MAGI is under $100k (phasing out to $0 by $150k); unused losses carry forward. On sale, claimed depreciation is recaptured at up to 25%, and gains may owe capital-gains tax (a 1031 exchange can defer both). Figures are a year-1 estimate at your 24.0% rate — not tax advice; consult a CPA.
Schools (NCES district)
- District
- Lake Dallas ISD
- NCES district ID
- 4826430
- Math proficiency
- 34% ▼ -20.00%
- Reading proficiency
- 39% ▼ -10.00%
- Median HH income
- $76,645
- Composite
- 34.13/100
- National rank
- #5287
- State rank
- #413 of 826 in TX
Livability — Hickory Creek
- Score
- 72/100
- State rank
- #238
- US rank
- #5782
Category grades
Schools grade is shown separately in the Schools card above.
Census & demographics
- Census place
- Hickory Creek, TX
- City population
- 13,046
- Population (ZIP)
- 13,046
Population outlook (Denton County) Hauer SSP2
- Today (2025)
- 1,053,010 people
- By 2030
- 1,192,269 · +13.2%
- By 2040
- 1,472,920 · +39.9%
- By 2050
- 1,746,506 · +65.9%
- By 2075
- 2,358,497 · +124.0%
- By 2100
- 2,779,183 · +163.9%
Race, ethnicity, and origin ACS 2023
- Neighborhood character
- Majority White (62%)
- Race & ethnicity
- White 62% Hispanic / Latino 27% Two or more races 13% Black 6% Asian 3%
- Hispanic origin (detail)
- Mexican 23%
- Common ancestry
- Italian 9% Slovak 2% Serbian 1%
- Foreign-born
- 20% · Canada, South Korea, United Kingdom
- Languages at home
- 73% English-only · Spanish 21% Korean 2% Other Asian/Pacific 1%
Political lean MEDSL · Denton
- 2024 margin
- R (+13.2) · D 42.7% · R 55.8% · Other 1.5%
- 2008→2024 swing
- +11.0pp toward D · 2008: -24.2pp · 2024: -13.2pp
- All cycles
- 2024: R+13.2 2020: R+8.1 2016: R+20.2 2012: R+31.7 2008: R+24.2
Not yet ingested
- Civics
- —
Market trends
- HPI YoY
- ▼ -21.91%
- Current HPI
- 300.0981
- Rent YoY
- —
- Metro
- —
- State GDP YoY
- ▲ 3.95%
- F500 in state
- 110
Industry mix (Fortune 500 HQ in TX)
| Industry | F500 HQs | Revenue |
|---|---|---|
| Energy | 16 | $1,198B |
|
||
| Technology | 5 | $198B |
|
||
| Engineering / Construction | 4 | $72B |
|
||
| Energy Services | 3 | $60B |
|
||
| Utilities | 3 | $41B |
|
||
| Healthcare | 2 | $330B |
|
||
Price history
+99.7% since first listed40 events — show timeline
- 2026-05-08 Price Changed $559,000 NTREIS
- 2026-04-15 Listed $565,000 NTREIS
- 2026-04-01 Listing Removed — NTREIS
- 2026-02-10 Listed $569,900 NTREIS
- 2023-03-23 Sold (Public Records) — Public Records
- 2023-03-22 Sold (MLS) — NTREIS
- 2023-02-20 Pending — NTREIS
- 2023-02-17 Price Changed $554,900 NTREIS
- 2023-02-07 Sold (Public Records) — Public Records
- 2023-01-30 Price Changed $564,900 NTREIS
- 2023-01-19 Price Changed $570,000 NTREIS
- 2023-01-03 Price Changed $575,000 NTREIS
- 2022-12-14 Listed $594,900 NTREIS
- 2022-12-04 Price Changed $594,900 NTREIS
- 2022-11-06 Price Changed $599,900 NTREIS
- 2022-10-06 Price Changed $605,000 NTREIS
- 2022-09-12 Price Changed $615,000 NTREIS
- 2022-09-02 Listing Removed — NTREIS
- 2022-08-29 Listed $629,900 NTREIS
- 2022-07-08 Sold (Public Records) — Public Records
- 2022-06-13 Sold (Public Records) — Public Records
- 2016-01-25 Sold (Public Records) — Public Records
- 2016-01-25 Sold (Public Records) — Public Records
- 2016-01-22 Sold (MLS) — NTREIS
- 2016-01-11 Pending — NTREIS
- 2015-12-07 Contingent — NTREIS
- 2015-11-12 Listed $299,000 NTREIS
- 2015-11-11 Listing Removed — NTREIS
- 2015-09-04 Price Changed $299,000 NTREIS
- 2015-07-28 Relisted — NTREIS
- 2015-07-25 Contingent — NTREIS
- 2015-07-06 Price Changed $309,000 NTREIS
- 2015-06-18 Listed $319,000 NTREIS
- 2015-06-12 Listing Removed — NTREIS
- 2015-04-10 Price Changed $319,000 NTREIS
- 2015-03-24 Listed $329,900 NTREIS
- 2009-07-06 Sold (Public Records) — Public Records
- 2009-06-25 Sold (MLS) — NTREIS
- 2009-05-10 Listing Removed — NTREIS
- 2009-02-16 Listed $279,900 NTREIS
Property tax history
+3.3%/yrLatest (2025): $10,168 · +3.1% YoY. Source: county tax records.
Cash-flow waterfall
monthlySold comps — $/sqft
last 12 mo · ≤1 miLoading sold comps…