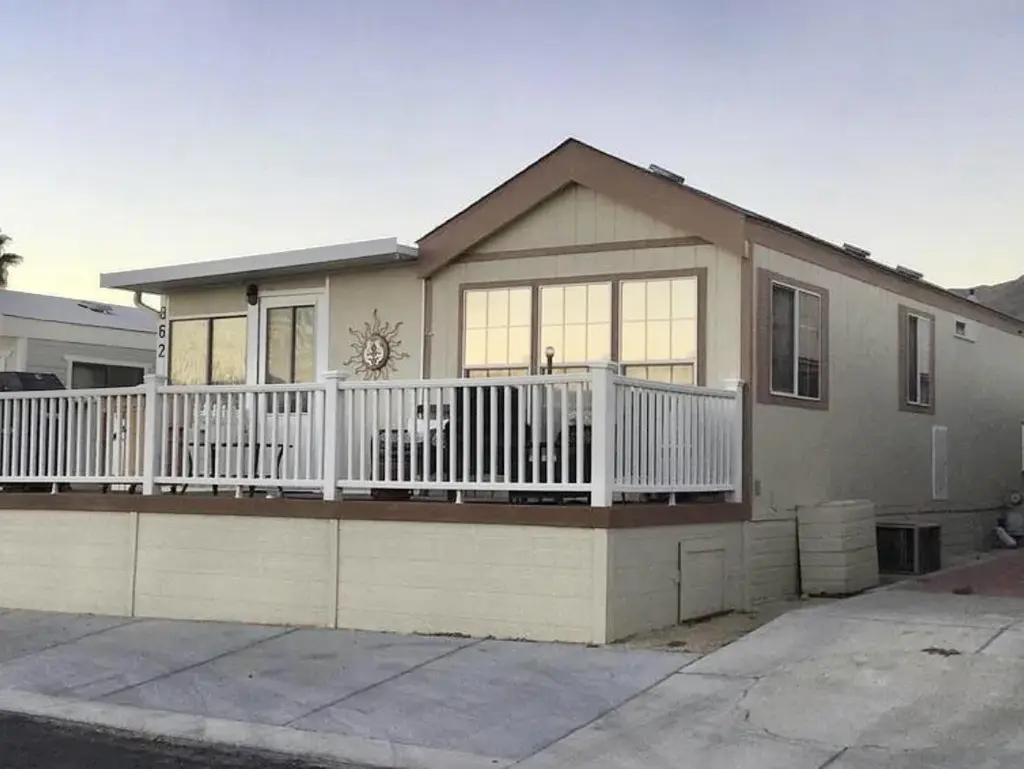
74711 Dillon Rd Spc 862 · Sky Valley, CA
Flood risk 1/10 · Minimal
- FEMA flood zone
- D
- Chance of flooding over 30 yrs
- 0.0%
- Est. flood insurance / yr
- $544 – $1,084
Fire risk 3/10 · Minor
- Est. fire insurance / yr
- $659 – $1,223
Heat risk 8/10 · Major
- Hot days now (above 111°F)
- 7 days/yr
- Hot days in 30 yrs
- 20 days/yr
Wind risk 1/10 · Minimal
- Chance of severe wind over 30 yrs
- —
Air-quality risk 5/10 · Moderate
- Unhealthy air days now
- 6 days/yr
- Unhealthy air days in 30 yrs
- 8 days/yr
Risk factors via First Street. Map © Google.
Why this score? — see what drove the C+ grade
The composite is a weighted blend of 9 inputs, each scored 0–100. Each bar is that input's sub-score; the figure is the points it added to the 100-point composite (weight × sub-score).
- Cash flow +30.0/30.0
- 1% rule +10.0/10.0
- DSCR +10.0/10.0
- Condition / age +2.8/5.0
- Schools +2.7/10.0
- Livability +2.6/5.0
- Rent growth +2.5/5.0
- ARV discount +0.0/15.0
- Appreciation +0.0/10.0
$81,900
🖨 Deal sheet 📄 Offer letter ✓ Due diligence
Listing remarks MLS
ALL AGED PARK! 13 hot spring mineral pools, pickleball, tennis, various activities and events, cafe, chef who delivers dinners and so much more! RARE 2 bedroom park model with extra large California room, divided between living room and 2nd bedroom. Vaulted ceilings, large deck overlooking San Jacinto mountain and sunsets. Shed and fenced yard. LOWEST space rent tier! $683 per month. 760-218-9974 for more info
Key facts
- Large deck
- Tennis
- Fenced yard
Tags
Neighborhood map
What this means for you Summary
Snapshot
- This is a 2-bed/1.0-bath manufactured listed at $82k. Condition is rated average.
Deal economics
- At list price, monthly cash flow is $732 ($9k/yr) — positive.
- The deal already cash-flows at list — no discount required.
- Meets the 1% rule at list price ($2k rent vs $82k).
- Recommended offer: $72k (12.0% below list) — sets the bar for market timing.
- Cap rate 17.0% vs local median 9.6% in Sky Valley — top-decile yield for the area; either an underpriced asset or a hidden risk that comps aren't pricing in. Stress-test before assuming the spread holds.
Location & tenants
- Location reads 52/100 on livability (#1,041 in CA) — a working-class tenant base; expect higher turnover. Strengths: housing A; Watch: schools F, amenities F, commute F.
- Palm Springs Unified (suburban): math 21% / reading 42% proficiency, ranked #328 of 517 in CA (top 63%) — families likely to look elsewhere, expect single-tenant / working-renter base with shorter leases; 73% free/reduced lunch — lower-income household profile, screen leases tightly.
- Market conditions: 216 active listings in the ZIP; 9,195 units permitted in Riverside County in 2024 (1,512 in 5+ unit buildings).
Forward outlook
- Local home prices are declining (-3.0%/yr); year-one equity from $566 of loan paydown is wiped out by about $2k of value loss. Plan a longer hold.
- Riverside County population projected at +22% by 2050 — long-run rental-demand tailwind backs the buy-and-hold thesis.
- At projected returns (-3.0% appreciation + 3.0% rent growth), your $23k cash investment doubles in ~4 years — after that, you're playing with house money.
Negotiation context
- It's been on market 253 days — a 12% lower offer ($72k) is reasonable based on typical stale-listing flexibility.
- 3 sale attempts since 3y ago with the ask held roughly flat each time — persistent listings suggest the price (not the market) is what's stuck; bring a comps-based counter.
Risks & watch-outs
- Climate carrying-cost: extreme-heat days projected 7→20/yr by 2055 (HVAC capex compounding) — expect insurance premiums to compound above CPI over the hold.
Questions for the listing agent
- It's been on market 253 days. Have you received any prior offers? Is the seller open to a 12% concession, seller financing, or rate buy-down credit?
- Why hasn't it sold? Are there any deal-killer items the seller is aware of (foundation, flood, title, zoning, code violations)?
- Is there a deadline driving the sale (1031 exchange, divorce, estate, relocation)? That informs how much negotiation room exists.
- Schools are F-rated, which usually means shorter tenancies and higher turnover. Who's the typical renter profile here, and what's been the actual vacancy rate?
- What's the average days-on-market for RENTAL listings here right now (not sales)? A rising rental-DOM trend means longer vacancies and softer asking-rent achievability than the comps imply.
- What's the recent tenant-quality profile in this submarket — average credit score on applications, eviction rate, late-payment / NSF rate, and stable-employment percentage? A property-management company in the area should have these aggregated.
- How much new for-sale + rental construction is in the pipeline within 1–3 miles? Heavy new supply typically softens prices + rents 12–24 months out; constrained supply supports both.
Investment metrics
- 1% rule
- 2.01% ✓
- Cap rate
- 17.02%
- Cash-on-cash
- 38.31%
- DSCR
- 2.70
- GRM
- 4.2
CMA / ARV
- ARV (median comp)
- $63,000
- List price
- $81,900
- Delta
- 30.00%
- Verdict
- OVERPRICED
- Comps
- 3 within 1.0 mi
Show comp detail 8 sales within ~0.75 mi
| Address | Dist | Beds/Ba | Sqft | Sold | Price | $/sf | Match |
|---|---|---|---|---|---|---|---|
| 74711 Dillon Rd Spc 1004 | 0.00mi | 1/1.5 (-1) | 800 (0%) | 14mo | $75,000 | $94 | 81 |
| 74711 Dillon Rd #713 | 0.00mi | 1/1.5 (-1) | 800 (0%) | 16mo | $74,000 | $93 | 80 |
| 74711 Dillon Rd #183 | 0.00mi | 1/1.0 (-1) | 750 (-6%) | 14mo | $70,000 | $93 | 72 |
| 74711 Dillon Rd #869 | 0.00mi | 2/1.0 | 700 (-12%) | 11mo | $77,500 | $111 | 70 |
| 74711 Dillon Rd #1011 | 0.00mi | 2/1.0 | 700 (-12%) | 16mo | $57,000 | $81 | 66 |
| 74711 Dillon Rd #706 | 0.00mi | 2/1.0 | 700 (-12%) | 18mo | $82,000 | $117 | 64 |
| 74711 Dillon Rd #974 | 0.00mi | 2/1.0 | 683 (-15%) | 14mo | $85,000 | $124 | 64 |
| 74711 Dillon Rd #714 | 0.02mi | 2/2.0 | 700 (-12%) | 18mo | $64,500 | $92 | 60 |
Match score weights: distance 35% · size 25% · config 20% · recency 20%. Top-matched comps best support the ARV.
Projected returns pro-forma
-3.0% appreciation · 3.0% rent growth · sell at horizon
- IRR
- 34.4%
- Equity multiple
- 2.46×
- Total profit
- $33,383
- Equity at exit
- $12,212
- IRR
- 41.3%
- Equity multiple
- 4.89×
- Total profit
- $89,212
- Equity at exit
- $7,081
Cash invested: $22,932 (down + closing). Projections, not guarantees.
Landlord ↔ Tenant lean methodology
- Overall (STATE)
- 18 Strongly Tenant-Friendly
- State California
- 18 Strongly Tenant-Friendly · D+13
- County
- — inherits STATE
- City
- — inherits STATE
ZIP-level market 92241
- Home prices YoY
- -22.8%
- Active inventory
- 216
- Price-to-rent
- 4.2×
Monthly cashflow live
- Estimated rent
- $1,643 medium interval (Pro) →
- Mortgage (P&I)
- −$429
- Tax est. 1.5%
- −$102 /mo · $1,228/yr
- Insurance
- −$34
- HOA
- −$0
- Vacancy / Maint / Mgmt
- −$345
- Net cashflow
- $732
Break-even live
UW: 25.0% down · 7.5% · 30yr · 1.5% tax · 5.0% vac · 8.0% maint · 8.0% mgmt
Financing live
Cash to close
- Down payment
- $20,475
- Closing costs
- $2,457
- Reserves months
- —
- Total cash needed
- —
Loan-product check · same deal, 3 products live
Conventional
25% down · 7.5% · 30yr
- Down + closing
- —
- Monthly P&I
- —
- Monthly cashflow
- —
- DSCR
- —
- Eligible?
- —
Personal DTI + credit; lowest rate.
DSCR
20% down · 8.5% · 30yr
- Down + closing
- —
- Monthly P&I
- —
- Monthly cashflow
- —
- DSCR
- —
- Eligible?
- —
No personal income docs; deal must DSCR.
Hard money
10% down · 12.0% · 12mo
- Down + closing
- —
- Monthly P&I
- —
- Monthly cashflow
- —
- DSCR
- —
- Eligible?
- —
Short-term bridge; refi at stabilization.
Listing history 25 events
-
2026-06-18days on market $81,900 Active 253 DOM
-
2026-06-17days on market $81,900 Active 252 DOM
-
2026-06-16days on market $81,900 Active 251 DOM
-
2026-06-15days on market $81,900 Active 250 DOM
-
2026-06-13days on market $81,900 Active 248 DOM
-
2026-06-13days on market $81,900 Active 247 DOM
-
2026-06-09days on market $81,900 Active 244 DOM
-
2026-06-08days on market $81,900 Active 243 DOM
-
2026-06-07days on market $81,900 Active 242 DOM
-
2026-06-04days on market $81,900 Active 239 DOM
-
2026-06-03days on market $81,900 Active 238 DOM
-
2026-06-02days on market $81,900 Active 237 DOM
-
2026-06-01days on market $81,900 Active 236 DOM
-
2026-05-31days on market $81,900 Active 235 DOM
-
2026-03-20price $81,900 413-char remark
Show marketing remark (413 chars)
ALL AGED PARK! 13 hot spring mineral pools, pickleball, tennis, various activities and events, cafe, chef who delivers dinners and so much more! RARE 2 bedroom park model with extra large California room, divided between living room and 2nd bedroom. Vaulted ceilings, large deck overlooking San Jacinto mountain and sunsets. Shed and fenced yard. LOWEST space rent tier! $683 per month. 760-218-9974 for more info
-
2026-03-20price $65,000 413-char remark
Show marketing remark (413 chars)
ALL AGED PARK! 13 hot spring mineral pools, pickleball, tennis, various activities and events, cafe, chef who delivers dinners and so much more! RARE 2 bedroom park model with extra large California room, divided between living room and 2nd bedroom. Vaulted ceilings, large deck overlooking San Jacinto mountain and sunsets. Shed and fenced yard. LOWEST space rent tier! $683 per month. 760-218-9974 for more info
-
2025-10-06$81,900 Active 413-char remark
Show marketing remark (413 chars)
ALL AGED PARK! 13 hot spring mineral pools, pickleball, tennis, various activities and events, cafe, chef who delivers dinners and so much more! RARE 2 bedroom park model with extra large California room, divided between living room and 2nd bedroom. Vaulted ceilings, large deck overlooking San Jacinto mountain and sunsets. Shed and fenced yard. LOWEST space rent tier! $683 per month. 760-218-9974 for more info
-
2025-06-02historical
-
2025-06-02status Pending
-
2024-08-23price $81,900
-
2024-06-10$87,900 Active
-
2024-05-06historical
-
2024-02-11price $99,900
-
2023-11-28price $102,900
-
2023-11-05$119,000 Active
ⓘ Source: listings_history table (triggers on properties + properties_extension) + one-shot
backfill from property_details.listing_events for pre-trigger history.
Climate risk First Street
- Flood 1/10 Low FEMA zone D · 0% chance over 30 yrs
- Wildfire 3/10 Moderate
- Heat 8/10 Severe 7 d/yr ≥111°F today · 20 d/yr by 30 yrs out
- Wind 1/10 Low
- Air quality 5/10 Major 6 unhealthy d/yr today · 8 by 30 yrs out
Nearby sold comps map
Loading sold comps map…
Walkable amenities ~0.75 mi
Loading nearby amenities…
Taxation est. · year 1
- Rental income
- $19,718
- − Mortgage interest
- −$4,588
- − Property taxes
- −$1,228
- − Insurance
- −$410
- − Repairs & maintenance
- −$1,577
- − Management
- −$1,577
- − Depreciation
- −$2,383
- Taxable income
- $7,955
- Est. tax owed @ 24.0%
- −$1,909
- After-tax cash flow
- $6,876/yr
For passive investors: Depreciation is non-cash, so a rental often shows a tax loss while cash-flowing — sheltering income. Rental losses are passive: they offset passive income freely, and up to $25,000/yr can offset ordinary (W-2) income if you actively participate and your MAGI is under $100k (phasing out to $0 by $150k); unused losses carry forward. On sale, claimed depreciation is recaptured at up to 25%, and gains may owe capital-gains tax (a 1031 exchange can defer both). Figures are a year-1 estimate at your 24.0% rate — not tax advice; consult a CPA.
Condition & rehab AI · 12 photos
This park model has average condition with cosmetic updates needed to enhance its curb appeal and value. The deck and exterior walls could be repainted to improve its appearance and increase its marketability.
Repairs flagged
- Minor Deck — Some wear visible on the deck surface.
Value-add opportunities
- Both Paint exterior walls — Enhances curb appeal and resale value.
- Both Replace deck surface — Improves safety and aesthetics, boosting both resale and rental value.
Renovation cost estimate screening
| Repair item | Severity | Est. cost |
|---|---|---|
| Deck · Some wear visible on the deck surface. | Minor | $500–3,000 |
| Total estimated repair cost · 1 items | $500–3,000 |
Value-add ROI direction
- Both Paint exterior walls — Enhances curb appeal and resale value. ↑
- Both Replace deck surface — Improves safety and aesthetics, boosting both resale and rental value. ↑
ⓘ Cost ranges are severity-bucket heuristics (US national rule-of-thumb). Get contractor quotes + a written scope before underwriting a rehab budget.
Schools (NCES district)
- District
- Palm Springs Unified
- NCES district ID
- 0629550
- Math proficiency
- 21% ▼ -7.00%
- Reading proficiency
- 42% ▬ 0.00%
- Median HH income
- $43,638
- Composite
- 26.76/100
- National rank
- #7131
- State rank
- #328 of 517 in CA
Livability — Sky Valley
- Score
- 52/100
- State rank
- #1041
- US rank
- #25108
Category grades
Schools grade is shown separately in the Schools card above.
Census & demographics
- Census place
- Sky Valley, CA
- Population (ZIP)
- 8,624
Population outlook (Riverside County) Hauer SSP2
- Today (2025)
- 2,664,475 people
- By 2030
- 2,802,692 · +5.2%
- By 2040
- 3,050,904 · +14.5%
- By 2050
- 3,256,783 · +22.2%
- By 2075
- 3,655,058 · +37.2%
- By 2100
- 3,766,594 · +41.4%
Race, ethnicity, and origin ACS 2023
- Race & ethnicity
- White 50% Hispanic / Latino 46% Two or more races 16% Asian 2% Native American 1%
- Hispanic origin (detail)
- Mexican 36%
- Common ancestry
- Lithuanian 3% Slovak 2% Portuguese 2%
- Foreign-born
- 28% · Canada, South Korea
- Languages at home
- 57% English-only · Spanish 38% Chinese 1% Russian/Polish/Slavic 1%
Political lean MEDSL · Riverside
- 2024 margin
- Toss-up / Even · D 48.0% · R 49.3% · Other 2.6%
- 2008→2024 swing
- -3.6pp toward R · 2008: 2.3pp · 2024: -1.3pp
- All cycles
- 2024: R+1.3 2020: D+8.0 2016: D+4.3 2012: R+0.4 2008: D+2.3
Not yet ingested
- Civics
- —
Market trends
- HPI YoY
- ▼ -118.23%
- Current HPI
- 400.5663
- Rent YoY
- —
- Metro
- —
- State GDP YoY
- ▲ 3.21%
- F500 in state
- 116
Industry mix (Fortune 500 HQ in CA)
| Industry | F500 HQs | Revenue |
|---|---|---|
| Technology | 27 | $1,492B |
|
||
| Financial Services | 3 | $174B |
|
||
| Retail | 3 | $44B |
|
||
| Insurance | 3 | $26B |
|
||
| Media / Entertainment | 2 | $115B |
|
||
| Pharmaceuticals / Biotech | 2 | $62B |
|
||
Price history
-31.2% since first listed11 events — show timeline
- 2026-03-20 Price Changed $81,900 GPSMLS
- 2026-03-20 Price Changed $65,000 GPSMLS
- 2025-10-06 Listed $81,900 GPSMLS
- 2025-06-02 Listing Removed — GPSMLS
- 2025-06-02 Pending — GPSMLS
- 2024-08-23 Price Changed $81,900 GPSMLS
- 2024-06-10 Listed $87,900 GPSMLS
- 2024-05-06 Listing Removed — GPSMLS
- 2024-02-11 Price Changed $99,900 GPSMLS
- 2023-11-28 Price Changed $102,900 GPSMLS
- 2023-11-05 Listed $119,000 GPSMLS
Cash-flow waterfall
monthlySold comps — $/sqft
last 12 mo · ≤1 miLoading sold comps…