55 E Riling St Lot 100 · Gwinn, MI
Flood risk No data
- FEMA flood zone
- —
- Chance of flooding over 30 yrs
- —
- Est. flood insurance / yr
- —
Fire risk No data
- Est. fire insurance / yr
- —
Heat risk No data
- Hot days now (above threshold)
- —
- Hot days in 30 yrs
- —
Wind risk No data
- Chance of severe wind over 30 yrs
- —
Air-quality risk No data
- Unhealthy air days now
- —
- Unhealthy air days in 30 yrs
- —
Risk factors via First Street. Map © Google.
Why this score? — see what drove the B grade
The composite is a weighted blend of 9 inputs, each scored 0–100. Each bar is that input's sub-score; the figure is the points it added to the 100-point composite (weight × sub-score).
- Cash flow +30.0/30.0
- DSCR +10.0/10.0
- ARV discount +9.9/15.0
- 1% rule +9.1/10.0
- Condition / age +4.0/5.0
- Livability +3.5/5.0
- Rent growth +2.5/5.0
- Schools +2.0/10.0
- Appreciation +0.0/10.0
$73,750
🖨 Deal sheet 📄 Offer letter ✓ Due diligence
Listing remarks
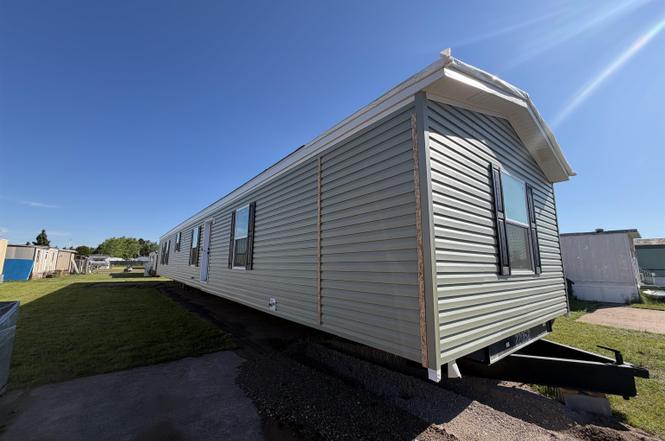
Stop paying rent for something you’ll never own. Own a brand-new 2027, 3-bedroom, 2-bath home. This home offers an open-concept layout, modern finishes, and energy-efficient construction designed for simple, affordable living. Move-in ready with single-level convenience and low maintenance ownership. With approved financing, monthly payments may be comparable to area rental rates. Bonus incentives included: • 3 months of free lot rent • 1-year home warranty If this home isn’t exactly what you’re looking for, ask about the opportunity to customize a new home, choose finishes, and select from available lots within the community. Seller is a licensed real estate
Key facts
- 3 parking spots
- Built 2027
Property features AI
Finance
- Other: Located in Northernaire Mobile Estates, Forsyth Township (mailing city: Gwinn)
- Financial info: Rental amount listed at $325; Pets allowed
- HOA & community: Community amenities include street lights; Pets allowed (dogs and cats); Association fee includes trash removal and water; Association/landlord pays taxes, trash removal, and water/sewer
Exterior
- Parking: Paved driveway with 3 or more parking spaces
- Utilities: Public water; Public sanitary sewer; Electricity connected; Natural gas connected; Cable available; Internet (Spectrum)
- Home design: Single wide manufactured home; Manufactured structure; One-story
- Construction: Built in 2027; Piers foundation
- Exterior features: Vinyl siding; No water features; Located on a base lot; Paved street and private road access
Interior
- Kitchen: Range/Oven; Refrigerator
- Bedrooms: All bedrooms located on the first floor
- Bathrooms: Two full bathrooms
- Heating & cooling: Forced air heating; Natural gas fuel; Electric water heater; 100 amp electric service
- Interior features: Master bedroom with private bath
- Laundry & utility: Basement: Other
Neighborhood map
What this means for you Summary
Snapshot
- This is a 3-bed/2.0-bath manufactured listed at $74k. Condition is rated good.
Deal economics
- At list price, monthly cash flow is $311 ($4k/yr) — positive.
- The deal already cash-flows at list — no discount required.
- Meets the 1% rule at list price ($1k rent vs $74k).
Location & tenants
- Location reads 70/100 on livability (#322 in MI) — a middle-class / working-renter tenant base. Strengths: crime A+, cost of living A+, housing A+; Watch: health & safety C-, schools D+, amenities F.
- Gwinn Area Community Schools (rural): math 16% / reading 30% proficiency, ranked #439 of 540 in MI (top 81%) — low school quality limits family demand, transient renter base, plan for 1-2y turnover.
- Market conditions: 61 active listings in the ZIP; 91 units permitted in Marquette County in 2024 (0 in 5+ unit buildings).
Forward outlook
- Local home prices are declining (-3.0%/yr); year-one equity from $510 of loan paydown is wiped out by about $2k of value loss. Plan a longer hold.
- Marquette County population projected to shrink 3% by 2050 — rents likely to lag national; underwrite the cash flow, not the appreciation.
- At projected returns (-3.0% appreciation + 3.0% rent growth), your $21k cash investment doubles in ~7 years — after that, you're playing with house money.
Negotiation context
- Only 2 days on market — expect competitive offers; lowballing is unlikely to land.
Questions for the listing agent
- Is there a deadline driving the sale (1031 exchange, divorce, estate, relocation)? That informs how much negotiation room exists.
- Schools are D-rated, which usually means shorter tenancies and higher turnover. Who's the typical renter profile here, and what's been the actual vacancy rate?
- What's the average days-on-market for RENTAL listings here right now (not sales)? A rising rental-DOM trend means longer vacancies and softer asking-rent achievability than the comps imply.
- What's the recent tenant-quality profile in this submarket — average credit score on applications, eviction rate, late-payment / NSF rate, and stable-employment percentage? A property-management company in the area should have these aggregated.
- How much new for-sale + rental construction is in the pipeline within 1–3 miles? Heavy new supply typically softens prices + rents 12–24 months out; constrained supply supports both.
Investment metrics
- 1% rule
- 1.41% ✓
- Cap rate
- 11.36%
- Cash-on-cash
- 18.09%
- DSCR
- 1.81
- GRM
- 5.9
CMA / ARV
- ARV (on-the-fly)
- $77,824
- Comps found
- 6
Show comp detail 6 sales within ~0.75 mi
| Address | Dist | Beds/Ba | Sqft | Sold | Price | $/sf | Match |
|---|---|---|---|---|---|---|---|
| 55 E Riling St Lot 92 | 0.00mi | 3/2.0 | 1,120 (-8%) | 1mo | $68,950 | $62 | 86 |
| 55 E Riling St Lot 21 | 0.00mi | 3/2.0 | 1,088 (-10%) | 3mo | $69,500 | $64 | 80 |
| Lot 75 Northernaire Rd | 0.10mi | 3/2.0 | 1,109 (-9%) | 3mo | $41,000 | $37 | 78 |
| 55 E Riling St Lot 82 | 0.00mi | 3/2.0 | 1,088 (-10%) | 6mo | $69,950 | $64 | 77 |
| 55 E Riling St Lot 1 | 0.00mi | 3/2.0 | 1,056 (-13%) | 9mo | $69,000 | $65 | 70 |
| 55 E Riling St Lot 32 | 0.12mi | 3/2.0 | 1,056 (-13%) | 16mo | $67,900 | $64 | 59 |
Match score weights: distance 35% · size 25% · config 20% · recency 20%. Top-matched comps best support the ARV.
Projected returns pro-forma
-3.0% appreciation · 3.0% rent growth · sell at horizon
- IRR
- 9.7%
- Equity multiple
- 1.38×
- Total profit
- $7,894
- Equity at exit
- $10,996
- IRR
- 18.8%
- Equity multiple
- 2.57×
- Total profit
- $32,471
- Equity at exit
- $6,377
Cash invested: $20,650 (down + closing). Projections, not guarantees.
Landlord ↔ Tenant lean methodology
- Overall (STATE)
- 62 Landlord-Friendly
- State Michigan
- 62 Landlord-Friendly · EVEN
- County
- — inherits STATE
- City
- — inherits STATE
ZIP-level market 49841
- Home prices YoY
- -29.0%
- Active inventory
- 61
- Price-to-rent
- 5.9×
Monthly cashflow live
- Estimated rent
- $1,039 medium interval (Pro) →
- Mortgage (P&I)
- −$387
- Tax est. 1.5%
- −$92 /mo · $1,106/yr
- Insurance
- −$31
- HOA
- −$0
- Vacancy / Maint / Mgmt
- −$218
- Net cashflow
- $311
Break-even live
UW: 25.0% down · 7.5% · 30yr · 1.5% tax · 5.0% vac · 8.0% maint · 8.0% mgmt
Financing live
Cash to close
- Down payment
- $18,438
- Closing costs
- $2,212
- Reserves months
- —
- Total cash needed
- —
Loan-product check · same deal, 3 products live
Conventional
25% down · 7.5% · 30yr
- Down + closing
- —
- Monthly P&I
- —
- Monthly cashflow
- —
- DSCR
- —
- Eligible?
- —
Personal DTI + credit; lowest rate.
DSCR
20% down · 8.5% · 30yr
- Down + closing
- —
- Monthly P&I
- —
- Monthly cashflow
- —
- DSCR
- —
- Eligible?
- —
No personal income docs; deal must DSCR.
Hard money
10% down · 12.0% · 12mo
- Down + closing
- —
- Monthly P&I
- —
- Monthly cashflow
- —
- DSCR
- —
- Eligible?
- —
Short-term bridge; refi at stabilization.
Listing history 3 events
-
2026-06-19days on market $73,750 Active 2 DOM
-
2026-06-18remarks 671-char remark
-
2026-06-18$73,750 Active 1 DOM
ⓘ Source: listings_history table (triggers on properties + properties_extension) + one-shot
backfill from property_details.listing_events for pre-trigger history.
Nearby sold comps map
Loading sold comps map…
Walkable amenities ~0.75 mi
Loading nearby amenities…
Taxation est. · year 1
- Rental income
- $12,471
- − Mortgage interest
- −$4,131
- − Property taxes
- −$1,106
- − Insurance
- −$369
- − Repairs & maintenance
- −$998
- − Management
- −$998
- − Depreciation
- −$2,145
- Taxable income
- $2,724
- Est. tax owed @ 24.0%
- −$654
- After-tax cash flow
- $3,082/yr
For passive investors: Depreciation is non-cash, so a rental often shows a tax loss while cash-flowing — sheltering income. Rental losses are passive: they offset passive income freely, and up to $25,000/yr can offset ordinary (W-2) income if you actively participate and your MAGI is under $100k (phasing out to $0 by $150k); unused losses carry forward. On sale, claimed depreciation is recaptured at up to 25%, and gains may owe capital-gains tax (a 1031 exchange can defer both). Figures are a year-1 estimate at your 24.0% rate — not tax advice; consult a CPA.
Condition & rehab AI · 6 photos
This move-in ready manufactured home is in excellent condition with modern finishes and energy-efficient construction. It offers a good return on investment with minimal updates needed to maximize its value.
Value-add opportunities
- Both Paint interior walls — Fresh paint can enhance the home's appearance and value.
- Resale Replace countertops — Granite countertops are durable but can be replaced with quartz or marble for a higher resale value.
- Resale Install new flooring — Hardwood flooring can be replaced with tile or laminate for a more modern look and higher resale value.
- Resale Upgrade appliances — Upgrading to stainless steel or high-end appliances can significantly increase the home's resale value.
- Both Landscaping and curb appeal — Enhancing the landscaping and curb appeal can increase both the resale and rental value of the home.
Renovation cost estimate screening
Value-add ROI direction
- Both Paint interior walls — Fresh paint can enhance the home's appearance and value. ↑
- Resale Replace countertops — Granite countertops are durable but can be replaced with quartz or marble for a higher resale value. ↑
- Resale Install new flooring — Hardwood flooring can be replaced with tile or laminate for a more modern look and higher resale value. ↑
- Resale Upgrade appliances — Upgrading to stainless steel or high-end appliances can significantly increase the home's resale value. ↑
- Both Landscaping and curb appeal — Enhancing the landscaping and curb appeal can increase both the resale and rental value of the home. ↑
ⓘ Cost ranges are severity-bucket heuristics (US national rule-of-thumb). Get contractor quotes + a written scope before underwriting a rehab budget.
Schools (NCES district)
- District
- Gwinn Area Community Schools
- NCES district ID
- 2614690
- Math proficiency
- 16% ▼ -9.00%
- Reading proficiency
- 30% ▼ -4.00%
- Median HH income
- $46,152
- Composite
- 19.98/100
- National rank
- #8670
- State rank
- #439 of 540 in MI
Livability — Gwinn
- Score
- 70/100
- State rank
- #322
- US rank
- #7930
Category grades
Schools grade is shown separately in the Schools card above.
Census & demographics
- Census place
- Gwinn, MI
- Population (ZIP)
- 7,359
Population outlook (Marquette County) Hauer SSP2
- Today (2025)
- 67,278 people
- By 2030
- 67,249 · +-0.0%
- By 2040
- 66,297 · -1.5%
- By 2050
- 65,241 · -3.0%
- By 2075
- 64,365 · -4.3%
- By 2100
- 60,707 · -9.8%
Race, ethnicity, and origin ACS 2023
- Neighborhood character
- Predominantly White (88%)
- Race & ethnicity
- White 88% Two or more races 6% Native American 3% Hispanic / Latino 2% Black 1%
- Common ancestry
- Lithuanian 6% Slovak 3% Romanian 2%
- Foreign-born
- 1%
- Languages at home
- 98% English-only · German/W. Germanic 1% Spanish 1% Other Asian/Pacific 1%
Political lean MEDSL · Marquette
- 2024 margin
- Lean D (+8.7) · D 53.5% · R 44.8% · Other 1.7%
- 2008→2024 swing
- -11.6pp toward R · 2008: 20.3pp · 2024: 8.7pp
- All cycles
- 2024: D+8.7 2020: D+11.2 2016: D+4.2 2012: D+14.1 2008: D+20.3
Not yet ingested
- Civics
- —
Market trends
- HPI YoY
- ▼ -87.41%
- Current HPI
- 214.0389
- Rent YoY
- —
- Metro
- —
- State GDP YoY
- ▲ 1.37%
- F500 in state
- 28
Industry mix (Fortune 500 HQ in MI)
| Industry | F500 HQs | Revenue |
|---|---|---|
| Automotive Parts | 3 | $48B |
|
||
| Automotive | 2 | $372B |
|
||
| Chemicals | 1 | $45B |
|
||
| Automotive Retail | 1 | $29B |
|
||
| Healthcare / Medical Devices | 1 | $23B |
|
||
| Automotive Technology | 1 | $20B |
|
||
Price history
1 event — show timeline
- 2026-06-17 Listed $73,750 MiRealSource-MiMLS
Cash-flow waterfall
monthlySold comps — $/sqft
last 12 mo · ≤1 miLoading sold comps…