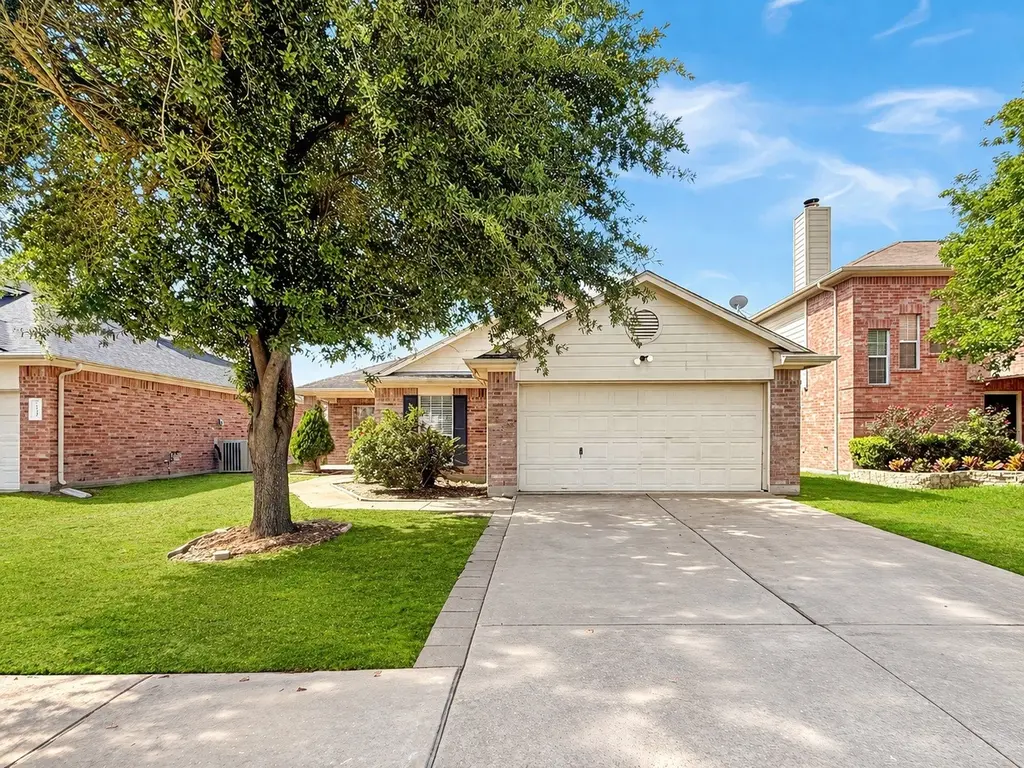
10311 Mills Point Dr · Houston, TX
Flood risk 1/10 · Minimal
- FEMA flood zone
- X (unshaded)
- Chance of flooding over 30 yrs
- 0.0%
- Est. flood insurance / yr
- $507 – $1,088
Fire risk 1/10 · Minimal
- Est. fire insurance / yr
- $1,222 – $2,270
Heat risk 9/10 · Severe
- Hot days now (above 110°F)
- 7 days/yr
- Hot days in 30 yrs
- 23 days/yr
Wind risk 8/10 · Major
- Chance of severe wind over 30 yrs
- 99.0%
Air-quality risk 3/10 · Minor
- Unhealthy air days now
- 2 days/yr
- Unhealthy air days in 30 yrs
- 3 days/yr
Risk factors via First Street. Map © Google.
Why this score? — see what drove the D grade
The composite is a weighted blend of 9 inputs, each scored 0–100. Each bar is that input's sub-score; the figure is the points it added to the 100-point composite (weight × sub-score).
- ARV discount +15.0/15.0
- Cash flow +7.3/30.0
- Schools +4.4/10.0
- 1% rule +3.9/10.0
- Livability +3.7/5.0
- Rent growth +2.7/5.0
- Condition / age +2.5/5.0
- DSCR +1.5/10.0
- Appreciation +0.0/10.0
$199,999
🖨 Deal sheet (PDF) 📄 Offer letter ✓ Due diligence
Listing remarks MLS
Location!!! The home presents an open floor plan from the kitchen to the living room. The entrance has a spacious dining area that can also be used as a second living room. The property is sold As-Is, Where-Is. Seller has no knowledge, buyer should perform their due diligence and make their own assessments. To help visualize this homes floor plan and to highlight its potential virtual furnishings may have been added to photos found in this listing.
Key facts
- Open floor plan
- Spacious dining area
- 5,248 sq ft lot
Tags
Neighborhood map
What this means for you Summary
Snapshot
- This is a 3-bed/2.0-bath single-family listed at $200k.
Deal economics
- At list price, monthly cash flow is $-264 ($-3k/yr) — negative.
- To cash-flow at today's rent, offer at most $153k (23.3% below list).
- To meet the 1% rule (rent ≥ 1% of price), the offer needs to be $177k (11.4% below list).
- Recommended offer: $153k (23.3% below list) — sets the bar for cash-flow.
- Cap rate 4.7% vs local median 3.2% in Houston — top-decile yield for the area; either an underpriced asset or a hidden risk that comps aren't pricing in. Stress-test before assuming the spread holds.
Location & tenants
- Location reads 74/100 on livability (#184 in TX, #4,771 nationally) — a middle-class / working-renter tenant base. Strengths: amenities A+, cost of living A+, housing A+; Watch: crime F.
- Cypress-Fairbanks ISD (suburban): math 45% / reading 52% proficiency, ranked #161 of 826 in TX (top 20%) — families likely to look elsewhere, expect single-tenant / working-renter base with shorter leases.
- Zoned schools: Hancock El (math 20% / reading 33%, grade F, #2,927 of 4,322 statewide, top 68%, 965 students, 78% FRL); Bleyl Middle (math 35% / reading 45%, grade F, #646 of 1,662 statewide, top 40%, 1,451 students, 72% FRL); Cypress-Fairbanks J J A E P (12 students, 0% FRL).
- Zoned-school proficiency averages 33% at this address vs 48% district-wide (-15 pts) — the specific schools serving this property underperform the Cypress-Fairbanks ISD average; the district grade overstates school quality for this exact location.
- Market conditions: Rents flat; 242 active listings in the ZIP; 40 comparable units currently listed for rent nearby; rentals leasing fast (median 8d on market — plan ~1-2 weeks tenant-placement turnaround); solid renter incomes; 29,883 units permitted in Harris County in 2024 (8,621 in 5+ unit buildings).
Forward outlook
- Local home prices are declining (-3.0%/yr); year-one equity from $1k of loan paydown is wiped out by about $6k of value loss. Plan a longer hold.
- Harris County population projected at +47% by 2050 — long-run rental-demand tailwind backs the buy-and-hold thesis.
Negotiation context
- It's been on market 74 days — a 6% lower offer ($188k) is reasonable based on typical stale-listing flexibility.
Risks & watch-outs
- Watch-outs: property tax is 3.0% of price.
- Climate carrying-cost: severe wind risk, 99% chance of damaging wind over 30y; extreme-heat days projected 7→23/yr by 2055 (HVAC capex compounding) — expect insurance premiums to compound above CPI over the hold.
Questions for the listing agent
- What do current leases actually rent for vs. the listed asking? Can we see a recent rent roll and the last 12 months of T-12 income?
- It's been on market 74 days. Have you received any prior offers? Is the seller open to a 23% concession, seller financing, or rate buy-down credit?
- Property tax is high relative to price — has the assessment been appealed recently, and will the sale trigger a re-assessment?
- What does the HOA fee cover, when was the last increase, and are there any pending special assessments or reserve-fund shortfalls?
- Why hasn't it sold? Are there any deal-killer items the seller is aware of (foundation, flood, title, zoning, code violations)?
- Is there a deadline driving the sale (1031 exchange, divorce, estate, relocation)? That informs how much negotiation room exists.
- Schools are D-rated, which usually means shorter tenancies and higher turnover. Who's the typical renter profile here, and what's been the actual vacancy rate?
- Crime grade is F in this area — have there been break-ins, vandalism, or insurance claims at this property in the last 3 years? What carrier currently insures it and at what premium?
- The area grade is low — what's the realistic commute time and amenity access for the typical tenant pool here? Any planned neighborhood developments (good or bad) we should know about?
- What's the average days-on-market for RENTAL listings here right now (not sales)? A rising rental-DOM trend means longer vacancies and softer asking-rent achievability than the comps imply.
- What's the recent tenant-quality profile in this submarket — average credit score on applications, eviction rate, late-payment / NSF rate, and stable-employment percentage? A property-management company in the area should have these aggregated.
- How much new for-sale + rental construction is in the pipeline within 1–3 miles? Heavy new supply typically softens prices + rents 12–24 months out; constrained supply supports both.
Investment metrics
- 1% rule
- 0.89% ✗
- Cap rate
- 4.71%
- Cash-on-cash
- -5.66%
- DSCR
- 0.75
- GRM
- 9.4
CMA / ARV
- ARV (median comp)
- $244,296
- List price
- $199,999
- Delta
- -18.13%
- Verdict
- UNDERPRICED
- Comps
- 20 within 1.0 mi
Show comp detail 12 sales within ~0.75 mi
| Address | Dist | Beds/Ba | Sqft | Sold | Price | $/sf | Match |
|---|---|---|---|---|---|---|---|
| 10215 Riderdale Park Ln | 0.21mi | 3/2.0 | 1,614 (+3%) | 3mo | $289,000 | $179 | 83 |
| 10123 Appleridge Dr | 0.36mi | 3/2.0 | 1,595 (+2%) | 2mo | $229,900 | $144 | 79 |
| 12602 Hickory Bend Dr | 0.31mi | 3/2.0 | 1,496 (-5%) | 3mo | $230,000 | $154 | 75 |
| 13038 Bramford Point Ln | 0.32mi | 3/2.0 | 1,635 (+4%) | 4mo | $265,000 | $162 | 75 |
| 10206 Hillmere | 0.38mi | 3/2.0 | 1,598 (+2%) | 9mo | $280,000 | $175 | 72 |
| 13014 Bramford Point Ln | 0.26mi | 3/2.0 | 1,440 (-8%) | 5mo | $265,000 | $184 | 70 |
| 12703 Autumn Mill Dr | 0.28mi | 3/2.0 | 1,682 (+7%) | 7mo | $239,500 | $142 | 69 |
| 12626 Lacey Crest Dr | 0.30mi | 3/2.0 | 1,394 (-11%) | 8mo | $193,000 | $138 | 61 |
| 13203 Akron Oak St | 0.35mi | 3/2.0 | 1,402 (-11%) | 6mo | $250,000 | $178 | 61 |
| 12626 Duchess Ln | 0.40mi | 3/2.0 | 1,731 (+10%) | 5mo | $299,999 | $173 | 60 |
| 12826 Regal Pine Ln | 0.51mi | 3/2.0 | 1,717 (+10%) | 0mo | $269,900 | $157 | 60 |
| 12627 Autumn Mill Dr | 0.34mi | 3/2.0 | 1,344 (-14%) | 6mo | $209,900 | $156 | 55 |
Match score weights: distance 35% · size 25% · config 20% · recency 20%. Top-matched comps best support the ARV.
Projected returns pro-forma
-3.0% appreciation · 0.91% rent growth · sell at horizon
- IRR
- -28.8%
- Equity multiple
- 0.06×
- Total profit
- $-52,688
- Equity at exit
- $29,821
- IRR
- -42.5%
- Equity multiple
- -0.45×
- Total profit
- $-81,101
- Equity at exit
- $17,292
Cash invested: $56,000 (down + closing). Projections, not guarantees.
Landlord ↔ Tenant lean methodology
- Overall (STATE)
- 87 Strongly Landlord-Friendly
- State Texas
- 87 Strongly Landlord-Friendly · R+5
- County
- — inherits STATE
- City
- — inherits STATE
ZIP-level market 77070
- Rents YoY
- 0.9%
- Active inventory
- 242
- Price-to-rent
- 9.4×
Monthly cashflow live
- Estimated rent
- $1,772 high interval (Pro) →
- Mortgage (P&I)
- −$1,049
- Tax from tax record
- −$496 /mo · $5,952/yr
- Insurance
- −$83
- HOA
- −$36
- Lot rent
- −$0
- Vacancy / Maint / Mgmt
- −$372
- Net cashflow
- $-264
Break-even live
Sensitivity live
| Price | -10% $-151 | -5% $-208 | +0% $-264 | +5% $-321 | +10% $-377 |
|---|---|---|---|---|---|
| Rent | -10% $-404 | -5% $-334 | +0% $-264 | +5% $-194 | +10% $-124 |
| Rate | -1.0pp $-164 | -0.5pp $-213 | base $-264 | +0.5pp $-316 | +1.0pp $-369 |
UW: 25.0% down · 7.5% · 30yr · 1.5% tax · 5.0% vac · 8.0% maint · 8.0% mgmt
Financing live
Cash to close
- Down payment
- $50,000
- Closing costs
- $6,000
- Reserves months
- —
- Total cash needed
- —
Loan-product check · same deal, 3 products live
Conventional
25% down · 7.5% · 30yr
- Down + closing
- —
- Monthly P&I
- —
- Monthly cashflow
- —
- DSCR
- —
- Eligible?
- —
Personal DTI + credit; lowest rate.
DSCR
20% down · 8.5% · 30yr
- Down + closing
- —
- Monthly P&I
- —
- Monthly cashflow
- —
- DSCR
- —
- Eligible?
- —
No personal income docs; deal must DSCR.
Hard money
10% down · 12.0% · 12mo
- Down + closing
- —
- Monthly P&I
- —
- Monthly cashflow
- —
- DSCR
- —
- Eligible?
- —
Short-term bridge; refi at stabilization.
Rent comps 40 comps
| Address | Beds | Baths | Sqft | Rent | $/sqft | DOM | Units | Dist |
|---|---|---|---|---|---|---|---|---|
| 12627 Day Hollow Ln Houston, TX | 3.0 | 2.0 | 1384 | $1,750 | $1.26 | 0d | 1 | 0.29mi |
| 10610 Mills Way Houston, TX | 4.0 | 2.5 | 1921 | $2,425 | $1.26 | 26d | 1 | 0.46mi |
| 12856 Perry Rd Houston, TX | 3.0 | 2.0 | 1211 | $1,780 | $1.47 | 26d | 1 | 0.50mi |
| 12850 Perry Rd Houston, TX | 1.0–3.0 | 1.0–2.0 | 1141 | $2,149 | $1.88 | 0d | 35 | 0.55mi |
| 13030 Perry Rd Houston, TX | 1.0–3.0 | 1.0–2.0 | 935 | $1,825 | $1.95 | 4d | 32 | 0.60mi |
| 9617 Grant Rd Houston, TX | 2.0 | 2.0 | 1332 | $1,455 | $1.09 | 46d | 1 | 0.64mi |
| 12210 Ferncrest Ct Houston, TX | 3.0 | 2.0 | 1793 | $2,200 | $1.23 | 46d | 1 | 0.64mi |
| 12534 Blinnwood Ln Houston, TX | 3.0 | 2.0 | 1812 | $2,080 | $1.15 | 0d | 1 | 0.66mi |
| 12619 Aubreywood Ln Houston, TX | 4.0 | 2.0 | 2187 | $2,205 | $1.01 | 7d | 1 | 0.74mi |
| 13611 Perry Rd Houston, TX | 1.0–2.0 | 1.0–2.0 | 916 | $1,727 | $1.89 | 1d | 38 | 0.75mi |
| 9611 Grant Rd Unit 9668 Houston, TX | 2.0 | 2.0 | 1332 | $1,460 | $1.10 | 46d | 1 | 0.77mi |
| 9611 Grant Rd Unit 2162 Houston, TX | 2.0 | 2.0 | 1332 | $1,465 | $1.10 | 7d | 1 | 0.77mi |
| 9611 Grant Rd Unit 9648 Houston, TX | 2.0 | 2.0 | 1332 | $1,489 | $1.12 | 12d | 1 | 0.77mi |
| 9611 Grant Rd Unit 422 Houston, TX | 2.0 | 2.0 | 1332 | $1,465 | $1.10 | 9d | 1 | 0.77mi |
| 9611 Grant Rd Unit 2148 Houston, TX | 2.0 | 2.0 | 1332 | $1,449 | $1.09 | 1d | 1 | 0.77mi |
| 9611 Grant Rd Unit 2165 Houston, TX | 2.0 | 2.0 | 1332 | $1,500 | $1.13 | 0d | 1 | 0.79mi |
| 11907 Cedarcliff Dr Houston, TX | 4.0 | 2.0 | 2087 | $1,806 | $0.87 | 46d | 1 | 0.91mi |
| 11111 Saathoff Dr Cypress, TX | 1.0–2.0 | 1.0–2.0 | 849 | $1,344 | $1.58 | 1d | 16 | 0.93mi |
| 13101 Jones Rd Houston, TX | 2.0–3.0 | 2.0 | 1024 | $1,437 | $1.40 | 46d | 3 | 0.96mi |
| 11131 Saathoff Dr Cypress, TX | 2.0 | 2.0 | 1092 | $1,500 | $1.37 | 46d | 1 | 0.97mi |
| 10325 Cypresswood Dr Houston, TX | 1.0–3.0 | 1.0–2.0 | 996 | $2,155 | $2.16 | 1d | 35 | 1.04mi |
| 13802 Napoli Dr Houston, TX | 1.0–2.0 | 1.0–2.0 | 852 | $1,990 | $2.34 | 1d | 37 | 1.07mi |
| 13801 Napoli Dr Houston, TX | 1.0–2.0 | 1.0–2.0 | 964 | $1,602 | $1.66 | 0d | 35 | 1.09mi |
| 11111 Grant Rd Unit 3112 Cypress, TX | 3.0 | 2.0 | 1368 | $1,824 | $1.33 | 0d | 1 | 1.13mi |
| 11111 Grant Rd Unit 11144 Cypress, TX | 3.0 | 2.0 | 1368 | $1,813 | $1.33 | 12d | 1 | 1.13mi |
| 19407 Tomball Pkwy Houston, TX | 2.0 | 2.0 | 1070 | $1,450 | $1.36 | 26d | 1 | 1.13mi |
| 19401 Tomball Pkwy Houston, TX | 1.0–2.0 | 1.0–2.0 | 954 | $1,786 | $1.87 | 1d | 26 | 1.13mi |
| 19433 Tomball Pkwy Unit 1128 Houston, TX | 2.0 | 2.0 | 1368 | $1,198 | $0.88 | 46d | 1 | 1.14mi |
| 11925 Jones Rd Houston, TX | 2.0 | 2.0 | 1126 | $1,735 | $1.54 | 46d | 1 | 1.16mi |
| 11300 Regency Green Dr Cypress, TX | 1.0–2.0 | 1.0–2.0 | 947 | $1,564 | $1.65 | 1d | 35 | 1.16mi |
| 11925 Jones Rd Unit 424 Houston, TX | 2.0 | 2.0 | 1126 | $1,675 | $1.49 | 7d | 1 | 1.17mi |
| 11925 Jones Rd Unit 2174 Houston, TX | 2.0 | 2.0 | 1126 | $1,700 | $1.51 | 1d | 1 | 1.17mi |
| 11925 Jones Rd Unit 422 Houston, TX | 2.0 | 2.0 | 1126 | $1,675 | $1.49 | 9d | 1 | 1.17mi |
| 11925 Jones Rd Unit 11962 Houston, TX | 2.0 | 2.0 | 1126 | $1,615 | $1.43 | 46d | 1 | 1.17mi |
| 10300 Cypresswood Dr Houston, TX | 1.0–2.0 | 1.0–2.0 | 902 | $1,768 | $1.96 | 0d | 38 | 1.17mi |
| 13920 Mandolin Dr Houston, TX | 1.0–2.0 | 1.0–2.0 | 881 | $1,821 | $2.07 | 1d | 25 | 1.22mi |
| 11925 Jones Rd Unit 11948 Houston, TX | 2.0 | 2.0 | 1126 | $1,699 | $1.51 | 12d | 1 | 1.22mi |
| 11925 Jones Rd Unit 2112 Houston, TX | 2.0 | 2.0 | 1126 | $1,710 | $1.52 | 0d | 1 | 1.22mi |
| 11920 Jansells Crossing Dr Houston, TX | 2.0 | 2.0 | 1126 | $1,449 | $1.29 | 26d | 1 | 1.24mi |
| 10903 Cypresswood Dr Houston, TX | 2.0 | 2.0 | 1053 | $1,793 | $1.70 | 26d | 1 | 1.27mi |
HOA detail
- Monthly dues
- $36 · $432/yr
Listing history 19 events
-
2026-06-22days on market $199,999 Pending 74 DOM
-
2026-06-21days on market $199,999 Pending 73 DOM
-
2026-06-18days on market $199,999 Pending 70 DOM
-
2026-06-17days on market $199,999 Pending 69 DOM
-
2026-06-16days on market $199,999 Pending 68 DOM
-
2026-06-15days on market $199,999 Pending 67 DOM
-
2026-06-13days on market $199,999 Pending 65 DOM
-
2026-06-13statusdays on market $199,999 Pending 64 DOM
-
2026-06-09days on market $199,999 Active 61 DOM
-
2026-06-08days on market $199,999 Active 60 DOM
-
2026-06-07days on market $199,999 Active 59 DOM
-
2026-06-04days on market $199,999 Active 56 DOM
-
2026-06-03pricedays on market $199,999 Active 55 DOM
-
2026-06-02days on market $220,000 Active 54 DOM
-
2026-06-02days on market $220,000 Active 53 DOM
-
2026-05-31days on market $220,000 Active 52 DOM
-
2026-05-08price $220,000 452-char remark
Show marketing remark (452 chars)
Location!!! The home presents an open floor plan from the kitchen to the living room. The entrance has a spacious dining area that can also be used as a second living room. The property is sold As-Is, Where-Is. Seller has no knowledge, buyer should perform their due diligence and make their own assessments. To help visualize this homes floor plan and to highlight its potential virtual furnishings may have been added to photos found in this listing.
-
2026-04-09$230,000 Active 452-char remark
Show marketing remark (452 chars)
Location!!! The home presents an open floor plan from the kitchen to the living room. The entrance has a spacious dining area that can also be used as a second living room. The property is sold As-Is, Where-Is. Seller has no knowledge, buyer should perform their due diligence and make their own assessments. To help visualize this homes floor plan and to highlight its potential virtual furnishings may have been added to photos found in this listing.
-
2024-03-14soldstatus
ⓘ Source: listings_history table (triggers on properties + properties_extension) + one-shot
backfill from property_details.listing_events for pre-trigger history.
Tax reassessment forecast TX · Resets to sale price
- Current annual tax
- $5,952 · $496/mo
- Projected year-2 tax
- $5,952 · $496/mo
- Expected delta
- $0/yr ($0/mo · 0.0%)
ⓘ Screening estimate from a state-policy table — verify with the county assessor before closing.
Climate risk First Street
- Flood 1/10 Low FEMA zone X (unshaded) · 0% chance over 30 yrs
- Wildfire 1/10 Low
- Heat 9/10 Extreme 7 d/yr ≥110°F today · 23 d/yr by 30 yrs out
- Wind 8/10 Severe 99% chance of damaging wind over 30 yrs
- Air quality 3/10 Moderate 2 unhealthy d/yr today · 3 by 30 yrs out
Nearby sold comps map
Loading sold comps map…
Walkable amenities ~0.75 mi
Loading nearby amenities…
Taxation est. · year 1
- Rental income
- $21,264
- − Mortgage interest
- −$11,203
- − Property taxes
- −$5,952
- − Insurance
- −$1,000
- − Repairs & maintenance
- −$1,701
- − Management
- −$1,701
- − HOA
- −$432
- − Depreciation
- −$5,818
- Taxable loss
- −$6,543
- Est. tax savings @ 24.0%
- +$1,570
- After-tax cash flow
- $-1,600/yr
For passive investors: Depreciation is non-cash, so a rental often shows a tax loss while cash-flowing — sheltering income. Rental losses are passive: they offset passive income freely, and up to $25,000/yr can offset ordinary (W-2) income if you actively participate and your MAGI is under $100k (phasing out to $0 by $150k); unused losses carry forward. On sale, claimed depreciation is recaptured at up to 25%, and gains may owe capital-gains tax (a 1031 exchange can defer both). Figures are a year-1 estimate at your 24.0% rate — not tax advice; consult a CPA.
Schools (NCES district)
- District
- Cypress-Fairbanks ISD
- NCES district ID
- 4816110
- Math proficiency
- 45% ▼ -12.00%
- Reading proficiency
- 52% ▼ -2.00%
- Median HH income
- $72,025
- Composite
- 43.63/100
- National rank
- #2968
- State rank
- #161 of 826 in TX
Livability — Houston
- Score
- 74/100
- State rank
- #184
- US rank
- #4771
Category grades
Schools grade is shown separately in the Schools card above.
Census & demographics
- County
- Harris County · 4,702,590 people
- City population
- 3,226,434
- Metro
- Houston-The Woodlands-Sugar Land, TX
- Population (ZIP)
- 58,229
- Household income
- $77,397
- Rent vs Own
- Severe rent burden
- 2924.0
Population outlook (Harris County) Hauer SSP2
- Today (2025)
- 5,571,493 people
- By 2030
- 6,089,821 · +9.3%
- By 2040
- 7,142,806 · +28.2%
- By 2050
- 8,185,864 · +46.9%
- By 2075
- 10,574,329 · +89.8%
- By 2100
- 12,109,958 · +117.4%
Race, ethnicity, and origin ACS 2023
- Neighborhood character
- Highly diverse neighborhood (Simpson 0.73)
- Race & ethnicity
- White 35% Hispanic / Latino 31% Black 19% Two or more races 16% Asian 11% Native American 1%
- Hispanic origin (detail)
- Mexican 20% Cuban 1%
- Common ancestry
- Lithuanian 2% Slovak 1% Romanian 1%
- Foreign-born
- 23% · Canada, Vietnam, Jamaica
- Languages at home
- 64% English-only · Spanish 24% Vietnamese 4% Other Indo-European 2%
Political lean MEDSL · Harris
- 2024 margin
- Lean D (+5.5) · D 52.0% · R 46.4% · Other 1.6%
- 2008→2024 swing
- +3.9pp toward D · 2008: 1.6pp · 2024: 5.5pp
- All cycles
- 2024: D+5.5 2020: D+13.3 2016: D+12.4 2012: D+0.1 2008: D+1.6
Not yet ingested
- Civics
- —
Market trends
- HPI YoY
- ▼ -130.95%
- Current HPI
- 232.3128
- Rent YoY
- ▲ 0.91%
- Metro
- Houston-The Woodlands-Sugar Land, TX
- State GDP YoY
- ▲ 3.95%
- F500 in state
- 110
Industry mix (Fortune 500 HQ in TX)
| Industry | F500 HQs | Revenue |
|---|---|---|
| Energy | 16 | $1,198B |
|
||
| Technology | 5 | $198B |
|
||
| Engineering / Construction | 4 | $72B |
|
||
| Energy Services | 3 | $60B |
|
||
| Utilities | 3 | $41B |
|
||
| Healthcare | 2 | $330B |
|
||
Price history
-4.3% since first listed3 events — show timeline
- 2026-05-08 Price Changed $220,000 HARMLS
- 2026-04-09 Listed $230,000 HARMLS
- 2024-03-14 Sold (Public Records) — Public Records
Property tax history
+2.0%/yrLatest (2025): $5,952 · +3.4% YoY. Source: county tax records.
Cash-flow waterfall
monthlySold comps — $/sqft
last 12 mo · ≤1 miLoading sold comps…