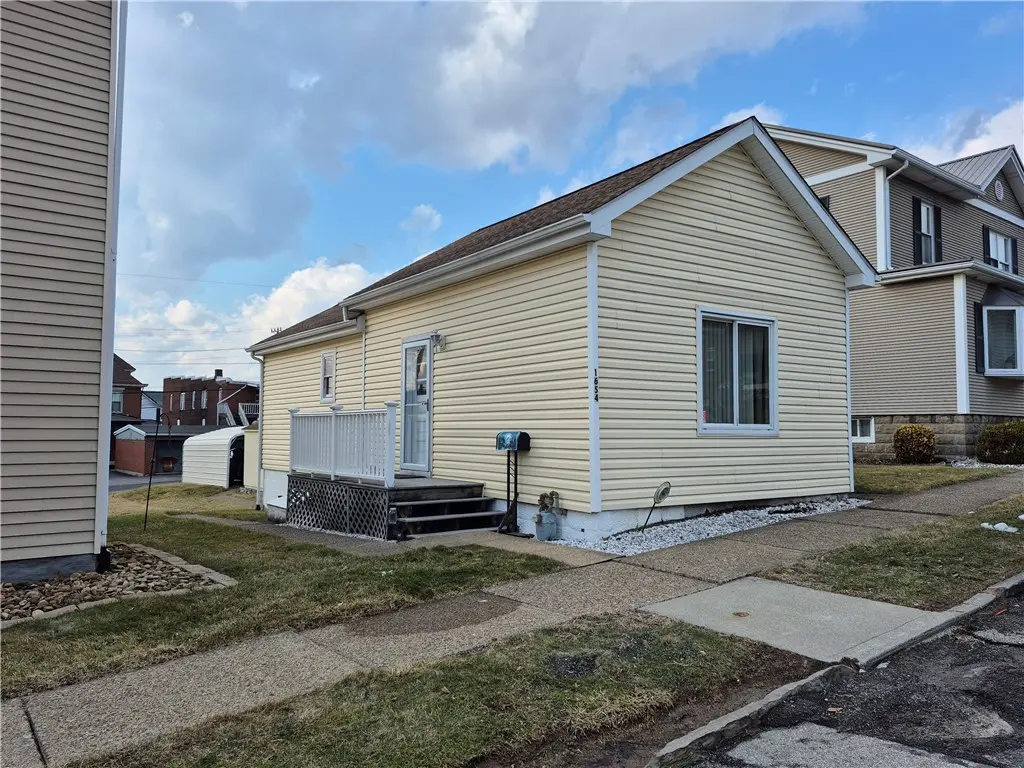
1654 Poplar St · South Greensburg, PA
Flood risk 1/10 · Minimal
- FEMA flood zone
- X (unshaded)
- Chance of flooding over 30 yrs
- 0.0%
- Est. flood insurance / yr
- $507 – $1,088
Fire risk 1/10 · Minimal
- Est. fire insurance / yr
- $511 – $949
Heat risk 4/10 · Minor
- Hot days now (above 96°F)
- 7 days/yr
- Hot days in 30 yrs
- 18 days/yr
Wind risk 2/10 · Minimal
- Chance of severe wind over 30 yrs
- —
Air-quality risk 3/10 · Minor
- Unhealthy air days now
- 2 days/yr
- Unhealthy air days in 30 yrs
- 3 days/yr
Risk factors via First Street. Map © Google.
Why this score? — see what drove the C+ grade
The composite is a weighted blend of 9 inputs, each scored 0–100. Each bar is that input's sub-score; the figure is the points it added to the 100-point composite (weight × sub-score).
- Cash flow +25.0/30.0
- DSCR +8.1/10.0
- ARV discount +7.5/15.0
- 1% rule +6.0/10.0
- Rent growth +4.5/5.0
- Livability +3.6/5.0
- Schools +3.5/10.0
- Condition / age +2.5/5.0
- Appreciation +0.0/10.0
$79,900
🖨 Deal sheet 📄 Offer letter ✓ Due diligence
Listing remarks
Attention Renters!! Own your own Maintenance Free one bedroom Ranch home on level lot in a quiet South Greensburg neighborhood for less than rent!!! This "Cute and Cozy" one level home is featuring Eat in kitchen, Thermopane windows, Main level Laundry/ bath, Trex decking on porch and large shed with loft for extra storage. The level lot extends to the alley where the carport is located. There is also on street parking. The basement has glass block window, sump pump and additional storage. All appliances are included. Move-In ready!! Minutes from Route 119, Route 30, and all major roads.
Key facts
- Large shed with loft
- Eat in kitchen
- Level lot
Tags
Property features AI
Finance
- HOA & community: Public transportation nearby
Exterior
- Parking: Covered parking for 1 vehicle
- Utilities: Public water; Public sewer
- Home design: Single-story home; Resale property
- Construction: Vinyl siding; Asphalt roof
- Exterior features: 36 x 110 lot dimensions
Interior
- Kitchen: Kitchen on main level; Stove; Microwave; Refrigerator
- Bedrooms: Total rooms: 4 (includes living room, kitchen, laundry and one additional room)
- Flooring: Laminate flooring; Vinyl flooring; Carpet
- Bathrooms: 1 full bathroom
- Heating & cooling: Forced air heating (gas); Central air conditioning
- Interior features: Multi-pane windows; Window treatments
- Laundry & utility: Main-level laundry; Washer; Dryer; Some electric appliances
Neighborhood map
What this means for you Summary
Snapshot
- This is a 1-bed/1.0-bath other listed at $80k.
Deal economics
- At list price, monthly cash flow is $173 ($2k/yr) — positive.
- The deal already cash-flows at list — no discount required.
- Meets the 1% rule at list price ($880 rent vs $80k).
- Recommended offer: $78k (3.0% below list) — sets the bar for market timing.
Location & tenants
- Location reads 72/100 on livability (#612 in PA) — a middle-class / working-renter tenant base. Strengths: cost of living A+, housing A+, crime A; Watch: health & safety D, amenities F, commute F.
- Greensburg Salem SD (suburban): math 31% / reading 52% proficiency, ranked #346 of 539 in PA (top 64%) — families likely to look elsewhere, expect single-tenant / working-renter base with shorter leases.
- Market conditions: Rents rising fast (+8.0%/yr); 291 active listings in the ZIP; 2 comparable units currently listed for rent nearby; solid renter incomes; 415 units permitted in Westmoreland County in 2024 (10 in 5+ unit buildings).
- This rent is only 13% of the median local income ($79k/yr) — well below the 30% rent-burden line; pricing power to push rent on renewal without tenant pushback.
Forward outlook
- Local home prices are declining (-3.0%/yr); year-one equity from $552 of loan paydown is wiped out by about $2k of value loss. Plan a longer hold.
- Westmoreland County population projected at -19% by 2050 — secular population decline; favor cash flow + early exit over multi-decade hold.
- At projected returns (-3.0% appreciation + 8.0% rent growth), your $22k cash investment doubles in ~8 years — after that, you're playing with house money.
Negotiation context
- It's been on market 41 days — a 3% lower offer ($78k) is reasonable based on typical stale-listing flexibility.
- Current owner paid $21k; list at $80k implies a 278% gain — meaningful room to come down on a strong offer.
Risks & watch-outs
- Watch-outs: built in 1910 — expect roof / HVAC / electrical / plumbing capex.
Questions for the listing agent
- It's been on market 41 days. Have you received any prior offers? Is the seller open to a 3% concession, seller financing, or rate buy-down credit?
- Built in 1910 — when were the roof, HVAC, electrical panel, plumbing, and water heater last replaced?
- Is there a deadline driving the sale (1031 exchange, divorce, estate, relocation)? That informs how much negotiation room exists.
- Schools are B-rated — typically a magnet for longer-tenancy family renters. What's the average tenant stay here, and is there a school-zone premium baked into asking?
- What's the average days-on-market for RENTAL listings here right now (not sales)? A rising rental-DOM trend means longer vacancies and softer asking-rent achievability than the comps imply.
- What's the recent tenant-quality profile in this submarket — average credit score on applications, eviction rate, late-payment / NSF rate, and stable-employment percentage? A property-management company in the area should have these aggregated.
- How much new for-sale + rental construction is in the pipeline within 1–3 miles? Heavy new supply typically softens prices + rents 12–24 months out; constrained supply supports both.
Investment metrics
- 1% rule
- 1.10% ✓
- Cap rate
- 8.89%
- Cash-on-cash
- 9.27%
- DSCR
- 1.41
- GRM
- 7.6
CMA / ARV
No comps found within radius.
Projected returns pro-forma
-3.0% appreciation · 7.95% rent growth · sell at horizon
- IRR
- 2.9%
- Equity multiple
- 1.12×
- Total profit
- $2,657
- Equity at exit
- $11,913
- IRR
- 16.6%
- Equity multiple
- 2.67×
- Total profit
- $37,381
- Equity at exit
- $6,908
Cash invested: $22,372 (down + closing). Projections, not guarantees.
Landlord ↔ Tenant lean methodology
- Overall (STATE)
- 62 Landlord-Friendly
- State Pennsylvania
- 62 Landlord-Friendly · EVEN
- County
- — inherits STATE
- City
- — inherits STATE
ZIP-level market 15601
- Rents YoY
- 8.0%
- Active inventory
- 291
- Price-to-rent
- 7.6×
Monthly cashflow live
- Estimated rent
- $880 medium interval (Pro) →
- Mortgage (P&I)
- −$419
- Tax from tax record
- −$70 /mo · $836/yr
- Insurance
- −$33
- HOA
- −$0
- Vacancy / Maint / Mgmt
- −$185
- Net cashflow
- $173
Break-even live
UW: 25.0% down · 7.5% · 30yr · 1.5% tax · 5.0% vac · 8.0% maint · 8.0% mgmt
Financing live
Cash to close
- Down payment
- $19,975
- Closing costs
- $2,397
- Reserves months
- —
- Total cash needed
- —
Loan-product check · same deal, 3 products live
Conventional
25% down · 7.5% · 30yr
- Down + closing
- —
- Monthly P&I
- —
- Monthly cashflow
- —
- DSCR
- —
- Eligible?
- —
Personal DTI + credit; lowest rate.
DSCR
20% down · 8.5% · 30yr
- Down + closing
- —
- Monthly P&I
- —
- Monthly cashflow
- —
- DSCR
- —
- Eligible?
- —
No personal income docs; deal must DSCR.
Hard money
10% down · 12.0% · 12mo
- Down + closing
- —
- Monthly P&I
- —
- Monthly cashflow
- —
- DSCR
- —
- Eligible?
- —
Short-term bridge; refi at stabilization.
Rent comps 2 comps
| Address | Beds | Baths | Sqft | Rent | $/sqft | DOM | Units | Dist |
|---|---|---|---|---|---|---|---|---|
| 826-830 Dornin St Unit E-05 Greensburg, PA | 1.0 | 1.0 | 575 | $725 | $1.26 | 1d | 1 | 1.27mi |
| 826 Dornin St Greensburg, PA | 1.0 | 1.0 | 575 | $725 | $1.26 | 1d | 1 | 1.27mi |
Listing history 7 events
-
2026-06-02status $79,900 Pending 41 DOM
-
2026-06-01days on market $79,900 Contingent 41 DOM
-
2026-05-31days on market $79,900 Contingent 40 DOM
-
2026-04-24historical Contingent
-
2026-04-21$79,900 Active
-
2000-11-01soldstatus $21,110
-
1998-10-01soldstatus $19,700
ⓘ Source: listings_history table (triggers on properties + properties_extension) + one-shot
backfill from property_details.listing_events for pre-trigger history.
Tax reassessment forecast PA · Partial reset (capped growth)
- Current annual tax
- $836 · $70/mo
- Projected year-2 tax
- $1,049 · $87/mo
- Expected delta
- +$213/yr (+$18/mo · 25.5%)
ⓘ Screening estimate from a state-policy table — verify with the county assessor before closing.
Climate risk First Street
- Flood 1/10 Low FEMA zone X (unshaded) · 0% chance over 30 yrs
- Wildfire 1/10 Low
- Heat 4/10 Moderate 7 d/yr ≥96°F today · 18 d/yr by 30 yrs out
- Wind 2/10 Low
- Air quality 3/10 Moderate 2 unhealthy d/yr today · 3 by 30 yrs out
Nearby sold comps map
Loading sold comps map…
Walkable amenities ~0.75 mi
Loading nearby amenities…
Taxation est. · year 1
- Rental income
- $10,555
- − Mortgage interest
- −$4,476
- − Property taxes
- −$836
- − Insurance
- −$400
- − Repairs & maintenance
- −$844
- − Management
- −$844
- − Depreciation
- −$2,324
- Taxable income
- $830
- Est. tax owed @ 24.0%
- −$199
- After-tax cash flow
- $1,875/yr
For passive investors: Depreciation is non-cash, so a rental often shows a tax loss while cash-flowing — sheltering income. Rental losses are passive: they offset passive income freely, and up to $25,000/yr can offset ordinary (W-2) income if you actively participate and your MAGI is under $100k (phasing out to $0 by $150k); unused losses carry forward. On sale, claimed depreciation is recaptured at up to 25%, and gains may owe capital-gains tax (a 1031 exchange can defer both). Figures are a year-1 estimate at your 24.0% rate — not tax advice; consult a CPA.
Schools (NCES district)
- District
- Greensburg Salem SD
- NCES district ID
- 4210920
- Math proficiency
- 31% ▼ -21.00%
- Reading proficiency
- 52% ▼ -15.00%
- Median HH income
- $41,295
- Composite
- 34.82/100
- National rank
- #5101
- State rank
- #346 of 539 in PA
Livability — South Greensburg
- Score
- 72/100
- State rank
- #612
- US rank
- #5882
Category grades
Schools grade is shown separately in the Schools card above.
Census & demographics
- Census place
- South Greensburg, PA
- County
- Westmoreland County · 183,777 people
- Metro
- Pittsburgh, PA
- Population (ZIP)
- 56,425
- Household income
- $78,555
- Rent vs Own
- Severe rent burden
- 1209.0
Population outlook (Westmoreland County) Hauer SSP2
- Today (2025)
- 342,555 people
- By 2030
- 331,717 · -3.2%
- By 2040
- 304,976 · -11.0%
- By 2050
- 277,444 · -19.0%
- By 2075
- 224,607 · -34.4%
- By 2100
- 171,084 · -50.1%
Race, ethnicity, and origin ACS 2023
- Neighborhood character
- Predominantly White (92%)
- Race & ethnicity
- White 92% Two or more races 3% Black 2% Hispanic / Latino 2% Asian 1%
- Common ancestry
- Romanian 8% Lithuanian 2% Slovak 2%
- Foreign-born
- 2% · Canada
- Languages at home
- 97% English-only · Spanish 1%
Political lean MEDSL · Westmoreland
- 2024 margin
- Strong R (+28.4) · D 35.4% · R 63.9%
- 2008→2024 swing
- -11.7pp toward R · 2008: -16.7pp · 2024: -28.4pp
- All cycles
- 2024: R+28.4 2020: R+28.3 2016: R+31.3 2012: R+23.7 2008: R+16.7
Not yet ingested
- Civics
- —
Market trends
- HPI YoY
- ▼ -115.23%
- Current HPI
- 177.4921
- Rent YoY
- ▲ 7.95%
- Metro
- Pittsburgh, PA
- State GDP YoY
- ▲ 1.68%
- F500 in state
- 34
Industry mix (Fortune 500 HQ in PA)
| Industry | F500 HQs | Revenue |
|---|---|---|
| Healthcare | 2 | $309B |
|
||
| Insurance | 2 | $27B |
|
||
| Telecommunications / Media | 1 | $124B |
|
||
| Industrial Distribution | 1 | $22B |
|
||
| Financial Services | 1 | $20B |
|
||
| Chemicals / Materials | 1 | $18B |
|
||
Price history
+305.6% since first listed4 events — show timeline
- 2026-04-24 Contingent — West Penn MLS
- 2026-04-21 Listed $79,900 West Penn MLS
- 2000-11-01 Sold (Public Records) $21,110 Public Records
- 1998-10-01 Sold (Public Records) $19,700 Public Records
Property tax history
+1.4%/yrLatest (2026): $836 · +0.0% YoY. Source: county tax records.
Cash-flow waterfall
monthlySold comps — $/sqft
last 12 mo · ≤1 miLoading sold comps…