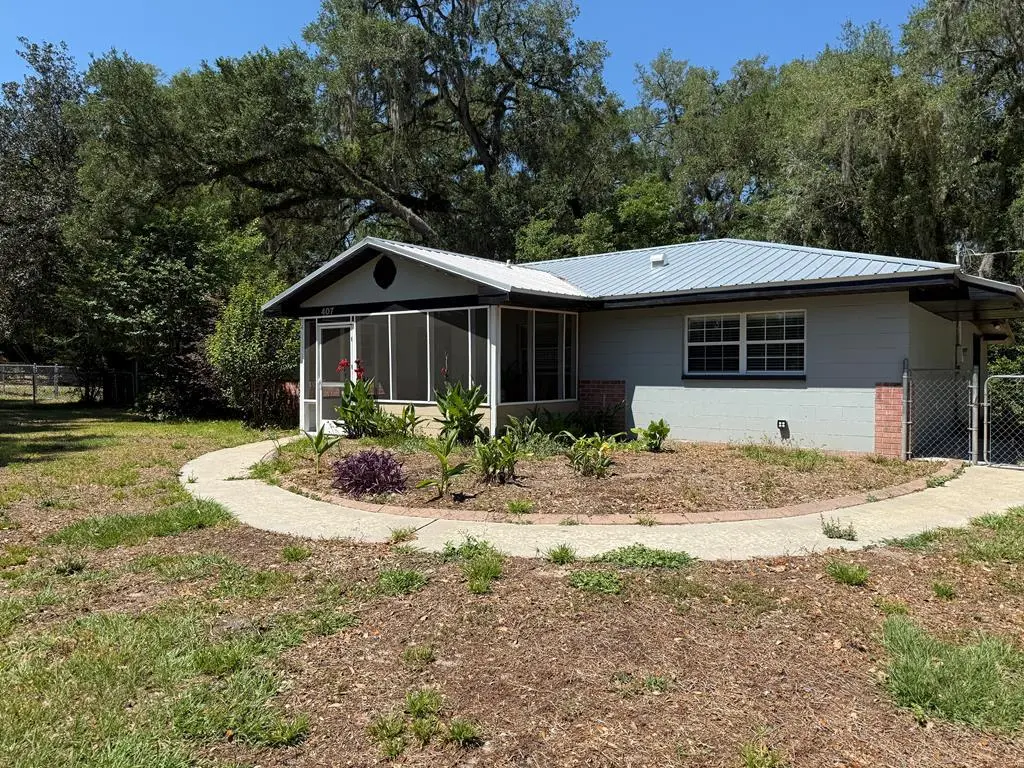
407 SW 1st St · Trenton, FL
Flood risk 1/10 · Minimal
- FEMA flood zone
- X (unshaded)
- Chance of flooding over 30 yrs
- 0.0%
- Est. flood insurance / yr
- $507 – $1,088
Fire risk 7/10 · Major
- Est. fire insurance / yr
- $947 – $1,759
Heat risk 8/10 · Major
- Hot days now (above 108°F)
- 6 days/yr
- Hot days in 30 yrs
- 19 days/yr
Wind risk 9/10 · Severe
- Chance of severe wind over 30 yrs
- 99.0%
Air-quality risk 3/10 · Minor
- Unhealthy air days now
- 2 days/yr
- Unhealthy air days in 30 yrs
- 3 days/yr
Risk factors via First Street. Map © Google.
Why this score? — see what drove the D- grade
The composite is a weighted blend of 9 inputs, each scored 0–100. Each bar is that input's sub-score; the figure is the points it added to the 100-point composite (weight × sub-score).
- Appreciation +10.0/10.0
- Cash flow +7.7/30.0
- Schools +5.3/10.0
- Livability +3.9/5.0
- Rent growth +2.5/5.0
- Condition / age +2.5/5.0
- 1% rule +1.9/10.0
- DSCR +1.8/10.0
- ARV discount +0.0/15.0
$285,000
🖨 Deal sheet (PDF) 📄 Offer letter ✓ Due diligence
Listing remarks MLS
Seller's Motivated! Welcome to your home in the charming city of Trenton, Florida! This delightful 3-bedroom, 2-bathroom residence is not just a house; it's a lifestyle waiting to be embraced. Nestled in the heart of Gilchrist County, this home is a testament to tranquility and comfort. The paved road leading to your driveway sets the tone for easy accessibility, making every journey a breeze. As you step inside, you'll be greeted by a warm and inviting atmosphere that instantly feels like home. The spacious living areas are adorned with natural light, creating an airy and cheerful ambiance. The 3 well-appointed bedrooms offer ample space for relaxation and personalization, ensuring everyone in the family has their own retreat. The 2 bathrooms are designed with modern convenience in mind, providing both style and functionality. A newly renovated kitchen awaits you homecooked meals and entertaining. One of the features of this home is the delightful screened porch, a perfect spot to enjoy your morning coffee. Imagine unwinding here after a long day, surrounded by the beauty of your fenced yard, offering privacy and security for both pets and loved ones. This residence is not just a house; it's a haven in a charming country setting. Embrace the serenity of Gilchrist County while being only a stone's throw away from the conveniences of small town life and a shoppe local lifestyle. Just minutes to the "A" rated Trenton public schools or short drive to multiple private schools. Short drive to Gainesville area hospitals, universities, shoppes and restaurants. Come and join this amazing community. Beautiful area state parks, springs and the world famous Suwannee River are just miles down the road.
Key facts
- Galley-style kitchen
- Split floor plan
- French doors
Tags
Property features AI
Finance
- Other: Pets allowed
Exterior
- Parking: Off-street parking
- Utilities: Public sewer
- Home design: Single-family detached residence; Residential property; Located in the Piedmont subdivision
- Construction: Shingle roof; Slab foundation
- Exterior features: Covered patio/porch; French doors; Corner lot; Wooded lot
Interior
- Kitchen: Dishwasher; Refrigerator
- Flooring: Hardwood; Laminate; Tile; Wood
- Bathrooms: 2 full bathrooms
- Interior features: Dishwasher; Refrigerator
Neighborhood map
What this means for you Summary
Snapshot
- This is a 3-bed/2.0-bath single-family listed at $285k.
Deal economics
- At list price, monthly cash flow is $-332 ($-4k/yr) — negative.
- To cash-flow at today's rent, offer at most $226k (20.6% below list).
- To meet the 1% rule (rent ≥ 1% of price), the offer needs to be $196k (31.3% below list).
- Recommended offer: $196k (31.3% below list) — sets the bar for 1% rule.
Location & tenants
- Location reads 77/100 on livability (#207 in FL, #3,078 nationally) — a middle-class / working-renter tenant base. Strengths: crime A+, cost of living A+, housing A+; Watch: amenities F, commute F, employment F.
- Gilchrist (rural): math 66% / reading 61% proficiency, ranked #9 of 73 in FL (top 12%) — acceptable for families but not a draw, mixed tenant base, ~2y average lease.
- Zoned schools: Trenton Elementary School (math 71% / reading 59%, grade B+, #514 of 2,144 statewide, top 24%, 809 students, 58% FRL).
- Market conditions: 198 active listings in the ZIP; 2 comparable units currently listed for rent nearby; 94 units permitted in Gilchrist County in 2024 (0 in 5+ unit buildings).
Forward outlook
- In year one you build about $30k of equity ($2k loan paydown + $28k appreciation (10.0% local appreciation)).
- Gilchrist County population projected to shrink 6% by 2050 — rents likely to lag national; underwrite the cash flow, not the appreciation.
- By year 2, paydown + projected appreciation supports a ~$49k cash-out refi (75% LTV) — recoverable capital for the next deal without selling this one.
Negotiation context
- Only 9 days on market — expect competitive offers; lowballing is unlikely to land.
- 4 sale attempts since 2y ago with the ask held roughly flat each time — persistent listings suggest the price (not the market) is what's stuck; bring a comps-based counter.
- Current owner paid $200k; 42% above their basis — modest negotiation headroom, anchor on the comps not their cost.
Risks & watch-outs
- Climate carrying-cost: severe wind risk, 99% chance of damaging wind over 30y; major wildfire risk; extreme-heat days projected 6→19/yr by 2055 (HVAC capex compounding) — expect insurance premiums to compound above CPI over the hold.
Questions for the listing agent
- What do current leases actually rent for vs. the listed asking? Can we see a recent rent roll and the last 12 months of T-12 income?
- Built in 1977 — when were the roof, HVAC, electrical panel, plumbing, and water heater last replaced?
- Is there a deadline driving the sale (1031 exchange, divorce, estate, relocation)? That informs how much negotiation room exists.
- Schools are B-rated — typically a magnet for longer-tenancy family renters. What's the average tenant stay here, and is there a school-zone premium baked into asking?
- The area grade is low — what's the realistic commute time and amenity access for the typical tenant pool here? Any planned neighborhood developments (good or bad) we should know about?
- What's the average days-on-market for RENTAL listings here right now (not sales)? A rising rental-DOM trend means longer vacancies and softer asking-rent achievability than the comps imply.
- What's the recent tenant-quality profile in this submarket — average credit score on applications, eviction rate, late-payment / NSF rate, and stable-employment percentage? A property-management company in the area should have these aggregated.
- How much new for-sale + rental construction is in the pipeline within 1–3 miles? Heavy new supply typically softens prices + rents 12–24 months out; constrained supply supports both.
Investment metrics
- 1% rule
- 0.69% ✗
- Cap rate
- 4.90%
- Cash-on-cash
- -4.99%
- DSCR
- 0.78
- GRM
- 12.1
CMA / ARV
- ARV (on-the-fly)
- $221,676
- Comps found
- 12
Show comp detail 12 sales within ~0.75 mi
| Address | Dist | Beds/Ba | Sqft | Sold | Price | $/sf | Match |
|---|---|---|---|---|---|---|---|
| 317 SW 1st St | 0.03mi | 3/2.0 | 1,592 (+6%) | 14mo | $212,000 | $133 | 78 |
| 915 SW 4th Ave | 0.45mi | 3/2.5 | 1,518 (+1%) | 16mo | $345,000 | $227 | 63 |
| 621 NE 2nd St | 0.47mi | 3/2.0 | 1,474 (-2%) | 14mo | $235,000 | $159 | 62 |
| 501 NW Second St | 0.35mi | 3/2.0 | 1,363 (-10%) | 7mo | $200,000 | $147 | 62 |
| 511 NW Second St | 0.37mi | 3/2.0 | 1,363 (-10%) | 7mo | $200,000 | $147 | 61 |
| 1119 SW 4th Ave | 0.60mi | 3/2.0 | 1,402 (-7%) | 1mo | $245,000 | $175 | 60 |
| 504 NE 4th Ave | 0.45mi | 3/2.0 | 1,404 (-7%) | 15mo | $105,000 | $75 | 55 |
| 823 E Wade St | 0.60mi | 4/2.0 (+1) | 1,596 (+6%) | 3mo | $140,000 | $88 | 55 |
| 630 NE Seventh Ave | 0.64mi | 3/2.0 | 1,491 (-1%) | 17mo | $255,000 | $171 | 54 |
| 626 NE Seventh Ave | 0.64mi | 3/2.0 | 1,491 (-1%) | 17mo | $255,000 | $171 | 54 |
| 518 NE 2nd St | 0.44mi | 2/1.0 (-1) | 1,299 (-14%) | 2mo | $87,000 | $67 | 46 |
| 1127 SW 6th Ave | 0.63mi | 3/1.5 | 1,634 (+8%) | 15mo | $198,000 | $121 | 42 |
Match score weights: distance 35% · size 25% · config 20% · recency 20%. Top-matched comps best support the ARV.
Projected returns pro-forma
10.0% appreciation · 3.0% rent growth · sell at horizon
- IRR
- 20.7%
- Equity multiple
- 2.68×
- Total profit
- $134,054
- Equity at exit
- $256,751
- IRR
- 18.8%
- Equity multiple
- 6.15×
- Total profit
- $411,337
- Equity at exit
- $553,692
Cash invested: $79,800 (down + closing). Projections, not guarantees.
Landlord ↔ Tenant lean methodology
- Overall (STATE)
- 87 Strongly Landlord-Friendly
- State Florida
- 87 Strongly Landlord-Friendly · R+3
- County
- — inherits STATE
- City
- — inherits STATE
ZIP-level market 32693
- Home prices YoY
- 14.8%
- Active inventory
- 198
- Price-to-rent
- 12.1×
Monthly cashflow live
- Estimated rent
- $1,958 medium interval (Pro) →
- Mortgage (P&I)
- −$1,495
- Tax from tax record
- −$266 /mo · $3,187/yr
- Insurance
- −$119
- HOA
- −$0
- Vacancy / Maint / Mgmt
- −$411
- Net cashflow
- $-332
Break-even live
Sensitivity live
| Price | -10% $-171 | -5% $-251 | +0% $-332 | +5% $-413 | +10% $-493 |
|---|---|---|---|---|---|
| Rent | -10% $-487 | -5% $-409 | +0% $-332 | +5% $-255 | +10% $-177 |
| Rate | -1.0pp $-188 | -0.5pp $-259 | base $-332 | +0.5pp $-406 | +1.0pp $-481 |
UW: 25.0% down · 7.5% · 30yr · 1.5% tax · 5.0% vac · 8.0% maint · 8.0% mgmt
Financing live
Cash to close
- Down payment
- $71,250
- Closing costs
- $8,550
- Reserves months
- —
- Total cash needed
- —
Loan-product check · same deal, 3 products live
Conventional
25% down · 7.5% · 30yr
- Down + closing
- —
- Monthly P&I
- —
- Monthly cashflow
- —
- DSCR
- —
- Eligible?
- —
Personal DTI + credit; lowest rate.
DSCR
20% down · 8.5% · 30yr
- Down + closing
- —
- Monthly P&I
- —
- Monthly cashflow
- —
- DSCR
- —
- Eligible?
- —
No personal income docs; deal must DSCR.
Hard money
10% down · 12.0% · 12mo
- Down + closing
- —
- Monthly P&I
- —
- Monthly cashflow
- —
- DSCR
- —
- Eligible?
- —
Short-term bridge; refi at stabilization.
Rent comps 2 comps
| Address | Beds | Baths | Sqft | Rent | $/sqft | DOM | Units | Dist |
|---|---|---|---|---|---|---|---|---|
| 407 SW 1st St Trenton, FL | 3.0 | 2.0 | 1508 | $2,000 | $1.33 | 15d | 1 | 0.03mi |
| 1102 NE 16th Ave Trenton, FL | 3.0 | 2.0 | 1056 | $1,250 | $1.18 | 15d | 1 | 1.19mi |
Listing history 7 events
-
2026-06-21days on market $285,000 Active 9 DOM
-
2026-06-18days on market $285,000 Active 6 DOM
-
2026-06-17days on market $285,000 Active 5 DOM
-
2026-06-16days on market $285,000 Active 4 DOM
-
2026-06-15days on market $285,000 Active 3 DOM
-
2026-06-13remarks 699-char remark
-
2026-06-13$285,000 Active 1 DOM
ⓘ Source: listings_history table (triggers on properties + properties_extension) + one-shot
backfill from property_details.listing_events for pre-trigger history.
Tax reassessment forecast FL · Resets to sale price
- Current annual tax
- $3,187 · $266/mo
- Projected year-2 tax
- $3,187 · $266/mo
- Expected delta
- $0/yr ($0/mo · 0.0%)
ⓘ Screening estimate from a state-policy table — verify with the county assessor before closing.
Climate risk First Street
- Flood 1/10 Low FEMA zone X (unshaded) · 0% chance over 30 yrs
- Wildfire 7/10 Severe
- Heat 8/10 Severe 6 d/yr ≥108°F today · 19 d/yr by 30 yrs out
- Wind 9/10 Extreme 99% chance of damaging wind over 30 yrs
- Air quality 3/10 Moderate 2 unhealthy d/yr today · 3 by 30 yrs out
Nearby sold comps map
Loading sold comps map…
Walkable amenities ~0.75 mi
Loading nearby amenities…
Taxation est. · year 1
- Rental income
- $23,499
- − Mortgage interest
- −$15,964
- − Property taxes
- −$3,187
- − Insurance
- −$1,425
- − Repairs & maintenance
- −$1,880
- − Management
- −$1,880
- − Depreciation
- −$8,291
- Taxable loss
- −$9,128
- Est. tax savings @ 24.0%
- +$2,191
- After-tax cash flow
- $-1,792/yr
For passive investors: Depreciation is non-cash, so a rental often shows a tax loss while cash-flowing — sheltering income. Rental losses are passive: they offset passive income freely, and up to $25,000/yr can offset ordinary (W-2) income if you actively participate and your MAGI is under $100k (phasing out to $0 by $150k); unused losses carry forward. On sale, claimed depreciation is recaptured at up to 25%, and gains may owe capital-gains tax (a 1031 exchange can defer both). Figures are a year-1 estimate at your 24.0% rate — not tax advice; consult a CPA.
Schools (NCES district)
- District
- Gilchrist
- NCES district ID
- 1200630
- Math proficiency
- 66% ▼ -4.00%
- Reading proficiency
- 61% ▼ -5.00%
- Median HH income
- $39,610
- Composite
- 53.01/100
- National rank
- #1522
- State rank
- #9 of 73 in FL
Livability — Trenton
- Score
- 77/100
- State rank
- #207
- US rank
- #3078
Category grades
Schools grade is shown separately in the Schools card above.
Census & demographics
- Census place
- Trenton, FL
- Population (ZIP)
- 11,692
Population outlook (Gilchrist County) Hauer SSP2
- Today (2025)
- 17,730 people
- By 2030
- 17,722 · +-0.0%
- By 2040
- 17,393 · -1.9%
- By 2050
- 16,597 · -6.4%
- By 2075
- 14,300 · -19.3%
- By 2100
- 11,498 · -35.1%
Race, ethnicity, and origin ACS 2023
- Neighborhood character
- Predominantly White (82%)
- Race & ethnicity
- White 82% Hispanic / Latino 8% Two or more races 7% Black 5%
- Hispanic origin (detail)
- Mexican 2% Puerto Rican 3%
- Common ancestry
- Lithuanian 4% Slovak 3% Romanian 1%
- Foreign-born
- 4% · Canada
- Languages at home
- 94% English-only · Spanish 5%
Political lean MEDSL · Gilchrist
- 2024 margin
- Solid R (+68.0) · D 15.6% · R 83.6%
- 2008→2024 swing
- -21.2pp toward R · 2008: -46.8pp · 2024: -68.0pp
- All cycles
- 2024: R+68.0 2020: R+64.0 2016: R+62.8 2012: R+51.0 2008: R+46.8
Not yet ingested
- Civics
- —
Market trends
- HPI YoY
- ▲ 46.81%
- Current HPI
- 363.4299
- Rent YoY
- —
- Metro
- —
- State GDP YoY
- ▲ 3.28%
- F500 in state
- 36
Industry mix (Fortune 500 HQ in FL)
| Industry | F500 HQs | Revenue |
|---|---|---|
| Industrial Technology | 2 | $29B |
|
||
| Insurance | 2 | $17B |
|
||
| Retail | 1 | $60B |
|
||
| Technology Distribution | 1 | $58B |
|
||
| Homebuilding | 1 | $35B |
|
||
| Technology Manufacturing | 1 | $35B |
|
||
Price history
+418.2% since first listed14 events — show timeline
- 2026-06-12 Listed $285,000 DGLMLS
- 2026-05-30 Price Changed $2,000 DGLMLS
- 2026-05-08 Listed for Rent $2,200 DGLMLS
- 2024-08-21 Sold (Public Records) $200,000 Public Records
- 2024-08-20 Sold (MLS) $217,600 DGLMLS
- 2024-06-20 Relisted — DGLMLS
- 2024-06-11 Pending — DGLMLS
- 2024-05-23 Price Changed $225,000 DGLMLS
- 2024-05-07 Price Changed $245,000 DGLMLS
- 2024-04-03 Price Changed $250,000 DGLMLS
- 2024-02-14 Price Changed $255,000 DGLMLS
- 2024-01-31 Listed $265,000 DGLMLS
- 2006-12-08 Sold (Public Records) $100,000 Public Records
- 1997-01-01 Sold (Public Records) $55,000 Public Records
Property tax history
+13.9%/yrLatest (2025): $3,187 · +101.6% YoY. Source: county tax records.
Cash-flow waterfall
monthlySold comps — $/sqft
last 12 mo · ≤1 miLoading sold comps…