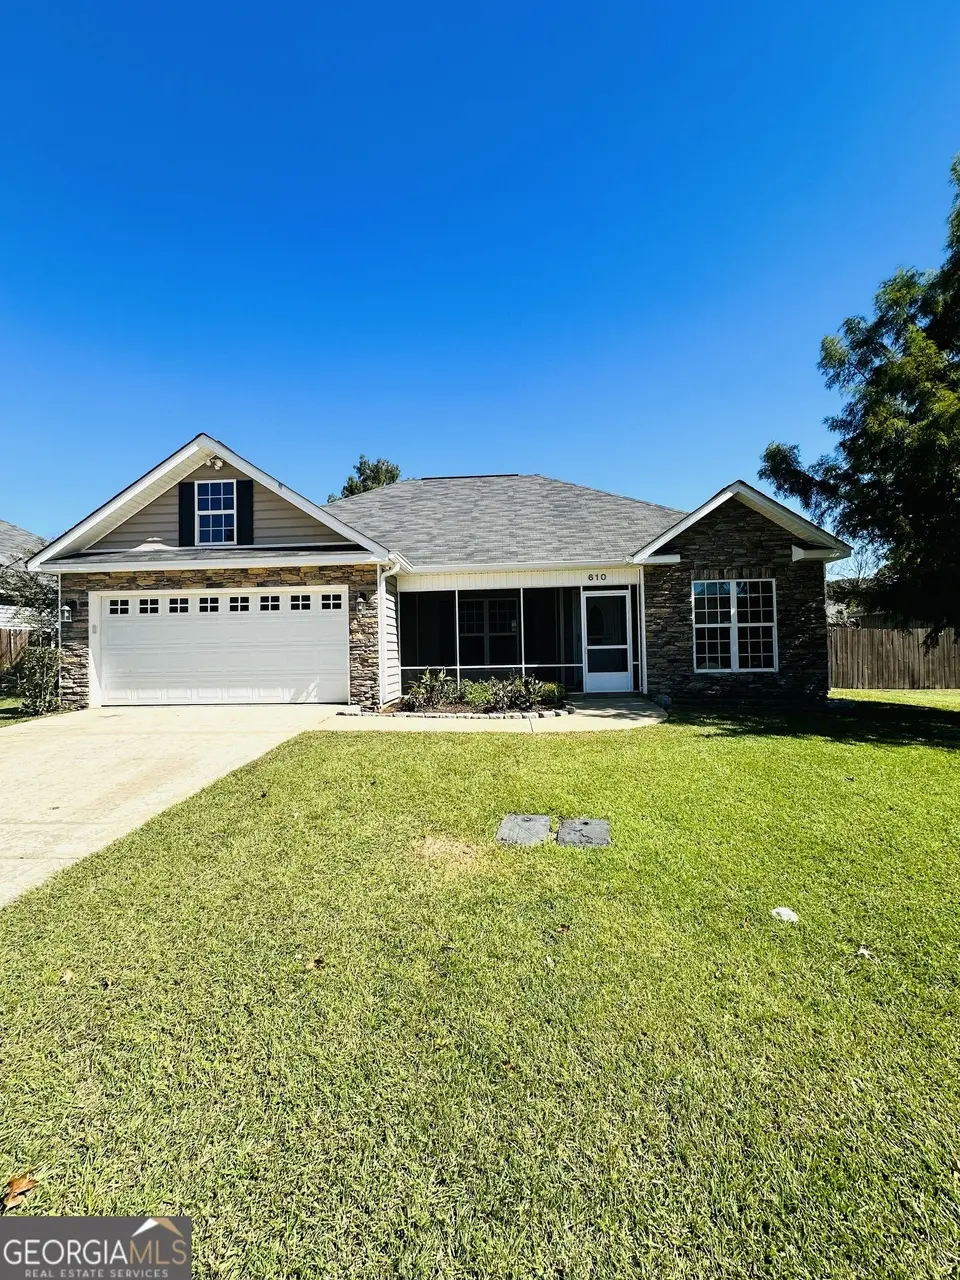
610 Amherst St · Perry, GA
Flood risk 1/10 · Minimal
- FEMA flood zone
- X (unshaded)
- Chance of flooding over 30 yrs
- 0.0%
- Est. flood insurance / yr
- $507 – $1,088
Fire risk 4/10 · Minor
- Est. fire insurance / yr
- $963 – $1,789
Heat risk 7/10 · Major
- Hot days now (above 109°F)
- 7 days/yr
- Hot days in 30 yrs
- 19 days/yr
Wind risk 7/10 · Major
- Chance of severe wind over 30 yrs
- 78.0%
Air-quality risk 2/10 · Minimal
- Unhealthy air days now
- 2 days/yr
- Unhealthy air days in 30 yrs
- 2 days/yr
Risk factors via First Street. Map © Google.
Why this score? — see what drove the D+ grade
The composite is a weighted blend of 9 inputs, each scored 0–100. Each bar is that input's sub-score; the figure is the points it added to the 100-point composite (weight × sub-score).
- Cash flow +14.4/30.0
- ARV discount +11.4/15.0
- DSCR +4.4/10.0
- Schools +3.9/10.0
- Livability +3.4/5.0
- 1% rule +3.2/10.0
- Rent growth +2.5/5.0
- Condition / age +2.5/5.0
- Appreciation +0.0/10.0
$270,000
🖨 Deal sheet (PDF) 📄 Offer letter ✓ Due diligence
Listing remarks
Sun-drenched and charming, this delightful 3-bedroom, 2-bath home offers the ideal layout for easy living. Features include bright living spaces, gleaming hardwood floors, and a private, landscaped backyard patio. Screend front porch. Perfectly situated just minutes from top-rated schools, local shopping, and major commuting routes. Don't miss this opportunity to own a fantastic property in a highly desirable neighborhood!
Key facts
- Screened front porch
- Top-rated schools
- Local shopping
Tags
Property features AI
Finance
- Other: Rental special listing condition
- HOA & community: No HOA; Community park
Exterior
- Parking: Attached garage; 2 parking spaces (garage)
- Utilities: Public water; Public sewer; Cable available; Electricity available; High-speed internet available
- Home design: Single family residence; House; One story; Resale property
- Construction: Built in 2007; Brick, stucco, and vinyl siding exterior; Composition roof; Slab foundation
- Exterior features: Patio; Screened porch; Level lot; Has a view
Interior
- Kitchen: Breakfast area; Pantry; Solid surface counters; Dishwasher; Disposal; Microwave
- Bedrooms: 3 bedrooms (all on the main level)
- Flooring: Carpet; Laminate; Tile
- Bathrooms: 2 full bathrooms
- Heating & cooling: Central electric heating; Central electric air conditioning
- Interior features: Double vanity; Separate shower; Soaking tub; Tile bath; Walk-in closet(s)
- Laundry & utility: Laundry closet
Neighborhood map
What this means for you Summary
Snapshot
- This is a 3-bed/2.0-bath single-family listed at $270k.
Deal economics
- At list price, monthly cash flow is $56 ($671/yr) — positive.
- The deal already cash-flows at list — no discount required.
- To meet the 1% rule (rent ≥ 1% of price), the offer needs to be $222k (17.9% below list).
- Recommended offer: $222k (17.9% below list) — sets the bar for 1% rule.
- Cap rate 6.5% vs local median 4.5% in Perry — top-decile yield for the area; either an underpriced asset or a hidden risk that comps aren't pricing in. Stress-test before assuming the spread holds.
Location & tenants
- Location reads 68/100 on livability (#149 in GA) — a middle-class / working-renter tenant base. Strengths: cost of living A+, housing A+, crime B+; Watch: amenities F, commute F, health & safety F.
- Houston County (urban): math 43% / reading 46% proficiency, ranked #23 of 174 in GA (top 13%) — families likely to look elsewhere, expect single-tenant / working-renter base with shorter leases.
- Zoned schools: Langston Road Elementary School (math 58% / reading 53%, grade C, #173 of 1,228 statewide, top 14%, 867 students, 49% FRL); Mossy Creek Middle School (math 57% / reading 61%, grade B, #45 of 470 statewide, top 10%, 741 students, 36% FRL); Perry High School (math 31% / reading 39%, grade F, #84 of 424 statewide, top 20%, 1,478 students, 48% FRL) — zoned schools at 44% FRL track the district average.
- Market conditions: 258 active listings in the ZIP; 6 comparable units currently listed for rent nearby; rentals at typical pace (median 15d on market — plan ~3-4 weeks tenant-placement turnaround); high-income renter base; 1,545 units permitted in Houston County in 2024 (336 in 5+ unit buildings).
Forward outlook
- Local home prices are declining (-3.0%/yr); year-one equity from $2k of loan paydown is wiped out by about $8k of value loss. Plan a longer hold.
- Houston County population projected at +22% by 2050 — long-run rental-demand tailwind backs the buy-and-hold thesis.
Negotiation context
- Only 4 days on market — expect competitive offers; lowballing is unlikely to land.
- 3 sale attempts since 3y ago with the ask held roughly flat each time — persistent listings suggest the price (not the market) is what's stuck; bring a comps-based counter.
Risks & watch-outs
- Climate carrying-cost: major wind risk, 78% chance of damaging wind over 30y; extreme-heat days projected 7→19/yr by 2055 (HVAC capex compounding) — expect insurance premiums to compound above CPI over the hold.
Questions for the listing agent
- Is there a deadline driving the sale (1031 exchange, divorce, estate, relocation)? That informs how much negotiation room exists.
- The area grade is low — what's the realistic commute time and amenity access for the typical tenant pool here? Any planned neighborhood developments (good or bad) we should know about?
- What's the average days-on-market for RENTAL listings here right now (not sales)? A rising rental-DOM trend means longer vacancies and softer asking-rent achievability than the comps imply.
- What's the recent tenant-quality profile in this submarket — average credit score on applications, eviction rate, late-payment / NSF rate, and stable-employment percentage? A property-management company in the area should have these aggregated.
- How much new for-sale + rental construction is in the pipeline within 1–3 miles? Heavy new supply typically softens prices + rents 12–24 months out; constrained supply supports both.
Investment metrics
- 1% rule
- 0.82% ✗
- Cap rate
- 6.54%
- Cash-on-cash
- 0.89%
- DSCR
- 1.04
- GRM
- 10.1
CMA / ARV
- ARV (on-the-fly)
- $295,800
- Comps found
- 12
Show comp detail 12 sales within ~0.75 mi
| Address | Dist | Beds/Ba | Sqft | Sold | Price | $/sf | Match |
|---|---|---|---|---|---|---|---|
| 104 Arcadia Ln | 0.10mi | 3/2.0 | 1,807 (+4%) | 6mo | $289,900 | $160 | 84 |
| 305 Gibson Cir | 0.19mi | 4/2.0 (+1) | 1,728 (-1%) | 2mo | $300,000 | $174 | 84 |
| 305 Loneoak Trl | 0.13mi | 3/2.0 | 1,620 (-7%) | 4mo | $282,000 | $174 | 79 |
| 208 Gibson Cir | 0.27mi | 3/2.0 | 1,658 (-5%) | 1mo | $293,000 | $177 | 79 |
| 200 Boulder Creek Rd | 0.40mi | 3/2.0 | 1,767 (+2%) | 1mo | $265,000 | $150 | 78 |
| 113 Lone Oak Trl | 0.16mi | 3/2.0 | 1,611 (-7%) | 6mo | $280,000 | $174 | 75 |
| 210 Gibson Cir | 0.24mi | 3/2.0 | 1,603 (-8%) | 2mo | $289,900 | $181 | 74 |
| 120 Blackstone Ct | 0.32mi | 3/2.0 | 1,620 (-7%) | 3mo | $260,000 | $160 | 71 |
| 205 Canvass Back Trl | 0.48mi | 3/2.0 | 1,635 (-6%) | 6mo | $278,000 | $170 | 62 |
| 115 Mallards Landing Dr | 0.54mi | 3/2.0 | 1,605 (-8%) | 2mo | $265,000 | $165 | 60 |
| 109 Blackstone Ct | 0.26mi | 4/2.0 (+1) | 1,942 (+12%) | 7mo | $284,000 | $146 | 57 |
| 419 Lake Joy Rd | 0.56mi | 3/2.0 | 1,934 (+11%) | 7mo | $215,000 | $111 | 50 |
Match score weights: distance 35% · size 25% · config 20% · recency 20%. Top-matched comps best support the ARV.
Projected returns pro-forma
-3.0% appreciation · 3.0% rent growth · sell at horizon
- IRR
- -14.9%
- Equity multiple
- 0.47×
- Total profit
- $-40,261
- Equity at exit
- $40,258
- IRR
- -6.3%
- Equity multiple
- 0.59×
- Total profit
- $-30,761
- Equity at exit
- $23,345
Cash invested: $75,600 (down + closing). Projections, not guarantees.
Landlord ↔ Tenant lean methodology
- Overall (STATE)
- 90 Strongly Landlord-Friendly
- State Georgia
- 90 Strongly Landlord-Friendly · R+3
- County
- — inherits STATE
- City
- — inherits STATE
ZIP-level market 31047
- Home prices YoY
- -14.4%
- Active inventory
- 258
- Price-to-rent
- 10.1×
Monthly cashflow live
- Estimated rent
- $2,218 high interval (Pro) →
- Mortgage (P&I)
- −$1,416
- Tax from tax record
- −$168 /mo · $2,010/yr
- Insurance
- −$112
- HOA
- −$0
- Vacancy / Maint / Mgmt
- −$466
- Net cashflow
- $56
Break-even live
Sensitivity live
| Price | -10% $209 | -5% $132 | +0% $56 | +5% $-21 | +10% $-97 |
|---|---|---|---|---|---|
| Rent | -10% $-119 | -5% $-32 | +0% $56 | +5% $144 | +10% $231 |
| Rate | -1.0pp $192 | -0.5pp $125 | base $56 | +0.5pp $-14 | +1.0pp $-85 |
UW: 25.0% down · 7.5% · 30yr · 1.5% tax · 5.0% vac · 8.0% maint · 8.0% mgmt
Financing live
Cash to close
- Down payment
- $67,500
- Closing costs
- $8,100
- Reserves months
- —
- Total cash needed
- —
Loan-product check · same deal, 3 products live
Conventional
25% down · 7.5% · 30yr
- Down + closing
- —
- Monthly P&I
- —
- Monthly cashflow
- —
- DSCR
- —
- Eligible?
- —
Personal DTI + credit; lowest rate.
DSCR
20% down · 8.5% · 30yr
- Down + closing
- —
- Monthly P&I
- —
- Monthly cashflow
- —
- DSCR
- —
- Eligible?
- —
No personal income docs; deal must DSCR.
Hard money
10% down · 12.0% · 12mo
- Down + closing
- —
- Monthly P&I
- —
- Monthly cashflow
- —
- DSCR
- —
- Eligible?
- —
Short-term bridge; refi at stabilization.
Rent comps 6 comps
| Address | Beds | Baths | Sqft | Rent | $/sqft | DOM | Units | Dist |
|---|---|---|---|---|---|---|---|---|
| 312 Loneoak Trl Kathleen, GA | 3.0 | 2.0 | 1620 | $2,100 | $1.30 | 15d | 1 | 0.16mi |
| 101 Mallards Landing Dr Kathleen, GA | 4.0 | 2.0 | 1803 | $2,000 | $1.11 | 45d | 1 | 0.40mi |
| 101 Mallards Landing Dr Kathleen, GA | 4.0 | 2.0 | 1803 | $2,000 | $1.11 | 15d | 1 | 0.40mi |
| 481 Lake Joy Rd Kathleen, GA | 3.0 | 1.0 | 1380 | $1,400 | $1.01 | 15d | 1 | 0.48mi |
| 112 Mallards Landing Dr Kathleen, GA | 3.0 | 2.0 | 1489 | $2,000 | $1.34 | 45d | 1 | 0.57mi |
| 402 Otters Ridge Dr Kathleen, GA | 3.0 | 2.0 | 1656 | $2,000 | $1.21 | 15d | 1 | 1.17mi |
Listing history 10 events
-
2026-06-02status $270,000 Under Contract 4 DOM
-
2026-06-01days on market $270,000 New 4 DOM
-
2026-05-31days on market $270,000 New 3 DOM
-
2026-05-30days on market $270,000 New 2 DOM
-
2026-05-28$270,000 New
-
2025-10-30historical $1,750
-
2025-10-21price $1,750
-
2025-09-19$1,850
-
2023-10-15historical $1,650
-
2023-10-11$1,650
ⓘ Source: listings_history table (triggers on properties + properties_extension) + one-shot
backfill from property_details.listing_events for pre-trigger history.
Tax reassessment forecast GA · Resets to sale price
- Current annual tax
- $2,010 · $168/mo
- Projected year-2 tax
- $2,484 · $207/mo
- Expected delta
- +$474/yr (+$39/mo · 23.6%)
ⓘ Screening estimate from a state-policy table — verify with the county assessor before closing.
Climate risk First Street
- Flood 1/10 Low FEMA zone X (unshaded) · 0% chance over 30 yrs
- Wildfire 4/10 Moderate
- Heat 7/10 Severe 7 d/yr ≥109°F today · 19 d/yr by 30 yrs out
- Wind 7/10 Severe 78% chance of damaging wind over 30 yrs
- Air quality 2/10 Low 2 unhealthy d/yr today · 2 by 30 yrs out
Nearby sold comps map
Loading sold comps map…
Walkable amenities ~0.75 mi
Loading nearby amenities…
Taxation est. · year 1
- Rental income
- $26,611
- − Mortgage interest
- −$15,124
- − Property taxes
- −$2,010
- − Insurance
- −$1,350
- − Repairs & maintenance
- −$2,129
- − Management
- −$2,129
- − Depreciation
- −$7,855
- Taxable loss
- −$3,986
- Est. tax savings @ 24.0%
- +$957
- After-tax cash flow
- $1,628/yr
For passive investors: Depreciation is non-cash, so a rental often shows a tax loss while cash-flowing — sheltering income. Rental losses are passive: they offset passive income freely, and up to $25,000/yr can offset ordinary (W-2) income if you actively participate and your MAGI is under $100k (phasing out to $0 by $150k); unused losses carry forward. On sale, claimed depreciation is recaptured at up to 25%, and gains may owe capital-gains tax (a 1031 exchange can defer both). Figures are a year-1 estimate at your 24.0% rate — not tax advice; consult a CPA.
Schools (NCES district)
- District
- Houston County
- NCES district ID
- 1302880
- Math proficiency
- 43% ▼ -7.00%
- Reading proficiency
- 46% ▼ -2.00%
- Median HH income
- $54,823
- Composite
- 38.68/100
- National rank
- #4144
- State rank
- #23 of 174 in GA
Livability — Perry
- Score
- 68/100
- State rank
- #149
- US rank
- #9757
Category grades
Schools grade is shown separately in the Schools card above.
Census & demographics
- Census place
- Perry, GA
- County
- Houston County · 157,321 people
- City population
- 22,953
- Metro
- Warner Robins, GA
- Population (ZIP)
- 20,203
- Household income
- $117,332
- Rent vs Own
- Severe rent burden
- 11.0
Population outlook (Houston County) Hauer SSP2
- Today (2025)
- 169,502 people
- By 2030
- 178,486 · +5.3%
- By 2040
- 194,642 · +14.8%
- By 2050
- 207,119 · +22.2%
- By 2075
- 231,480 · +36.6%
- By 2100
- 235,034 · +38.7%
Race, ethnicity, and origin ACS 2023
- Neighborhood character
- Majority White (65%)
- Race & ethnicity
- White 65% Black 18% Two or more races 12% Hispanic / Latino 8% Asian 3%
- Hispanic origin (detail)
- Mexican 3% Cuban 2%
- Common ancestry
- Italian 3% Slovak 3% Lithuanian 1%
- Foreign-born
- 6% · Canada, South Korea, Jamaica
- Languages at home
- 94% English-only · Spanish 4% Korean 1% Tagalog/Filipino 1%
Political lean MEDSL · Houston
- 2024 margin
- R (+11.3) · D 44.0% · R 55.3%
- 2008→2024 swing
- +8.9pp toward D · 2008: -20.2pp · 2024: -11.3pp
- All cycles
- 2024: R+11.3 2020: R+12.4 2016: R+21.6 2012: R+20.7 2008: R+20.2
Not yet ingested
- Civics
- —
Market trends
- HPI YoY
- ▼ -36.77%
- Current HPI
- 218.1333
- Rent YoY
- —
- Metro
- Warner Robins, GA
- State GDP YoY
- ▲ 2.66%
- F500 in state
- 28
Industry mix (Fortune 500 HQ in GA)
| Industry | F500 HQs | Revenue |
|---|---|---|
| Paper / Packaging | 2 | $29B |
|
||
| Retail | 1 | $160B |
|
||
| Transportation / Logistics | 1 | $91B |
|
||
| Airlines | 1 | $62B |
|
||
| Consumer Goods | 1 | $47B |
|
||
| Utilities | 1 | $25B |
|
||
Price history
+16263.6% since first listed6 events — show timeline
- 2026-05-28 Listed $270,000 GAMLS
- 2025-10-30 Rental Removed $1,750 APPFOLIO
- 2025-10-21 Price Changed $1,750 APPFOLIO
- 2025-09-19 Listed for Rent $1,850 APPFOLIO
- 2023-10-15 Rental Removed $1,650 APPFOLIO
- 2023-10-11 Listed for Rent $1,650 APPFOLIO
Property tax history
+3.8%/yrLatest (2025): $2,010 · +0.0% YoY. Source: county tax records.
Cash-flow waterfall
monthlySold comps — $/sqft
last 12 mo · ≤1 miLoading sold comps…