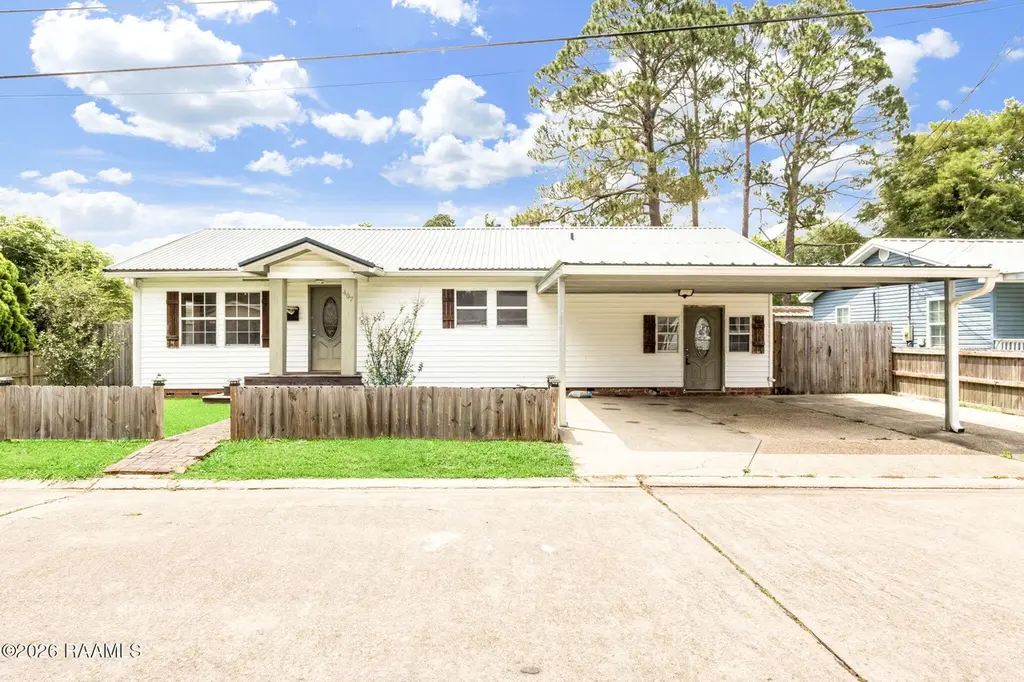
407 Donald St · New Iberia, LA
Flood risk 1/10 · Minimal
- FEMA flood zone
- X (unshaded)
- Chance of flooding over 30 yrs
- 0.0%
- Est. flood insurance / yr
- $507 – $1,088
Fire risk 1/10 · Minimal
- Est. fire insurance / yr
- $1,269 – $2,357
Heat risk 9/10 · Severe
- Hot days now (above 108°F)
- 7 days/yr
- Hot days in 30 yrs
- 22 days/yr
Wind risk 9/10 · Severe
- Chance of severe wind over 30 yrs
- 99.0%
Air-quality risk 2/10 · Minimal
- Unhealthy air days now
- 1 days/yr
- Unhealthy air days in 30 yrs
- 1 days/yr
Risk factors via First Street. Map © Google.
Why this score? — see what drove the B+ grade
The composite is a weighted blend of 9 inputs, each scored 0–100. Each bar is that input's sub-score; the figure is the points it added to the 100-point composite (weight × sub-score).
- Cash flow +30.0/30.0
- ARV discount +15.0/15.0
- DSCR +10.0/10.0
- 1% rule +8.8/10.0
- Livability +3.7/5.0
- Schools +3.2/10.0
- Rent growth +2.5/5.0
- Condition / age +2.5/5.0
- Appreciation +0.0/10.0
$120,000
🖨 Deal sheet 📄 Offer letter ✓ Due diligence
Listing remarks
Super cute home located in the heart of New Iberia. Perfect for first time home buyer.
Key facts
- 6,534 sq ft lot
- 2 parking spots
- Listed 35 days
Property features AI
Exterior
- Parking: 2 covered spaces; 2-car carport
- Utilities: Public sewer
- Home design: Single-family residence
- Construction: Vinyl siding and frame construction; Metal roof
- Exterior features: Wood fencing; Paved city street frontage
Interior
- Kitchen: Dishwasher; Gas cooktop; Refrigerator
- Flooring: Carpet; Tile
- Bathrooms: 1 full bathroom
- Heating & cooling: Central heating; Central air conditioning
- Interior features: Tile countertops; Aluminum window frames
- Laundry & utility: Washer hookup; Electric dryer hookup
Neighborhood map
What this means for you Summary
Snapshot
- This is a 3-bed/1.0-bath single-family listed at $120k.
Deal economics
- At list price, monthly cash flow is $565 ($7k/yr) — positive.
- The deal already cash-flows at list — no discount required.
- Meets the 1% rule at list price ($2k rent vs $120k).
- Recommended offer: $116k (3.0% below list) — sets the bar for market timing.
- Cap rate 11.9% vs local median 5.8% in New Iberia — top-decile yield for the area; either an underpriced asset or a hidden risk that comps aren't pricing in. Stress-test before assuming the spread holds.
Location & tenants
- Location reads 73/100 on livability (#33 in LA) — a middle-class / working-renter tenant base. Strengths: cost of living A+, housing A+, health & safety A+; Watch: commute D+, crime F, employment F.
- Iberia Parish (other): math 32% / reading 43% proficiency, ranked #27 of 98 in LA (top 28%) — families likely to look elsewhere, expect single-tenant / working-renter base with shorter leases; 66% free/reduced lunch — lower-income household profile, screen leases tightly.
- Zoned schools: North Lewis Elementary School (math 43% / reading 57%, grade D+, #125 of 646 statewide, top 20%, 520 students, 54% FRL); Belle Place Middle School (math 31% / reading 54%, grade D-, #57 of 218 statewide, top 26%, 413 students, 65% FRL); New Iberia Senior High School (math 35% / reading 52%, grade F, #64 of 265 statewide, top 24%, 1,449 students, 62% FRL).
- Market conditions: 141 active listings in the ZIP; 94 units permitted in Iberia Parish in 2024 (0 in 5+ unit buildings).
Forward outlook
- Local home prices are declining (-3.0%/yr); year-one equity from $830 of loan paydown is wiped out by about $4k of value loss. Plan a longer hold.
- Iberia County population projected to shrink 4% by 2050 — rents likely to lag national; underwrite the cash flow, not the appreciation.
- At projected returns (-3.0% appreciation + 3.0% rent growth), your $34k cash investment doubles in ~7 years — after that, you're playing with house money.
Negotiation context
- It's been on market 35 days — a 3% lower offer ($116k) is reasonable based on typical stale-listing flexibility.
Risks & watch-outs
- Climate carrying-cost: severe wind risk, 99% chance of damaging wind over 30y; extreme-heat days projected 7→22/yr by 2055 (HVAC capex compounding) — expect insurance premiums to compound above CPI over the hold.
Questions for the listing agent
- It's been on market 35 days. Have you received any prior offers? Is the seller open to a 3% concession, seller financing, or rate buy-down credit?
- Is there a deadline driving the sale (1031 exchange, divorce, estate, relocation)? That informs how much negotiation room exists.
- Schools are B-rated — typically a magnet for longer-tenancy family renters. What's the average tenant stay here, and is there a school-zone premium baked into asking?
- Crime grade is F in this area — have there been break-ins, vandalism, or insurance claims at this property in the last 3 years? What carrier currently insures it and at what premium?
- What's the average days-on-market for RENTAL listings here right now (not sales)? A rising rental-DOM trend means longer vacancies and softer asking-rent achievability than the comps imply.
- What's the recent tenant-quality profile in this submarket — average credit score on applications, eviction rate, late-payment / NSF rate, and stable-employment percentage? A property-management company in the area should have these aggregated.
- How much new for-sale + rental construction is in the pipeline within 1–3 miles? Heavy new supply typically softens prices + rents 12–24 months out; constrained supply supports both.
Investment metrics
- 1% rule
- 1.38% ✓
- Cap rate
- 11.95%
- Cash-on-cash
- 20.19%
- DSCR
- 1.90
- GRM
- 6.1
CMA / ARV
- ARV (median comp)
- $155,645
- List price
- $120,000
- Delta
- -22.90%
- Verdict
- UNDERPRICED
- Comps
- 20 within 1.0 mi
Show comp detail 12 sales within ~0.75 mi
| Address | Dist | Beds/Ba | Sqft | Sold | Price | $/sf | Match |
|---|---|---|---|---|---|---|---|
| 402 Azalea Dr | 0.03mi | 3/2.0 | 1,576 (+5%) | 1mo | $145,000 | $92 | 86 |
| 501 Ernest St | 0.12mi | 3/1.5 | 1,431 (-5%) | 5mo | $143,000 | $100 | 81 |
| 414 Ashton St | 0.33mi | 3/1.5 | 1,496 (-0%) | 5mo | $165,000 | $110 | 78 |
| 603 Missouri St | 0.42mi | 3/1.5 | 1,538 (+2%) | 0mo | $159,000 | $103 | 74 |
| 609 Missouri St | 0.42mi | 3/1.5 | 1,476 (-2%) | 8mo | $157,500 | $107 | 70 |
| 425 Missouri St | 0.45mi | 3/1.5 | 1,446 (-4%) | 7mo | $154,500 | $107 | 65 |
| 403 Mcilhenny St | 0.17mi | 3/2.0 | 1,282 (-14%) | 8mo | $155,000 | $121 | 57 |
| 307 Dodson St | 0.44mi | 3/2.0 | 1,641 (+9%) | 6mo | $150,000 | $91 | 55 |
| 708 Oswald St | 0.38mi | 3/1.5 | 1,275 (-15%) | 9mo | $148,000 | $116 | 48 |
| 227 Pollard Ave | 0.62mi | 3/2.0 | 1,650 (+10%) | 4mo | $219,500 | $133 | 48 |
| 612 Victory Dr | 0.38mi | 2/1.0 (-1) | 1,300 (-13%) | 9mo | $145,000 | $112 | 47 |
| 709 Leroy St | 0.39mi | 4/3.0 (+1) | 1,288 (-14%) | 2mo | $148,000 | $115 | 44 |
Match score weights: distance 35% · size 25% · config 20% · recency 20%. Top-matched comps best support the ARV.
Projected returns pro-forma
-3.0% appreciation · 3.0% rent growth · sell at horizon
- IRR
- 12.4%
- Equity multiple
- 1.49×
- Total profit
- $16,531
- Equity at exit
- $17,892
- IRR
- 21.3%
- Equity multiple
- 2.80×
- Total profit
- $60,637
- Equity at exit
- $10,375
Cash invested: $33,600 (down + closing). Projections, not guarantees.
Landlord ↔ Tenant lean methodology
- Overall (STATE)
- 90 Strongly Landlord-Friendly
- State Louisiana
- 90 Strongly Landlord-Friendly · R+12
- County
- — inherits STATE
- City
- — inherits STATE
ZIP-level market 70563
- Home prices YoY
- -35.0%
- Active inventory
- 141
- Price-to-rent
- 6.1×
Monthly cashflow live
- Estimated rent
- $1,652 medium interval (Pro) →
- Mortgage (P&I)
- −$629
- Tax from tax record
- −$61 /mo · $729/yr
- Insurance
- −$50
- HOA
- −$0
- Vacancy / Maint / Mgmt
- −$347
- Net cashflow
- $565
Break-even live
UW: 25.0% down · 7.5% · 30yr · 1.5% tax · 5.0% vac · 8.0% maint · 8.0% mgmt
Financing live
Cash to close
- Down payment
- $30,000
- Closing costs
- $3,600
- Reserves months
- —
- Total cash needed
- —
Loan-product check · same deal, 3 products live
Conventional
25% down · 7.5% · 30yr
- Down + closing
- —
- Monthly P&I
- —
- Monthly cashflow
- —
- DSCR
- —
- Eligible?
- —
Personal DTI + credit; lowest rate.
DSCR
20% down · 8.5% · 30yr
- Down + closing
- —
- Monthly P&I
- —
- Monthly cashflow
- —
- DSCR
- —
- Eligible?
- —
No personal income docs; deal must DSCR.
Hard money
10% down · 12.0% · 12mo
- Down + closing
- —
- Monthly P&I
- —
- Monthly cashflow
- —
- DSCR
- —
- Eligible?
- —
Short-term bridge; refi at stabilization.
Listing history 19 events
-
2026-06-17status $120,000 Pending 35 DOM
-
2026-06-17days on market $120,000 Active 35 DOM
-
2026-06-16days on market $120,000 Active 34 DOM
-
2026-06-15days on market $120,000 Active 33 DOM
-
2026-06-14days on market $120,000 Active 31 DOM
-
2026-06-13days on market $120,000 Active 30 DOM
-
2026-06-10days on market $120,000 Active 28 DOM
-
2026-06-09days on market $120,000 Active 27 DOM
-
2026-06-09price $120,000 Active 26 DOM
-
2026-06-08days on market $122,500 Active 26 DOM
-
2026-06-07days on market $122,500 Active 25 DOM
-
2026-06-05pricedays on market $122,500 Active 22 DOM
-
2026-06-03days on market $125,000 Active 21 DOM
-
2026-06-02days on market $125,000 Active 20 DOM
-
2026-06-01days on market $125,000 Active 19 DOM
-
2026-05-31days on market $125,000 Active 18 DOM
-
2026-05-30days on market $125,000 Active 17 DOM
-
2026-05-13$125,000 Active 87-char remark
-
2001-08-15soldstatus
ⓘ Source: listings_history table (triggers on properties + properties_extension) + one-shot
backfill from property_details.listing_events for pre-trigger history.
Tax reassessment forecast LA · Resets to sale price
- Current annual tax
- $729 · $61/mo
- Projected year-2 tax
- $729 · $61/mo
- Expected delta
- $0/yr ($0/mo · 0.0%)
ⓘ Screening estimate from a state-policy table — verify with the county assessor before closing.
Climate risk First Street
- Flood 1/10 Low FEMA zone X (unshaded) · 0% chance over 30 yrs
- Wildfire 1/10 Low
- Heat 9/10 Extreme 7 d/yr ≥108°F today · 22 d/yr by 30 yrs out
- Wind 9/10 Extreme 99% chance of damaging wind over 30 yrs
- Air quality 2/10 Low 1 unhealthy d/yr today · 1 by 30 yrs out
Nearby sold comps map
Loading sold comps map…
Walkable amenities ~0.75 mi
Loading nearby amenities…
Taxation est. · year 1
- Rental income
- $19,829
- − Mortgage interest
- −$6,722
- − Property taxes
- −$729
- − Insurance
- −$600
- − Repairs & maintenance
- −$1,586
- − Management
- −$1,586
- − Depreciation
- −$3,491
- Taxable income
- $5,114
- Est. tax owed @ 24.0%
- −$1,227
- After-tax cash flow
- $5,557/yr
For passive investors: Depreciation is non-cash, so a rental often shows a tax loss while cash-flowing — sheltering income. Rental losses are passive: they offset passive income freely, and up to $25,000/yr can offset ordinary (W-2) income if you actively participate and your MAGI is under $100k (phasing out to $0 by $150k); unused losses carry forward. On sale, claimed depreciation is recaptured at up to 25%, and gains may owe capital-gains tax (a 1031 exchange can defer both). Figures are a year-1 estimate at your 24.0% rate — not tax advice; consult a CPA.
Schools (NCES district)
- District
- Iberia Parish
- NCES district ID
- 2200720
- Math proficiency
- 32% ▼ -43.00%
- Reading proficiency
- 43% ▼ -35.00%
- Median HH income
- $43,289
- Composite
- 31.74/100
- National rank
- #5904
- State rank
- #27 of 98 in LA
Livability — New Iberia
- Score
- 73/100
- State rank
- #33
- US rank
- #5376
Category grades
Schools grade is shown separately in the Schools card above.
Census & demographics
- Census place
- New Iberia, LA
- Population (ZIP)
- 19,947
Population outlook (Iberia County) Hauer SSP2
- Today (2025)
- 74,632 people
- By 2030
- 74,368 · -0.4%
- By 2040
- 73,223 · -1.9%
- By 2050
- 71,728 · -3.9%
- By 2075
- 69,028 · -7.5%
- By 2100
- 65,018 · -12.9%
Race, ethnicity, and origin ACS 2023
- Neighborhood character
- Predominantly White (74%)
- Race & ethnicity
- White 74% Black 16% Two or more races 5% Hispanic / Latino 5% Asian 2%
- Common ancestry
- Lithuanian 19% Slovak 1% Romanian 1%
- Foreign-born
- 2% · Canada, China
- Languages at home
- 91% English-only · French/Haitian/Cajun 4% Spanish 2% Other Indo-European 1%
Political lean MEDSL · Iberia
- 2024 margin
- Solid R (+34.1) · D 32.4% · R 66.5% · Other 1.1%
- 2008→2024 swing
- -11.1pp toward R · 2008: -23.0pp · 2024: -34.1pp
- All cycles
- 2024: R+34.1 2020: R+31.2 2016: R+31.4 2012: R+26.2 2008: R+23.0
Not yet ingested
- Civics
- —
Market trends
- HPI YoY
- ▼ -78.52%
- Current HPI
- 146.1556
- Rent YoY
- —
- Metro
- —
- State GDP YoY
- ▲ 3.29%
- F500 in state
- 10
Industry mix (Fortune 500 HQ in LA)
| Industry | F500 HQs | Revenue |
|---|---|---|
| Telecommunications | 2 | $23B |
|
||
| Utilities | 1 | $12B |
|
||
| Wholesale / Distribution | 1 | $5B |
|
||
| Advertising | 1 | $2B |
|
||
Price history
-4.0% since first listed5 events — show timeline
- 2026-06-17 Pending — AcadianaMLS
- 2026-06-08 Price Changed $120,000 AcadianaMLS
- 2026-06-04 Price Changed $122,500 AcadianaMLS
- 2026-05-13 Listed $125,000 AcadianaMLS
- 2001-08-15 Sold (Public Records) — Public Records
Property tax history
-0.3%/yrLatest (2025): $729 · +2.0% YoY. Source: county tax records.
Cash-flow waterfall
monthlySold comps — $/sqft
last 12 mo · ≤1 miLoading sold comps…