 Duplex
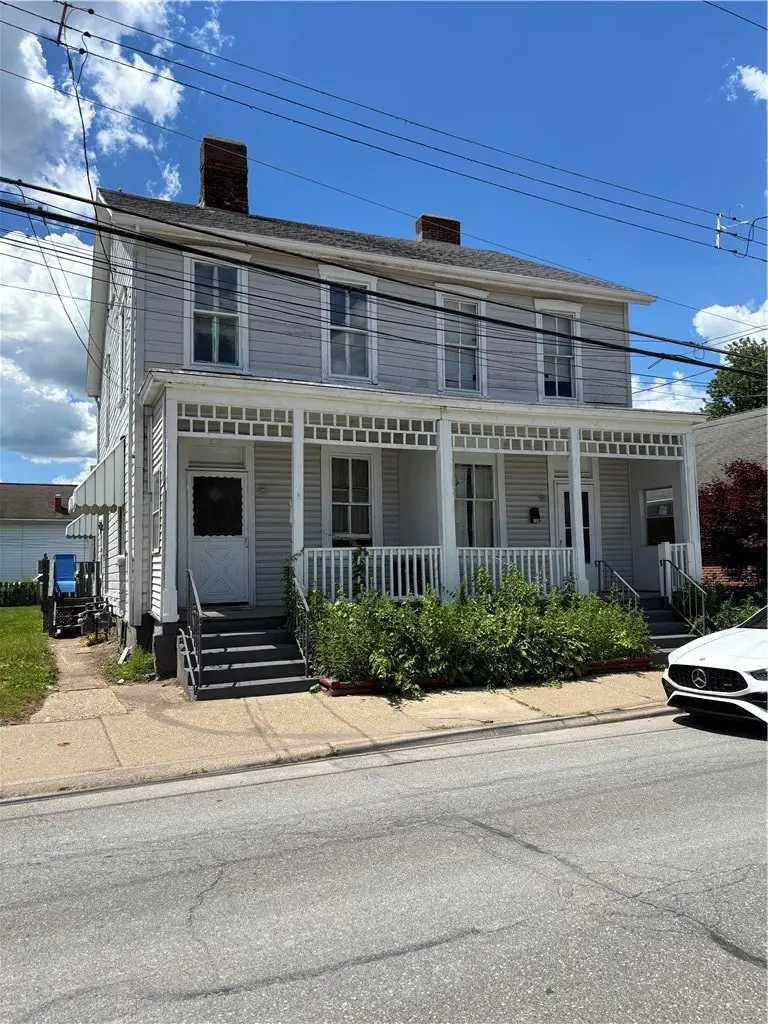
110 Main St · Coraopolis, PA
Flood risk 10/10 · Severe
- FEMA flood zone
- —
- Chance of flooding over 30 yrs
- 0.99%
- Est. flood insurance / yr
- $2,026 – $9,024
Fire risk 1/10 · Minimal
- Est. fire insurance / yr
- $511 – $949
Heat risk 4/10 · Minor
- Hot days now (above 97°F)
- 8 days/yr
- Hot days in 30 yrs
- 20 days/yr
Wind risk 2/10 · Minimal
- Chance of severe wind over 30 yrs
- —
Air-quality risk 3/10 · Minor
- Unhealthy air days now
- 2 days/yr
- Unhealthy air days in 30 yrs
- 3 days/yr
Risk factors via First Street. Map © Google.
Why this score? — see what drove the B- grade
The composite is a weighted blend of 9 inputs, each scored 0–100. Each bar is that input's sub-score; the figure is the points it added to the 100-point composite (weight × sub-score).
- Cash flow +30.0/30.0
- 1% rule +10.0/10.0
- DSCR +10.0/10.0
- ARV discount +7.5/15.0
- Livability +4.0/5.0
- Rent growth +3.5/5.0
- Schools +2.3/10.0
- Condition / age +2.2/5.0
- Appreciation +0.0/10.0
$159,000
🖨 Deal sheet 📄 Offer letter ✓ Due diligence
Multi-family units
County records classify this as Multi-Family (2-4 Unit). Listing-text estimate: 2 units. confirmed
Listing remarks
Investment opportunity in Coraopolis featuring a side-by-side duplex and a detached rear house, offering three rental units on one parcel with substantial value-add potential. This property presents an excellent opportunity for investors looking to build equity through renovations and increased rental income. The front duplex includes two spacious units, each offering 2 bedrooms, 1.5 bathrooms, formal dining rooms, and convenient main-floor laundry. The detached rear home features 1 bedroom, a private deck, and off-street parking. Located in an area with strong rental demand and convenient access to shopping, dining, and major highways, this property is well-positioned for long-term appreci
Key facts
- Private deck
- Detached rear house
- Off street parking
Tags
Property features AI
Exterior
- Parking: Off-street parking
- Utilities: Electricity available; Natural gas available; Public water available; Public sewer available
- Home design: 3-family property
- Construction: Frame construction; Asphalt roof
- Exterior features: Zoned for 3-family use; Public transportation nearby
Interior
- Bedrooms: One 1-bedroom unit; Two 2-bedroom units
- Bathrooms: One unit with 1 bathroom; Two units each with 2 total bathrooms (1 full and 1 half)
- Interior features: Full basement
Neighborhood map
What this means for you Summary
Snapshot
- This is a 2 × 2-bed/?-bath units multifamily listed at $159k. Condition is rated fair.
Deal economics
- At list price, monthly cash flow is $500 ($6k/yr) — positive. Per door: $250/mo.
- The deal already cash-flows at list — no discount required.
- Meets the 1% rule at list price ($3k rent vs $159k).
- Cap rate 13.5% vs local median 5.7% in Coraopolis — top-decile yield for the area; either an underpriced asset or a hidden risk that comps aren't pricing in. Stress-test before assuming the spread holds.
Location & tenants
- Location reads 80/100 on livability (#193 in PA, #1,621 nationally) — a professional / high-income tenant draw. Strengths: cost of living A+, housing A+, amenities B+.
- Cornell SD (suburban): math 16% / reading 39% proficiency, ranked #461 of 539 in PA (top 86%) — low school quality limits family demand, transient renter base, plan for 1-2y turnover; 66% free/reduced lunch — lower-income household profile, screen leases tightly.
- Market conditions: Rents rising fast (+4.1%/yr); 177 active listings in the ZIP; 14 comparable units currently listed for rent nearby; rentals leasing fast (median 8d on market — plan ~1-2 weeks tenant-placement turnaround); solid renter incomes; 2,996 units permitted in Allegheny County in 2024 (1,588 in 5+ unit buildings).
- This rent runs 31% of the median local income ($101k/yr) — at the standard rent-burdened threshold; future hikes will face affordability resistance.
Forward outlook
- Local home prices are declining (-3.0%/yr); year-one equity from $1k of loan paydown is wiped out by about $5k of value loss. Plan a longer hold.
- At projected returns (-3.0% appreciation + 4.1% rent growth), your $45k cash investment doubles in ~8 years — after that, you're playing with house money.
Negotiation context
- Only 11 days on market — expect competitive offers; lowballing is unlikely to land.
Risks & watch-outs
- Watch-outs: flood insurance adds $460/mo; built in 1900 — expect roof / HVAC / electrical / plumbing capex.
- Climate carrying-cost: severe flood risk — expect insurance premiums to compound above CPI over the hold.
Questions for the listing agent
- Can we see the unit-by-unit rent roll, current vacancy, and any below-market leases? What's the average tenancy length?
- What capital expenditures (roof, boiler, parking lot, exteriors) have been made in the last 5 years, and what's planned in the next 2?
- Have any recent inspections been done? Can we get a copy of the seller's disclosures and any deferred-maintenance estimates?
- Built in 1900 — when were the roof, HVAC, electrical panel, plumbing, and water heater last replaced?
- What's the actual annual flood-insurance premium (NFIP or private), and is the property in a SFHA with mandatory coverage?
- Is there a deadline driving the sale (1031 exchange, divorce, estate, relocation)? That informs how much negotiation room exists.
- What's the average days-on-market for RENTAL listings here right now (not sales)? A rising rental-DOM trend means longer vacancies and softer asking-rent achievability than the comps imply.
- What's the recent tenant-quality profile in this submarket — average credit score on applications, eviction rate, late-payment / NSF rate, and stable-employment percentage? A property-management company in the area should have these aggregated.
- How much new apartment / multifamily construction is in the pipeline within 1–3 miles? Heavy new supply (>2% of stock underway) typically softens rents 12–24 months out; light construction supports rent growth.
Investment metrics
- 1% rule
- 1.64% ✓
- Cap rate
- 13.54%
- Cash-on-cash
- 25.90%
- DSCR
- 2.15
- GRM
- 5.1
CMA / ARV
No comps found within radius.
Show comp detail 6 sales within ~0.75 mi
| Address | Dist | Beds/Ba | Sqft | Sold | Price | $/sf | Match |
|---|---|---|---|---|---|---|---|
| 509-511 Main St | 0.25mi | 4/2.0 | — | 18mo | $201,310 | — | 57 |
| 425 Mount Vernon | 0.58mi | 4/2.0 | — | 2mo | $147,000 | — | 55 |
| 517-519 Hiland Ave | 0.61mi | 4/2.0 | — | 3mo | $140,000 | — | 53 |
| 1213 State Ave | 0.43mi | 5/5.0 (+1) | — | 5mo | $270,000 | — | 50 |
| 1054 Vance Ave | 0.42mi | 3/2.0 (-1) | — | 11mo | $144,000 | — | 49 |
| 1514 5th Ave | 0.74mi | 4/2.0 | — | 1mo | $105,000 | — | 49 |
Match score weights: distance 35% · size 25% · config 20% · recency 20%. Top-matched comps best support the ARV.
Projected returns pro-forma
-3.0% appreciation · 4.13% rent growth · sell at horizon
- IRR
- 5.4%
- Equity multiple
- 1.21×
- Total profit
- $9,419
- Equity at exit
- $23,707
- IRR
- 16.2%
- Equity multiple
- 2.42×
- Total profit
- $63,128
- Equity at exit
- $13,747
Cash invested: $44,520 (down + closing). Projections, not guarantees.
Landlord ↔ Tenant lean methodology
- Overall (STATE)
- 62 Landlord-Friendly
- State Pennsylvania
- 62 Landlord-Friendly · EVEN
- County
- — inherits STATE
- City
- — inherits STATE
ZIP-level market 15108
- Rents YoY
- 4.1%
- Active inventory
- 177
- Price-to-rent
- 10.2×
Monthly cashflow live
- Estimated rent
- $2,607 high interval (Pro) →
- Mortgage (P&I)
- −$834
- Tax est. 1.5%
- −$199 /mo · $2,385/yr
- Insurance
- −$66
- Flood insurance flood zone
- −$460 /mo · $5,525/yr
- HOA
- −$0
- Vacancy / Maint / Mgmt
- −$547
- Net cashflow
- $500
Break-even live
2-unit breakdown (identical units grouped — click to expand)
| Units | Beds | Baths | Est. rent |
|---|---|---|---|
| 2× units | 2 | — | $2,606 |
| #1 | 2 | — | $1,303 |
| #2 | 2 | — | $1,303 |
| Total (2 units) | $2,607 | ||
UW: 25.0% down · 7.5% · 30yr · 1.5% tax · 5.0% vac · 8.0% maint · 8.0% mgmt
Financing live
Cash to close
- Down payment
- $39,750
- Closing costs
- $4,770
- Reserves months
- —
- Total cash needed
- —
Loan-product check · same deal, 3 products live
Conventional
25% down · 7.5% · 30yr
- Down + closing
- —
- Monthly P&I
- —
- Monthly cashflow
- —
- DSCR
- —
- Eligible?
- —
Personal DTI + credit; lowest rate.
DSCR
20% down · 8.5% · 30yr
- Down + closing
- —
- Monthly P&I
- —
- Monthly cashflow
- —
- DSCR
- —
- Eligible?
- —
No personal income docs; deal must DSCR.
Hard money
10% down · 12.0% · 12mo
- Down + closing
- —
- Monthly P&I
- —
- Monthly cashflow
- —
- DSCR
- —
- Eligible?
- —
Short-term bridge; refi at stabilization.
Rent comps 14 comps
| Address | Beds | Baths | Sqft | Rent | $/sqft | DOM | Units | Dist |
|---|---|---|---|---|---|---|---|---|
| 405 Main St Coraopolis, PA | 5.0 | 1.0 | 1492 | $1,740 | $1.17 | 43d | 1 | 0.15mi |
| 105 Broadway St Coraopolis, PA | 3.0 | 1.5 | 1672 | $1,799 | $1.08 | 7d | 1 | 0.33mi |
| 1704 State Ave Coraopolis, PA | 3.0 | 2.0 | 1456 | $1,500 | $1.03 | 7d | 1 | 0.88mi |
| 360 Hemlock Dr Coraopolis, PA | 3.0 | 1.0 | 1050 | $1,250 | $1.19 | 7d | 1 | 1.11mi |
| 1865 Montour St Coraopolis, PA | 3.0 | 1.5 | 1360 | $1,499 | $1.10 | 43d | 1 | 1.16mi |
| 1865 Montour St Coraopolis, PA | 3.0 | 1.5 | 1360 | $1,499 | $1.10 | 23d | 1 | 1.16mi |
| 1886 Anderson Ave Coraopolis, PA | 3.0 | 1.0 | 1014 | $1,750 | $1.73 | 1d | 1 | 1.18mi |
| 220 Graham St Unit 5/E Sewickley, PA | 3.0 | 1.0 | 2000 | $2,000 | $1.00 | 1d | 1 | 1.21mi |
| 634 Maple Ln Sewickley, PA | 3.0 | 2.5 | 1714 | $2,500 | $1.46 | 1d | 1 | 1.32mi |
| 911 Nevin Ave Sewickley, PA | 4.0 | 2.0 | 1536 | $2,950 | $1.92 | 10d | 1 | 1.32mi |
| 1669 Charlton Heights Rd Coraopolis, PA | 3.0 | 2.5 | 1738 | $2,500 | $1.44 | 17d | 1 | 1.40mi |
| 146 McCoy Place Rd Sewickley, PA | 3.0 | 2.0 | 1895 | $2,450 | $1.29 | 43d | 1 | 1.42mi |
| 732 Orchard Ter Sewickley, PA | 3.0 | 2.0 | 2090 | $3,300 | $1.58 | 1d | 1 | 1.42mi |
| 327 Chestnut St Sewickley, PA | 3.0 | 1.0 | 1100 | $2,750 | $2.50 | 1d | 1 | 1.44mi |
Listing history 8 events
-
2026-06-18days on market $159,000 Active 11 DOM
-
2026-06-17days on market $159,000 Active 10 DOM
-
2026-06-16days on market $159,000 Active 9 DOM
-
2026-06-15days on market $159,000 Active 8 DOM
-
2026-06-13days on market $159,000 Active 6 DOM
-
2026-06-09days on market $159,000 Active 2 DOM
-
2026-06-08remarks 699-char remark
-
2026-06-08$159,000 Active 1 DOM
ⓘ Source: listings_history table (triggers on properties + properties_extension) + one-shot
backfill from property_details.listing_events for pre-trigger history.
Climate risk First Street
- Flood 10/10 Extreme 99% chance over 30 yrs
- Wildfire 1/10 Low
- Heat 4/10 Moderate 8 d/yr ≥97°F today · 20 d/yr by 30 yrs out
- Wind 2/10 Low
- Air quality 3/10 Moderate 2 unhealthy d/yr today · 3 by 30 yrs out
Nearby sold comps map
Loading sold comps map…
Walkable amenities ~0.75 mi
Loading nearby amenities…
Taxation est. · year 1
- Rental income
- $31,284
- − Mortgage interest
- −$8,906
- − Property taxes
- −$2,385
- − Insurance
- −$6,320
- − Repairs & maintenance
- −$2,503
- − Management
- −$2,503
- − Depreciation
- −$4,625
- Taxable income
- $4,042
- Est. tax owed @ 24.0%
- −$970
- After-tax cash flow
- $5,034/yr
For passive investors: Depreciation is non-cash, so a rental often shows a tax loss while cash-flowing — sheltering income. Rental losses are passive: they offset passive income freely, and up to $25,000/yr can offset ordinary (W-2) income if you actively participate and your MAGI is under $100k (phasing out to $0 by $150k); unused losses carry forward. On sale, claimed depreciation is recaptured at up to 25%, and gains may owe capital-gains tax (a 1031 exchange can defer both). Figures are a year-1 estimate at your 24.0% rate — not tax advice; consult a CPA.
Condition & rehab AI · 14 photos
This property requires significant repairs and maintenance, including painting the exterior siding, replacing missing cabinetry and fixtures, and upgrading appliances. However, with these updates, it has the potential to become a valuable investment opportunity with increased rental income and resale value.
Repairs flagged
- Major Exposed subflooring in the kitchen — The subflooring is exposed, indicating significant damage and the need for full replacement.
- Major Missing cabinetry in the kitchen — The kitchen lacks cabinetry, which is a major functional issue and needs to be replaced.
- Major Peeling paint in bathrooms — The peeling paint indicates significant deterioration and the need for full repainting.
- Major Missing fixtures in bathrooms — The missing fixtures in the bathrooms are a major functional issue and need to be replaced.
- Major Exposed subflooring in the living room — The subflooring is exposed, indicating significant damage and the need for full replacement.
- Major Missing cabinetry in the living room — The living room lacks cabinetry, which is a major functional issue and needs to be replaced.
- Major Peeling paint in the living room — The peeling paint indicates significant deterioration and the need for full repainting.
- Major Missing fixtures in the living room — The missing fixtures in the living room are a major functional issue and need to be replaced.
Value-add opportunities
- Both Painting the exterior siding — Painting the exterior siding will improve the curb appeal and increase the property's value.
- Both Refrrigerator and other appliances — Upgrading the appliances will make the property more attractive to potential tenants and buyers.
- Both Landscaping and yard maintenance — A well-maintained yard and landscaping will improve the property's curb appeal and increase its value.
Renovation cost estimate screening
| Repair item | Severity | Est. cost |
|---|---|---|
| Exposed subflooring in the kitchen · The subflooring is exposed, indicating significant damage and the need for full replacement. | Major | $15,000–50,000 |
| Missing cabinetry in the kitchen · The kitchen lacks cabinetry, which is a major functional issue and needs to be replaced. | Major | $15,000–50,000 |
| Peeling paint in bathrooms · The peeling paint indicates significant deterioration and the need for full repainting. | Major | $15,000–50,000 |
| Missing fixtures in bathrooms · The missing fixtures in the bathrooms are a major functional issue and need to be replaced. | Major | $15,000–50,000 |
| Exposed subflooring in the living room · The subflooring is exposed, indicating significant damage and the need for full replacement. | Major | $15,000–50,000 |
| Missing cabinetry in the living room · The living room lacks cabinetry, which is a major functional issue and needs to be replaced. | Major | $15,000–50,000 |
| Peeling paint in the living room · The peeling paint indicates significant deterioration and the need for full repainting. | Major | $15,000–50,000 |
| Missing fixtures in the living room · The missing fixtures in the living room are a major functional issue and need to be replaced. | Major | $15,000–50,000 |
| Total estimated repair cost · 8 items | $120,000–400,000 |
Value-add ROI direction
- Both Painting the exterior siding — Painting the exterior siding will improve the curb appeal and increase the property's value. ↑
- Both Refrrigerator and other appliances — Upgrading the appliances will make the property more attractive to potential tenants and buyers. ↑
- Both Landscaping and yard maintenance — A well-maintained yard and landscaping will improve the property's curb appeal and increase its value. ↑
ⓘ Cost ranges are severity-bucket heuristics (US national rule-of-thumb). Get contractor quotes + a written scope before underwriting a rehab budget.
Schools (NCES district)
- District
- Cornell SD
- NCES district ID
- 4206810
- Math proficiency
- 16% ▼ -10.00%
- Reading proficiency
- 39% ▼ -8.00%
- Median HH income
- $36,558
- Composite
- 22.75/100
- National rank
- #8032
- State rank
- #461 of 539 in PA
Livability — Coraopolis
- Score
- 80/100
- State rank
- #193
- US rank
- #1621
Category grades
Schools grade is shown separately in the Schools card above.
Census & demographics
- Census place
- Coraopolis, PA
- County
- Allegheny County · 1,022,028 people
- City population
- 42,799
- Metro
- Pittsburgh, PA
- Population (ZIP)
- 42,799
- Household income
- $100,859
- Rent vs Own
- Severe rent burden
- 890.0
Population outlook (Allegheny County) Hauer SSP2
- Today (2025)
- 1,250,282 people
- By 2030
- 1,256,482 · +0.5%
- By 2040
- 1,256,318 · +0.5%
- By 2050
- 1,244,169 · -0.5%
- By 2075
- 1,197,693 · -4.2%
- By 2100
- 1,093,187 · -12.6%
Race, ethnicity, and origin ACS 2023
- Neighborhood character
- Predominantly White (85%)
- Race & ethnicity
- White 85% Black 5% Two or more races 5% Asian 4% Hispanic / Latino 2%
- Common ancestry
- Romanian 7% Subsaharan African 4% Slovak 2%
- Foreign-born
- 6% · Canada, Vietnam
- Languages at home
- 93% English-only · Spanish 2% Other Indo-European 1% Other Asian/Pacific 1%
Political lean MEDSL · Allegheny
- 2024 margin
- Strong D (+20.3) · D 59.7% · R 39.4%
- 2008→2024 swing
- +4.8pp toward D · 2008: 15.5pp · 2024: 20.3pp
- All cycles
- 2024: D+20.3 2020: D+20.4 2016: D+16.4 2012: D+14.4 2008: D+15.5
Not yet ingested
- Civics
- —
Market trends
- HPI YoY
- ▼ -220.09%
- Current HPI
- 250.7623
- Rent YoY
- ▲ 4.13%
- Metro
- Pittsburgh, PA
- State GDP YoY
- ▲ 1.68%
- F500 in state
- 34
Industry mix (Fortune 500 HQ in PA)
| Industry | F500 HQs | Revenue |
|---|---|---|
| Healthcare | 2 | $309B |
|
||
| Insurance | 2 | $27B |
|
||
| Telecommunications / Media | 1 | $124B |
|
||
| Industrial Distribution | 1 | $22B |
|
||
| Financial Services | 1 | $20B |
|
||
| Chemicals / Materials | 1 | $18B |
|
||
Price history
1 event — show timeline
- 2026-06-07 Listed $159,000 West Penn MLS
Cash-flow waterfall
monthlySold comps — $/sqft
last 12 mo · ≤1 miLoading sold comps…