170 Cumberland St · Altamont, TN
Flood risk 1/10 · Minimal
- FEMA flood zone
- X (unshaded)
- Chance of flooding over 30 yrs
- 0.0%
- Est. flood insurance / yr
- $507 – $1,088
Fire risk 6/10 · Moderate
- Est. fire insurance / yr
- $949 – $1,763
Heat risk 4/10 · Minor
- Hot days now (above 100°F)
- 7 days/yr
- Hot days in 30 yrs
- 21 days/yr
Wind risk 4/10 · Minor
- Chance of severe wind over 30 yrs
- 10.0%
Air-quality risk 3/10 · Minor
- Unhealthy air days now
- 2 days/yr
- Unhealthy air days in 30 yrs
- 2 days/yr
Risk factors via First Street. Map © Google.
Why this score? — see what drove the B- grade
The composite is a weighted blend of 9 inputs, each scored 0–100. Each bar is that input's sub-score; the figure is the points it added to the 100-point composite (weight × sub-score).
- Cash flow +26.4/30.0
- Appreciation +10.0/10.0
- DSCR +9.0/10.0
- ARV discount +7.5/15.0
- 1% rule +6.0/10.0
- Livability +2.8/5.0
- Rent growth +2.5/5.0
- Condition / age +2.5/5.0
- Schools +1.8/10.0
$120,000
🖨 Deal sheet 📄 Offer letter ✓ Due diligence
Listing remarks
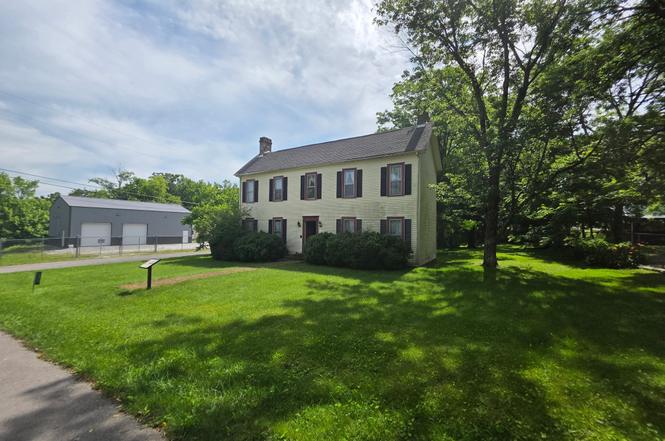
Rare opportunity in the heart of Altamont. Built in 1934 and full of historic-era character, this stately Cumberland Street home offers the size, setting, and presence that restoration buyers look for. Positioned on a prominent corner lot just off Main Street, the home features 6 bedrooms, 2 full baths, finished wood floors, and approx. 2,700 sq ft per agent measurement. This property needs significant work, but the bones, scale, curb appeal, and location create a compelling canvas for the right buyer. Investors may see strong upside for a thoughtful renovation and resale, while owner-occupants can imagine restoring a true Altamont classic into a one-of-a-kind residence. Located in Grundy C
Key facts
- Cumberland plateau
- Corner lot
- 1 acre lot
Tags
Property features AI
Exterior
- Parking: No covered or designated parking spaces listed
- Utilities: Public water; Public sewer; Water available
- Home design: Single-family residence; One level; Residential property
- Construction: Built with log, brick, stone and other materials; Approximate year built
- Exterior features: 1-acre lot; Pets allowed; Corner lot location
Interior
- Kitchen: No appliances listed
- Bedrooms: 6 bedrooms total, 4 on the main level
- Flooring: Wood flooring
- Bathrooms: 2 full bathrooms
- Heating & cooling: Central heating; Central air conditioning
- Interior features: Crawl space basement; Wood flooring
Neighborhood map
What this means for you Summary
Snapshot
- This is a 6-bed/2.0-bath single-family listed at $120k.
Deal economics
- At list price, monthly cash flow is $312 ($4k/yr) — positive.
- The deal already cash-flows at list — no discount required.
- Meets the 1% rule at list price ($1k rent vs $120k).
Location & tenants
- Location reads 55/100 on livability (#351 in TN) — a working-class tenant base; expect higher turnover. Strengths: cost of living A+; Watch: crime F, amenities F, commute F.
- Grundy County (rural): math 21% / reading 23% proficiency, ranked #110 of 139 in TN (top 79%) — low school quality limits family demand, transient renter base, plan for 1-2y turnover; 72% free/reduced lunch — lower-income household profile, screen leases tightly.
- Zoned schools: North Elementary (math 32% / reading 22%, grade F, #496 of 952 statewide, top 55%, 338 students, 0% FRL); Grundy County High School (math 8% / reading 17%, grade F, #259 of 332 statewide, top 79%, 534 students, 0% FRL) — zoned schools average 0% FRL vs 72% district-wide (72 pts lower); this property's tenant base skews higher-income than the district average.
- Market conditions: 42 active listings in the ZIP; 16 units permitted in Grundy County in 2024 (0 in 5+ unit buildings).
Forward outlook
- In year one you build about $13k of equity ($830 loan paydown + $12k appreciation (10.0% local appreciation)).
- Grundy County population projected at -24% by 2050 — secular population decline; favor cash flow + early exit over multi-decade hold.
- At projected returns (10.0% appreciation + 3.0% rent growth), your $34k cash investment doubles in ~2 years — after that, you're playing with house money.
- By year 3, paydown + projected appreciation supports a ~$32k cash-out refi (75% LTV) — recoverable capital for the next deal without selling this one.
Negotiation context
- Only 5 days on market — expect competitive offers; lowballing is unlikely to land.
Risks & watch-outs
- Watch-outs: built in 1934 — expect roof / HVAC / electrical / plumbing capex.
- Climate carrying-cost: major wildfire risk — expect insurance premiums to compound above CPI over the hold.
Questions for the listing agent
- Built in 1934 — when were the roof, HVAC, electrical panel, plumbing, and water heater last replaced?
- Is there a deadline driving the sale (1031 exchange, divorce, estate, relocation)? That informs how much negotiation room exists.
- Schools are F-rated, which usually means shorter tenancies and higher turnover. Who's the typical renter profile here, and what's been the actual vacancy rate?
- Crime grade is F in this area — have there been break-ins, vandalism, or insurance claims at this property in the last 3 years? What carrier currently insures it and at what premium?
- What's the average days-on-market for RENTAL listings here right now (not sales)? A rising rental-DOM trend means longer vacancies and softer asking-rent achievability than the comps imply.
- What's the recent tenant-quality profile in this submarket — average credit score on applications, eviction rate, late-payment / NSF rate, and stable-employment percentage? A property-management company in the area should have these aggregated.
- How much new for-sale + rental construction is in the pipeline within 1–3 miles? Heavy new supply typically softens prices + rents 12–24 months out; constrained supply supports both.
Investment metrics
- 1% rule
- 1.10% ✓
- Cap rate
- 9.41%
- Cash-on-cash
- 11.13%
- DSCR
- 1.50
- GRM
- 7.6
CMA / ARV
No comps found within radius.
Projected returns pro-forma
10.0% appreciation · 3.0% rent growth · sell at horizon
- IRR
- 32.4%
- Equity multiple
- 3.53×
- Total profit
- $85,169
- Equity at exit
- $108,106
- IRR
- 28.0%
- Equity multiple
- 8.00×
- Total profit
- $235,108
- Equity at exit
- $233,134
Cash invested: $33,600 (down + closing). Projections, not guarantees.
Landlord ↔ Tenant lean methodology
- Overall (STATE)
- 87 Strongly Landlord-Friendly
- State Tennessee
- 87 Strongly Landlord-Friendly · R+13
- County
- — inherits STATE
- City
- — inherits STATE
ZIP-level market 37301
- Home prices YoY
- 2.7%
- Active inventory
- 42
- Price-to-rent
- 7.6×
Monthly cashflow live
- Estimated rent
- $1,316 medium interval (Pro) →
- Mortgage (P&I)
- −$629
- Tax from tax record
- −$48 /mo · $580/yr
- Insurance
- −$50
- HOA
- −$0
- Vacancy / Maint / Mgmt
- −$276
- Net cashflow
- $312
Break-even live
UW: 25.0% down · 7.5% · 30yr · 1.5% tax · 5.0% vac · 8.0% maint · 8.0% mgmt
Financing live
Cash to close
- Down payment
- $30,000
- Closing costs
- $3,600
- Reserves months
- —
- Total cash needed
- —
Loan-product check · same deal, 3 products live
Conventional
25% down · 7.5% · 30yr
- Down + closing
- —
- Monthly P&I
- —
- Monthly cashflow
- —
- DSCR
- —
- Eligible?
- —
Personal DTI + credit; lowest rate.
DSCR
20% down · 8.5% · 30yr
- Down + closing
- —
- Monthly P&I
- —
- Monthly cashflow
- —
- DSCR
- —
- Eligible?
- —
No personal income docs; deal must DSCR.
Hard money
10% down · 12.0% · 12mo
- Down + closing
- —
- Monthly P&I
- —
- Monthly cashflow
- —
- DSCR
- —
- Eligible?
- —
Short-term bridge; refi at stabilization.
Listing history 6 events
-
2026-06-19days on market $120,000 Active 5 DOM
-
2026-06-18days on market $120,000 Active 4 DOM
-
2026-06-17days on market $120,000 Active 3 DOM
-
2026-06-16days on market $120,000 Active 2 DOM
-
2026-06-15remarks 699-char remark
-
2026-06-15$120,000 Active 1 DOM
ⓘ Source: listings_history table (triggers on properties + properties_extension) + one-shot
backfill from property_details.listing_events for pre-trigger history.
Tax reassessment forecast TN · Resets to sale price
- Current annual tax
- $580 · $48/mo
- Projected year-2 tax
- $852 · $71/mo
- Expected delta
- +$272/yr (+$23/mo · 46.9%)
ⓘ Screening estimate from a state-policy table — verify with the county assessor before closing.
Climate risk First Street
- Flood 1/10 Low FEMA zone X (unshaded) · 0% chance over 30 yrs
- Wildfire 6/10 Major
- Heat 4/10 Moderate 7 d/yr ≥100°F today · 21 d/yr by 30 yrs out
- Wind 4/10 Moderate 10% chance of damaging wind over 30 yrs
- Air quality 3/10 Moderate 2 unhealthy d/yr today · 2 by 30 yrs out
Nearby sold comps map
Loading sold comps map…
Walkable amenities ~0.75 mi
Loading nearby amenities…
Taxation est. · year 1
- Rental income
- $15,788
- − Mortgage interest
- −$6,722
- − Property taxes
- −$580
- − Insurance
- −$600
- − Repairs & maintenance
- −$1,263
- − Management
- −$1,263
- − Depreciation
- −$3,491
- Taxable income
- $1,869
- Est. tax owed @ 24.0%
- −$449
- After-tax cash flow
- $3,293/yr
For passive investors: Depreciation is non-cash, so a rental often shows a tax loss while cash-flowing — sheltering income. Rental losses are passive: they offset passive income freely, and up to $25,000/yr can offset ordinary (W-2) income if you actively participate and your MAGI is under $100k (phasing out to $0 by $150k); unused losses carry forward. On sale, claimed depreciation is recaptured at up to 25%, and gains may owe capital-gains tax (a 1031 exchange can defer both). Figures are a year-1 estimate at your 24.0% rate — not tax advice; consult a CPA.
Schools (NCES district)
- District
- Grundy County
- NCES district ID
- 4701530
- Math proficiency
- 21% ▼ -4.00%
- Reading proficiency
- 23% ▼ -3.00%
- Median HH income
- $28,948
- Composite
- 17.56/100
- National rank
- #9044
- State rank
- #110 of 139 in TN
Livability — Altamont
- Score
- 55/100
- State rank
- #351
- US rank
- #23154
Category grades
Schools grade is shown separately in the Schools card above.
Census & demographics
- Census place
- Altamont, TN
- City population
- 913
- Population (ZIP)
- 1,319
Population outlook (Grundy County) Hauer SSP2
- Today (2025)
- 12,660 people
- By 2030
- 12,088 · -4.5%
- By 2040
- 10,879 · -14.1%
- By 2050
- 9,666 · -23.6%
- By 2075
- 7,126 · -43.7%
- By 2100
- 4,941 · -61.0%
Race, ethnicity, and origin ACS 2023
- Neighborhood character
- Predominantly White (96%)
- Race & ethnicity
- White 96% Two or more races 2% Black 2%
- Common ancestry
- Slovak 5% Iranian 1% Serbian 1%
- Foreign-born
- 0%
Political lean MEDSL · Grundy
- 2024 margin
- Solid R (+69.3) · D 15.0% · R 84.3%
- 2008→2024 swing
- -56.5pp toward R · 2008: -12.8pp · 2024: -69.3pp
- All cycles
- 2024: R+69.3 2020: R+65.2 2016: R+55.3 2012: R+20.5 2008: R+12.8
Not yet ingested
- Civics
- —
Market trends
- HPI YoY
- ▲ 10.09%
- Current HPI
- 380.5799
- Rent YoY
- —
- Metro
- —
- State GDP YoY
- ▲ 2.78%
- F500 in state
- 22
Industry mix (Fortune 500 HQ in TN)
| Industry | F500 HQs | Revenue |
|---|---|---|
| Healthcare | 3 | $91B |
|
||
| Retail | 3 | $72B |
|
||
| Transportation / Logistics | 1 | $88B |
|
||
| Paper / Packaging | 1 | $19B |
|
||
| Insurance | 1 | $13B |
|
||
| Energy | 1 | $12B |
|
||
Price history
+0.0% since first listed2 events — show timeline
- 2026-06-15 Listed $120,000 REALTRACS as Distributed by MLS Grid
- 2026-06-14 Coming Soon $120,000 REALTRACS as Distributed by MLS Grid
Property tax history
+3.2%/yrLatest (2025): $580 · +0.0% YoY. Source: county tax records.
Cash-flow waterfall
monthlySold comps — $/sqft
last 12 mo · ≤1 miLoading sold comps…