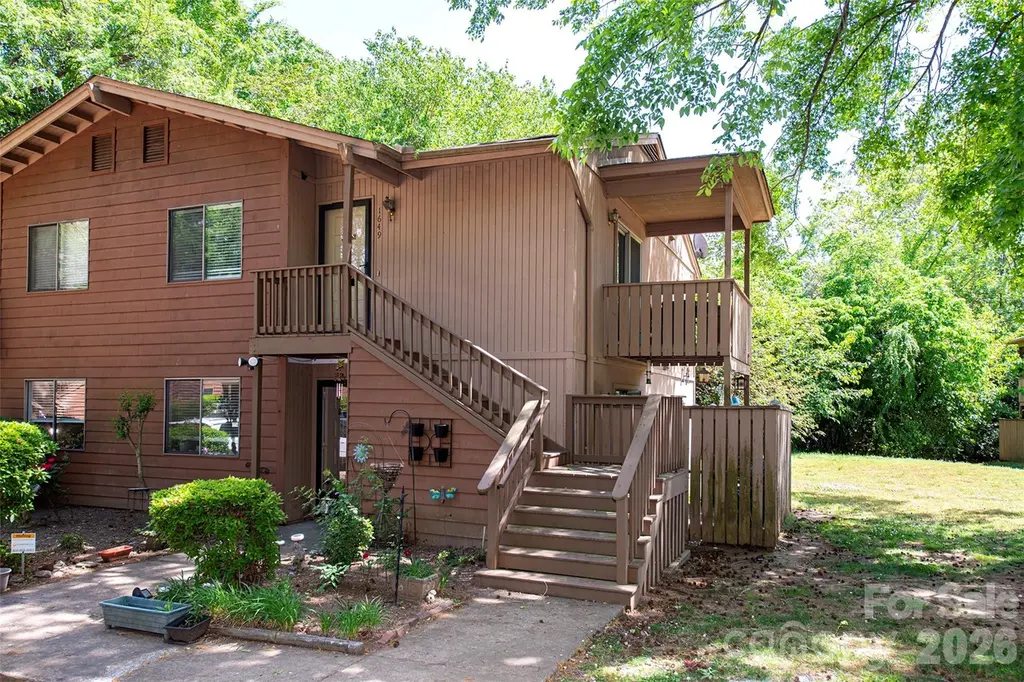
1649 Cedarview Ct · Rock Hill, SC
Flood risk 4/10 · Minor
- FEMA flood zone
- X (shaded)
- Chance of flooding over 30 yrs
- 0.22%
- Est. flood insurance / yr
- $507 – $1,088
Fire risk 2/10 · Minimal
- Est. fire insurance / yr
- $783 – $1,453
Heat risk 6/10 · Moderate
- Hot days now (above 105°F)
- 7 days/yr
- Hot days in 30 yrs
- 16 days/yr
Wind risk 6/10 · Moderate
- Chance of severe wind over 30 yrs
- 27.0%
Air-quality risk 3/10 · Minor
- Unhealthy air days now
- 3 days/yr
- Unhealthy air days in 30 yrs
- 3 days/yr
Risk factors via First Street. Map © Google.
Why this score? — see what drove the D- grade
The composite is a weighted blend of 9 inputs, each scored 0–100. Each bar is that input's sub-score; the figure is the points it added to the 100-point composite (weight × sub-score).
- Cash flow +12.3/30.0
- ARV discount +7.5/15.0
- 1% rule +4.3/10.0
- DSCR +3.6/10.0
- Schools +3.5/10.0
- Livability +3.5/5.0
- Condition / age +2.5/5.0
- Rent growth +2.4/5.0
- Appreciation +0.0/10.0
$147,900
🖨 Deal sheet 📄 Offer letter ✓ Due diligence
Listing remarks
Well-maintained and move-in ready condo featuring generously sized bedrooms and thoughtful updates throughout. Nestled in a quiet shaded community, this home offers a comfortable and inviting setting with a balance of privacy and convenience. The HOA takes care of exterior maintenance and is repainting the entire exterior this year. The Seller is paying the HOA Assessment for that to ease The Buying process. The home was updated with white cabinets, stainless steel appliances, Quartz Countertop in Kitchen, and Luxury Vinyl Plank floors. New HVAC in 2025.
Key facts
- Easy i-77 access
- Luxury vinyl plank
- Covered side porch
Tags
Property features AI
Finance
- HOA & community: HOA managed by First Choice Property Management; Mandatory HOA; Monthly association fee of $175; Pets allowed; Restrictions: Architectural review; Deed (CC & R)
Exterior
- Parking: Assigned parking (1 space); 1 open parking space
- Security: Carbon monoxide detector(s); Smoke detector(s)
- Utilities: City water; Public sewer; Cable available; Electricity connected; Wired internet available
- Home design: Condominium (residential); One level; Entry on level 2; Zoned MF-15
- Construction: Site-built construction; Hardboard siding; Slab foundation
- Exterior features: Balcony; Lawn maintenance provided; Private maintained road; Concrete/paved road
Interior
- Kitchen: Dishwasher; Electric cooktop; Electric oven; Electric range; Refrigerator
- Bedrooms: 2 bedrooms (both on the upper level)
- Flooring: Carpet; Vinyl
- Bathrooms: 1 full bathroom
- Heating & cooling: Central heating; Central air
- Interior features: Attic pull-down stairs; Wet bar; Sliding doors
- Laundry & utility: Washer/Dryer included; Electric dryer hookup; In-hall laundry closet
Neighborhood map
What this means for you Summary
Snapshot
- This is a 2-bed/1.0-bath condo listed at $148k.
Deal economics
- At list price, monthly cash flow is $-28 ($-330/yr) — negative.
- To cash-flow at today's rent, offer at most $143k (3.3% below list).
- To meet the 1% rule (rent ≥ 1% of price), the offer needs to be $137k (7.1% below list).
- Recommended offer: $137k (7.1% below list) — sets the bar for 1% rule.
- Cap rate 6.1% vs local median 3.4% in Rock Hill — top-decile yield for the area; either an underpriced asset or a hidden risk that comps aren't pricing in. Stress-test before assuming the spread holds.
Location & tenants
- Location reads 70/100 on livability (#62 in SC) — a middle-class / working-renter tenant base. Strengths: cost of living A+, housing A+, health & safety A+; Watch: schools D+, employment D+, crime D-.
- York 03 (urban): math 36% / reading 47% proficiency, ranked #32 of 80 in SC (top 40%) — families likely to look elsewhere, expect single-tenant / working-renter base with shorter leases.
- Market conditions: Rents soft (-0.2%/yr); 370 active listings in the ZIP; 22 comparable units currently listed for rent nearby; rentals at typical pace (median 15d on market — plan ~3-4 weeks tenant-placement turnaround); solid renter incomes; 2,550 units permitted in York County in 2024 (350 in 5+ unit buildings).
Forward outlook
- Local home prices are declining (-3.0%/yr); year-one equity from $1k of loan paydown is wiped out by about $4k of value loss. Plan a longer hold.
- York County population projected at +44% by 2050 — long-run rental-demand tailwind backs the buy-and-hold thesis.
Negotiation context
- It's been on market 45 days — a 3% lower offer ($143k) is reasonable based on typical stale-listing flexibility.
Risks & watch-outs
- Climate carrying-cost: major wind risk, 27% chance of damaging wind over 30y; extreme-heat days projected 7→16/yr by 2055 (HVAC capex compounding) — expect insurance premiums to compound above CPI over the hold.
Questions for the listing agent
- What do current leases actually rent for vs. the listed asking? Can we see a recent rent roll and the last 12 months of T-12 income?
- It's been on market 45 days. Have you received any prior offers? Is the seller open to a 7% concession, seller financing, or rate buy-down credit?
- What does the HOA fee cover, when was the last increase, and are there any pending special assessments or reserve-fund shortfalls?
- Any open or pending special assessments — roof, HVAC, plumbing, elevator, façade? What's the per-unit balance and payoff schedule, and is the seller paying it off at close or rolling it to the buyer?
- Is there a deadline driving the sale (1031 exchange, divorce, estate, relocation)? That informs how much negotiation room exists.
- Schools are D-rated, which usually means shorter tenancies and higher turnover. Who's the typical renter profile here, and what's been the actual vacancy rate?
- Crime grade is D in this area — have there been break-ins, vandalism, or insurance claims at this property in the last 3 years? What carrier currently insures it and at what premium?
- The area grade is low — what's the realistic commute time and amenity access for the typical tenant pool here? Any planned neighborhood developments (good or bad) we should know about?
- What's the average days-on-market for RENTAL listings here right now (not sales)? A rising rental-DOM trend means longer vacancies and softer asking-rent achievability than the comps imply.
- What's the recent tenant-quality profile in this submarket — average credit score on applications, eviction rate, late-payment / NSF rate, and stable-employment percentage? A property-management company in the area should have these aggregated.
- How much new apartment / multifamily construction is in the pipeline within 1–3 miles? Heavy new supply (>2% of stock underway) typically softens rents 12–24 months out; light construction supports rent growth.
Investment metrics
- 1% rule
- 0.93% ✗
- Cap rate
- 6.07%
- Cash-on-cash
- -0.80%
- DSCR
- 0.96
- GRM
- 9.0
CMA / ARV
No comps found within radius.
Projected returns pro-forma
-3.0% appreciation · 0.0% rent growth · sell at horizon
- IRR
- -21.3%
- Equity multiple
- 0.28×
- Total profit
- $-29,669
- Equity at exit
- $22,052
- IRR
- -25.2%
- Equity multiple
- -0.05×
- Total profit
- $-43,343
- Equity at exit
- $12,788
Cash invested: $41,412 (down + closing). Projections, not guarantees.
Landlord ↔ Tenant lean methodology
- Overall (STATE)
- 90 Strongly Landlord-Friendly
- State South Carolina
- 90 Strongly Landlord-Friendly · R+6
- County
- — inherits STATE
- City
- — inherits STATE
ZIP-level market 29732
- Rents YoY
- -0.2%
- Active inventory
- 370
- Price-to-rent
- 9.0×
Monthly cashflow live
- Estimated rent
- $1,374 high interval (Pro) →
- Mortgage (P&I)
- −$776
- Tax from tax record
- −$101 /mo · $1,210/yr
- Insurance
- −$62
- HOA
- −$175
- Vacancy / Maint / Mgmt
- −$289
- Net cashflow
- $-28
Break-even live
UW: 25.0% down · 7.5% · 30yr · 1.5% tax · 5.0% vac · 8.0% maint · 8.0% mgmt
Financing live
Cash to close
- Down payment
- $36,975
- Closing costs
- $4,437
- Reserves months
- —
- Total cash needed
- —
Loan-product check · same deal, 3 products live
Conventional
25% down · 7.5% · 30yr
- Down + closing
- —
- Monthly P&I
- —
- Monthly cashflow
- —
- DSCR
- —
- Eligible?
- —
Personal DTI + credit; lowest rate.
DSCR
20% down · 8.5% · 30yr
- Down + closing
- —
- Monthly P&I
- —
- Monthly cashflow
- —
- DSCR
- —
- Eligible?
- —
No personal income docs; deal must DSCR.
Hard money
10% down · 12.0% · 12mo
- Down + closing
- —
- Monthly P&I
- —
- Monthly cashflow
- —
- DSCR
- —
- Eligible?
- —
Short-term bridge; refi at stabilization.
Rent comps 22 comps
| Address | Beds | Baths | Sqft | Rent | $/sqft | DOM | Units | Dist |
|---|---|---|---|---|---|---|---|---|
| 1622 Cedarview Ct Rock Hill, SC | 2.0 | 1.0 | 788 | $1,250 | $1.59 | 16d | 1 | 0.08mi |
| 1825 Heather Sq Rock Hill, SC | 1.0–3.0 | 1.0–1.5 | 875 | $1,362 | $1.56 | 23d | 1 | 0.09mi |
| 1364 Riverview Rd Rock Hill, SC | 1.0–3.0 | 1.0–2.0 | 1025 | $1,362 | $1.33 | 23d | 1 | 0.14mi |
| 1304 Stoneypointe Dr Rock Hill, SC | 1.0 | 1.0 | 744 | $1,275 | $1.71 | 23d | 1 | 0.18mi |
| 1817 Paces River Ave Rock Hill, SC | 2.0 | 2.0 | 1003 | $1,259 | $1.26 | 3d | 1 | 0.52mi |
| 1817 Paces River Ave Rock Hill, SC | 1.0 | 1.0 | 596 | $1,104 | $1.85 | 1d | 1 | 0.52mi |
| 1817 Paces River Ave Rock Hill, SC | 2.0 | 1.0 | 915 | $1,224 | $1.34 | 23d | 1 | 0.52mi |
| 1817 Paces River Ave Rock Hill, SC | 1.0 | 1.0 | 773 | $1,169 | $1.51 | 20d | 1 | 0.52mi |
| 1914 Paces Landing Ave Rock Hill, SC | 1.0–2.0 | 1.0–2.0 | 835 | $1,299 | $1.55 | 2d | 4 | 0.71mi |
| 2215 Rosewood Dr Rock Hill, SC | 3.0 | 1.0 | 1058 | $2,050 | $1.94 | 1d | 1 | 0.78mi |
| 793 Patriot Pkwy Rock Hill, SC | 1.0 | 1.0 | 750 | $1,360 | $1.81 | 3d | 1 | 0.93mi |
| 793 Patriot Pkwy Rock Hill, SC | 2.0 | 2.0 | 1080 | $1,565 | $1.45 | 23d | 1 | 0.93mi |
| 793 Patriot Pkwy Rock Hill, SC | 2.0 | 2.0 | 1080 | $1,500 | $1.39 | 2d | 1 | 0.93mi |
| 2361 Eden Ter Rock Hill, SC | 2.0 | 2.0 | 1025 | $1,399 | $1.36 | 14d | 1 | 0.99mi |
| 2361 Eden Ter Rock Hill, SC | 2.0 | 2.0 | 1012 | $1,358 | $1.34 | 19d | 6 | 0.99mi |
| 2361 Eden Ter Rock Hill, SC | 2.0 | 2.0 | 1025 | $1,309 | $1.28 | 2d | 1 | 0.99mi |
| 752 Patriot Pkwy Rock Hill, SC | 3.0 | 1.0–2.0 | 708 | $1,377 | $1.94 | 1d | 21 | 1.04mi |
| 2400 Celanese Rd Rock Hill, SC | 1.0–3.0 | 1.0–2.0 | 998 | $1,375 | $1.38 | 23d | 1 | 1.13mi |
| 1800 Marett Blvd Ext Rock Hill, SC | 1.0–3.0 | 1.0–2.0 | 964 | $1,538 | $1.59 | 3d | 16 | 1.19mi |
| 517 Pink Moon Dr Rock Hill, SC | 1.0–2.0 | 1.0–2.0 | 947 | $1,727 | $1.82 | 1d | 18 | 1.19mi |
| 2600 Celanese Rd Rock Hill, SC | 2.0 | 1.5 | 1065 | $1,422 | $1.34 | 1d | 4 | 1.32mi |
| 1674 Eagles Pl Unit 1 Rock Hill, SC | 2.0 | 2.0 | 1000 | $1,240 | $1.24 | 23d | 1 | 1.41mi |
HOA detail condo
- Monthly dues
- $175 · $2,100/yr
- Likely covers
- exterior maint.
- Assessments
- None detected in remarks — confirm with the listing agent.
Listing history 20 events
-
2026-06-18days on market $147,900 Active 45 DOM
-
2026-06-17days on market $147,900 Active 44 DOM
-
2026-06-16days on market $147,900 Active 43 DOM
-
2026-06-15days on market $147,900 Active 42 DOM
-
2026-06-13remarks 560-char remark
-
2026-06-13days on market $147,900 Active 40 DOM
-
2026-06-09days on market $147,900 Active 36 DOM
-
2026-06-08days on market $147,900 Active 35 DOM
-
2026-06-07days on market $147,900 Active 34 DOM
-
2026-06-04days on market $147,900 Active 31 DOM
-
2026-06-03days on market $147,900 Active 30 DOM
-
2026-06-02days on market $147,900 Active 29 DOM
-
2026-06-01days on market $147,900 Active 28 DOM
-
2026-06-01price $147,900 Active 27 DOM
-
2026-05-31days on market $150,000 Active 27 DOM
-
2026-05-18price $150,000
-
2026-05-04$155,000 Active
-
2022-05-02soldstatus $145,330
-
2006-06-30soldstatus $52,000
-
1997-01-05soldstatus $43,500
ⓘ Source: listings_history table (triggers on properties + properties_extension) + one-shot
backfill from property_details.listing_events for pre-trigger history.
Tax reassessment forecast SC · Resets to sale price
- Current annual tax
- $1,210 · $101/mo
- Projected year-2 tax
- $1,210 · $101/mo
- Expected delta
- $0/yr ($0/mo · 0.0%)
ⓘ Screening estimate from a state-policy table — verify with the county assessor before closing.
Climate risk First Street
- Flood 4/10 Moderate FEMA zone X (shaded) · 22% chance over 30 yrs
- Wildfire 2/10 Low
- Heat 6/10 Major 7 d/yr ≥105°F today · 16 d/yr by 30 yrs out
- Wind 6/10 Major 27% chance of damaging wind over 30 yrs
- Air quality 3/10 Moderate 3 unhealthy d/yr today · 3 by 30 yrs out
Nearby sold comps map
Loading sold comps map…
Walkable amenities ~0.75 mi
Loading nearby amenities…
Taxation est. · year 1
- Rental income
- $16,490
- − Mortgage interest
- −$8,285
- − Property taxes
- −$1,210
- − Insurance
- −$740
- − Repairs & maintenance
- −$1,319
- − Management
- −$1,319
- − HOA
- −$2,100
- − Depreciation
- −$4,303
- Taxable loss
- −$2,786
- Est. tax savings @ 24.0%
- +$669
- After-tax cash flow
- $338/yr
For passive investors: Depreciation is non-cash, so a rental often shows a tax loss while cash-flowing — sheltering income. Rental losses are passive: they offset passive income freely, and up to $25,000/yr can offset ordinary (W-2) income if you actively participate and your MAGI is under $100k (phasing out to $0 by $150k); unused losses carry forward. On sale, claimed depreciation is recaptured at up to 25%, and gains may owe capital-gains tax (a 1031 exchange can defer both). Figures are a year-1 estimate at your 24.0% rate — not tax advice; consult a CPA.
Schools (NCES district)
- District
- York 03
- NCES district ID
- 4503870
- Math proficiency
- 36% ▼ -8.00%
- Reading proficiency
- 47% ▲ 3.00%
- Median HH income
- $47,570
- Composite
- 35.46/100
- National rank
- #4928
- State rank
- #32 of 80 in SC
Livability — Rock Hill
- Score
- 70/100
- State rank
- #62
- US rank
- #7573
Category grades
Schools grade is shown separately in the Schools card above.
Census & demographics
- Census place
- Rock Hill, SC
- County
- York County · 281,758 people
- City population
- 115,874
- Metro
- Charlotte-Concord-Gastonia, NC-SC
- Population (ZIP)
- 57,675
- Household income
- $84,937
- Rent vs Own
- Severe rent burden
- 1774.0
Population outlook (York County) Hauer SSP2
- Today (2025)
- 307,757 people
- By 2030
- 335,979 · +9.2%
- By 2040
- 391,378 · +27.2%
- By 2050
- 443,234 · +44.0%
- By 2075
- 557,102 · +81.0%
- By 2100
- 625,837 · +103.4%
Race, ethnicity, and origin ACS 2023
- Neighborhood character
- Predominantly White (66%)
- Race & ethnicity
- White 66% Black 21% Hispanic / Latino 7% Two or more races 6% Asian 2%
- Hispanic origin (detail)
- Mexican 3%
- Common ancestry
- Serbian 4% Slovak 3% Romanian 2%
- Foreign-born
- 5% · Canada
- Languages at home
- 92% English-only · Spanish 5% Other Indo-European 1%
Political lean MEDSL · York
- 2024 margin
- R (+19.1) · D 39.7% · R 58.8% · Other 1.5%
- 2008→2024 swing
- -1.4pp toward R · 2008: -17.7pp · 2024: -19.1pp
- All cycles
- 2024: R+19.1 2020: R+16.5 2016: R+22.1 2012: R+20.5 2008: R+17.7
Not yet ingested
- Civics
- —
Market trends
- HPI YoY
- ▼ -257.27%
- Current HPI
- 239.0701
- Rent YoY
- ▼ -0.25%
- Metro
- Charlotte-Concord-Gastonia, NC-SC
- State GDP YoY
- ▲ 4.51%
- F500 in state
- 2
Industry mix (Fortune 500 HQ in SC)
| Industry | F500 HQs | Revenue |
|---|---|---|
| Packaging | 1 | $7B |
|
||
Price history
+244.8% since first listed5 events — show timeline
- 2026-05-18 Price Changed $150,000 CANOPYMLS as Distributed by MLS Grid
- 2026-05-04 Listed $155,000 CANOPYMLS as Distributed by MLS Grid
- 2022-05-02 Sold (Public Records) $145,330 Public Records
- 2006-06-30 Sold (Public Records) $52,000 Public Records
- 1997-01-05 Sold (Public Records) $43,500 Public Records
Property tax history
+0.3%/yrLatest (2025): $1,210 · -1.0% YoY. Source: county tax records.
Cash-flow waterfall
monthlySold comps — $/sqft
last 12 mo · ≤1 miLoading sold comps…