15500 Bubbling Wells Rd #140 · Garnet, CA
Flood risk 1/10 · Minimal
- FEMA flood zone
- AO
- Chance of flooding over 30 yrs
- 0.0%
- Est. flood insurance / yr
- $848 – $2,087
Fire risk 5/10 · Moderate
- Est. fire insurance / yr
- $659 – $1,223
Heat risk 8/10 · Major
- Hot days now (above 111°F)
- 2 days/yr
- Hot days in 30 yrs
- 6 days/yr
Wind risk 1/10 · Minimal
- Chance of severe wind over 30 yrs
- —
Air-quality risk 5/10 · Moderate
- Unhealthy air days now
- 8 days/yr
- Unhealthy air days in 30 yrs
- 11 days/yr
Risk factors via First Street. Map © Google.
Why this score? — see what drove the B grade
The composite is a weighted blend of 9 inputs, each scored 0–100. Each bar is that input's sub-score; the figure is the points it added to the 100-point composite (weight × sub-score).
- Cash flow +30.0/30.0
- ARV discount +13.5/15.0
- 1% rule +10.0/10.0
- DSCR +10.0/10.0
- Rent growth +3.4/5.0
- Schools +2.7/10.0
- Livability +2.7/5.0
- Condition / age +2.5/5.0
- Appreciation +0.0/10.0
$69,900
🖨 Deal sheet 📄 Offer letter ✓ Due diligence
Listing remarks
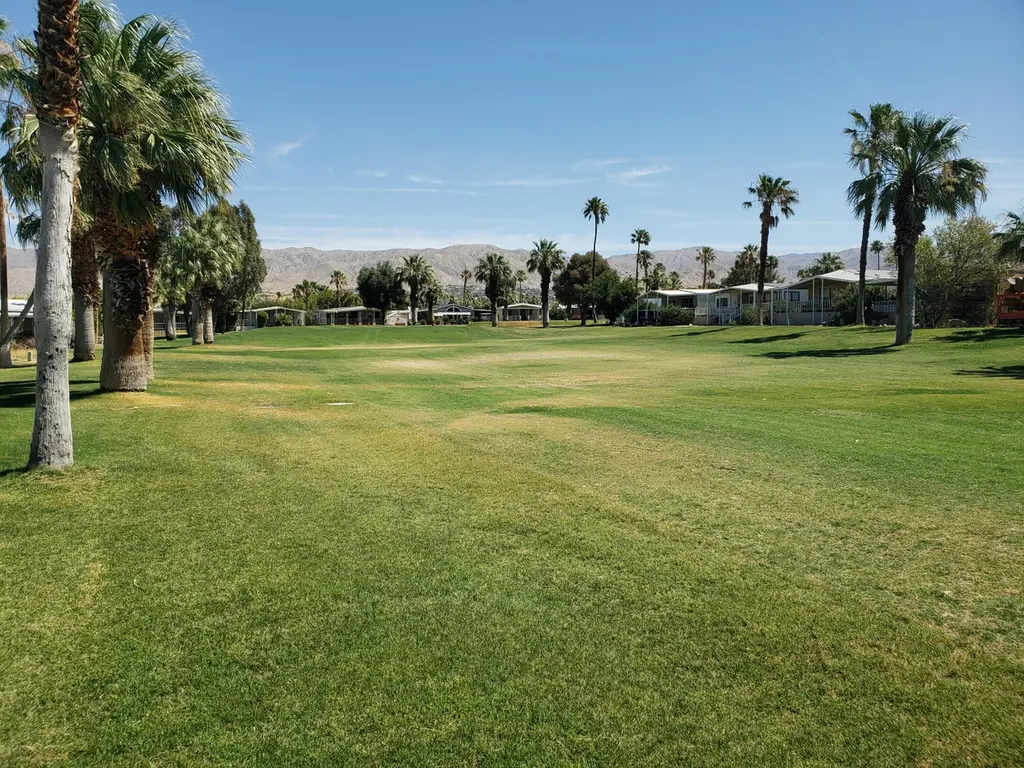
Experience the tranquility and peace of resort-style living at Hidden Springs Country Club a vibrant 55+ community. This 3-bedroom home backing to open space and the 9-hole, par 3 golf course with serene views, added privacy and a peacefully setting. The community offers an impressive list of amenities, including golf course, sparkling swimming pool, modern workout facility, tennis and pickleball courts, two spas, a sauna, a recreation room and a dog park. Whether seeking an active lifestyle or a quiet desert retreat, Hidden Springs has it all. The interior features an open floor plan with high ceilings, stylish wood laminate flooring. Kitchen offers gas range, microwave, garbage disposal,
Key facts
- Open space
- Pickleball courts
- Tennis courts
Tags
Property features AI
Finance
- Other: Rental restrictions apply; Space rent includes trash
- Financial info: Lease land type (space rent listed separately); Land lease payment listed separately
- HOA & community: No monthly association fee; Senior community; Community features include dog park, pickleball courts, and golf course within development; Community pool and spa (in-ground, heated, fenced) with safety fence; community hot tub
Exterior
- Parking: Detached carport (1 carport space); Total of 2 parking spaces; Direct entrance
- Security: Card/code access; Resident manager; Gated community
- Utilities: Mutual water source; Sewer connected and paid; Cable TV available
- Home design: Detached cottage/ranch style; Single-story (one level); Mobile/manufactured double-wide
- Construction: Aluminum and combination siding; Pier jacks foundation; Manufactured home from 1980 (Goldenwest, model CT5A866); Skirted with aluminum siding
- Exterior features: Located on a golf course; Front door faces east; Covered patio; No fencing; No interior steps (single-level entry); Level lot; Single lot; View of golf course and mountains; Community is gated
Interior
- Kitchen: Granite counters; Kitchen island; Breakfast counter/bar; Living/dining combo and dining area
- Bedrooms: All bedrooms on the main floor; Main-floor master bedroom
- Flooring: Laminate flooring; Wood flooring
- Bathrooms: 2 full bathrooms; Two master bathrooms; Tile counters; Shower over tub; Low-flow toilets
- Heating & cooling: Heat pump heating; Natural gas fuel; Central air conditioning; Evaporative cooling; Ceiling fans
- Interior features: High ceilings (9 ft+); Open floor plan; Blinds; Partially furnished; Entry through the living room
- Laundry & utility: Dedicated laundry room; Gas water heater (in laundry)
Neighborhood map
What this means for you Summary
Snapshot
- This is a 2-bed/2.0-bath manufactured listed at $70k.
Deal economics
- At list price, monthly cash flow is $2k ($18k/yr) — positive.
- The deal already cash-flows at list — no discount required.
- Meets the 1% rule at list price ($3k rent vs $70k).
- Recommended offer: $69k (1.5% below list) — sets the bar for market timing.
- Cap rate 34.7% vs local median 6.0% in Garnet — top-decile yield for the area; either an underpriced asset or a hidden risk that comps aren't pricing in. Stress-test before assuming the spread holds.
Location & tenants
- Location reads 53/100 on livability (#971 in CA) — a working-class tenant base; expect higher turnover. Strengths: housing A+; Watch: cost of living D, crime F, amenities F.
- Palm Springs Unified (suburban): math 21% / reading 42% proficiency, ranked #328 of 517 in CA (top 63%) — families likely to look elsewhere, expect single-tenant / working-renter base with shorter leases; 73% free/reduced lunch — lower-income household profile, screen leases tightly.
- Zoned schools: Agua Caliente Elementary (626 students, 97% FRL) — zoned schools average 97% FRL vs 73% district-wide (24 pts higher); higher-poverty schools than district average — tighter screening recommended.
- Market conditions: Rents rising (+3.7%/yr); 515 active listings in the ZIP; 9 comparable units currently listed for rent nearby; rentals lingering (median 44d on market — plan ~5-8 weeks vacancy on turnover, expect pricing pressure); 89% of comp listings sitting > 30 days — soft ceiling on asking rent; 9,195 units permitted in Riverside County in 2024 (1,512 in 5+ unit buildings).
Forward outlook
- Local home prices are declining (-3.0%/yr); year-one equity from $483 of loan paydown is wiped out by about $2k of value loss. Plan a longer hold.
- Riverside County population projected at +22% by 2050 — long-run rental-demand tailwind backs the buy-and-hold thesis.
- At projected returns (-3.0% appreciation + 3.7% rent growth), your $20k cash investment doubles in ~2 years — after that, you're playing with house money.
Negotiation context
- It's been on market 15 days — a 2% lower offer ($69k) is reasonable based on typical stale-listing flexibility.
- 3 sale attempts since 24y ago with the ask held roughly flat each time — persistent listings suggest the price (not the market) is what's stuck; bring a comps-based counter.
- Current owner paid $11k; list at $70k implies a 535% gain — meaningful room to come down on a strong offer.
Risks & watch-outs
- Watch-outs: flood insurance adds $122/mo.
- Climate carrying-cost: in FEMA flood zone AO (mandatory federal flood insurance); moderate wildfire risk; extreme-heat days projected 2→6/yr by 2055 (HVAC capex compounding) — expect insurance premiums to compound above CPI over the hold.
Questions for the listing agent
- What's the actual annual flood-insurance premium (NFIP or private), and is the property in a SFHA with mandatory coverage?
- Is there a deadline driving the sale (1031 exchange, divorce, estate, relocation)? That informs how much negotiation room exists.
- Schools are F-rated, which usually means shorter tenancies and higher turnover. Who's the typical renter profile here, and what's been the actual vacancy rate?
- Crime grade is F in this area — have there been break-ins, vandalism, or insurance claims at this property in the last 3 years? What carrier currently insures it and at what premium?
- What's the average days-on-market for RENTAL listings here right now (not sales)? A rising rental-DOM trend means longer vacancies and softer asking-rent achievability than the comps imply.
- What's the recent tenant-quality profile in this submarket — average credit score on applications, eviction rate, late-payment / NSF rate, and stable-employment percentage? A property-management company in the area should have these aggregated.
- How much new for-sale + rental construction is in the pipeline within 1–3 miles? Heavy new supply typically softens prices + rents 12–24 months out; constrained supply supports both.
Investment metrics
- 1% rule
- 3.76% ✓
- Cap rate
- 34.70%
- Cash-on-cash
- 101.44%
- DSCR
- 5.51
- GRM
- 2.2
CMA / ARV
- ARV (on-the-fly)
- $80,640
- Comps found
- 12
Show comp detail 12 sales within ~0.75 mi
| Address | Dist | Beds/Ba | Sqft | Sold | Price | $/sf | Match |
|---|---|---|---|---|---|---|---|
| 15500 Bubbling Wells Rd #243 | 0.12mi | 3/2.0 (+1) | 1,344 (0%) | 3mo | $69,500 | $52 | 87 |
| 15500 Bubbling Wells Rd #283 | 0.02mi | 2/2.0 | 1,344 (0%) | 15mo | $75,000 | $56 | 87 |
| 15500 Bubbling Wells Rd #191 | 0.00mi | 2/2.0 | 1,344 (0%) | 17mo | $126,000 | $94 | 86 |
| 15500 Bubbling Wells Rd #265 | 0.00mi | 2/2.0 | 1,440 (+7%) | 3mo | $45,000 | $31 | 86 |
| 15500 Bubbling Wells Rd #267 | 0.00mi | 2/2.0 | 1,344 (0%) | 18mo | $80,000 | $60 | 85 |
| 15500 Bubbling Wells Rd #300 | 0.00mi | 2/2.0 | 1,440 (+7%) | 7mo | $55,000 | $38 | 82 |
| 15500 Bubbling Wells Rd #237 | 0.00mi | 2/2.0 | 1,440 (+7%) | 13mo | $40,000 | $28 | 77 |
| 15500 Bubbling Wells Rd #108 | 0.13mi | 2/2.0 | 1,296 (-4%) | 17mo | $95,000 | $73 | 74 |
| 15500 Bubbling Wells Rd #104 | 0.13mi | 2/2.0 | 1,440 (+7%) | 15mo | $125,000 | $87 | 69 |
| 15500 Bubbling Wells Rd #277 | 0.13mi | 2/2.0 | 1,536 (+14%) | 1mo | $55,000 | $36 | 69 |
| 15500 Bubbling Wells Rd #167 | 0.13mi | 2/2.0 | 1,440 (+7%) | 19mo | $129,500 | $90 | 66 |
| 16160 Avenida Mirola | 0.40mi | 3/2.0 (+1) | 1,344 (0%) | 14mo | $318,000 | $237 | 64 |
Match score weights: distance 35% · size 25% · config 20% · recency 20%. Top-matched comps best support the ARV.
Projected returns pro-forma
-3.0% appreciation · 3.66% rent growth · sell at horizon
- IRR
- 95.6%
- Equity multiple
- 5.50×
- Total profit
- $88,095
- Equity at exit
- $10,422
- IRR
- 98.4%
- Equity multiple
- 11.73×
- Total profit
- $210,001
- Equity at exit
- $6,044
Cash invested: $19,572 (down + closing). Projections, not guarantees.
Landlord ↔ Tenant lean methodology
- Overall (STATE)
- 18 Strongly Tenant-Friendly
- State California
- 18 Strongly Tenant-Friendly · D+13
- County
- — inherits STATE
- City
- — inherits STATE
ZIP-level market 92240
- Home prices YoY
- -19.6%
- Rents YoY
- 3.7%
- Active inventory
- 515
- Price-to-rent
- 2.2×
Monthly cashflow live
- Estimated rent
- $2,631 high interval (Pro) →
- Mortgage (P&I)
- −$367
- Tax from tax record
- −$29 /mo · $344/yr
- Insurance
- −$29
- Flood insurance flood zone
- −$122 /mo · $1,468/yr
- HOA
- −$0
- Vacancy / Maint / Mgmt
- −$553
- Net cashflow
- $1,532
Break-even live
UW: 25.0% down · 7.5% · 30yr · 1.5% tax · 5.0% vac · 8.0% maint · 8.0% mgmt
Financing live
Cash to close
- Down payment
- $17,475
- Closing costs
- $2,097
- Reserves months
- —
- Total cash needed
- —
Loan-product check · same deal, 3 products live
Conventional
25% down · 7.5% · 30yr
- Down + closing
- —
- Monthly P&I
- —
- Monthly cashflow
- —
- DSCR
- —
- Eligible?
- —
Personal DTI + credit; lowest rate.
DSCR
20% down · 8.5% · 30yr
- Down + closing
- —
- Monthly P&I
- —
- Monthly cashflow
- —
- DSCR
- —
- Eligible?
- —
No personal income docs; deal must DSCR.
Hard money
10% down · 12.0% · 12mo
- Down + closing
- —
- Monthly P&I
- —
- Monthly cashflow
- —
- DSCR
- —
- Eligible?
- —
Short-term bridge; refi at stabilization.
Rent comps 9 comps
| Address | Beds | Baths | Sqft | Rent | $/sqft | DOM | Units | Dist |
|---|---|---|---|---|---|---|---|---|
| 15490 Avenue Rambla Unit NA Desert Hot Springs, CA | 3.0 | 2.0 | 1088 | $2,600 | $2.39 | 24d | 1 | 0.19mi |
| 15490 Avenida Rambla Desert Hot Springs, CA | 3.0 | 2.0 | 1088 | $2,600 | $2.39 | 43d | 1 | 0.19mi |
| 16087 Bubbling Wells Rd Desert Hot Springs, CA | 3.0 | 2.0 | 1850 | $5,000 | $2.70 | 43d | 1 | 0.27mi |
| 15300 Palm Dr Desert Hot Springs, CA | 3.0 | 2.0 | 1458 | $2,800 | $1.92 | 43d | 1 | 0.99mi |
| 13440 Quinta Way Unit 2 Desert Hot Springs, CA | 2.0 | 2.0 | 1032 | $2,000 | $1.94 | 43d | 1 | 1.16mi |
| 68160 Calle Blanco Desert Hot Springs, CA | 3.0 | 2.0 | 1331 | $2,500 | $1.88 | 43d | 1 | 1.26mi |
| 13235 Mountain View Rd Unit 2 Desert Hot Springs, CA | 3.0 | 2.0 | 1400 | $2,400 | $1.71 | 43d | 1 | 1.28mi |
| 13553 Avenida La Vis Desert Hot Springs, CA | 3.0 | 2.0 | 1625 | $2,495 | $1.54 | 43d | 1 | 1.28mi |
| 12920 Inaja St Unit C Desert Hot Springs, CA | 2.0 | 2.0 | 1000 | $1,895 | $1.90 | 43d | 1 | 1.38mi |
Listing history 11 events
-
2026-06-18days on market $69,900 Active 15 DOM
-
2026-06-17days on market $69,900 Active 14 DOM
-
2026-06-16days on market $69,900 Active 13 DOM
-
2026-06-15days on market $69,900 Active 12 DOM
-
2026-06-13days on market $69,900 Active 10 DOM
-
2026-06-13days on market $69,900 Active 9 DOM
-
2026-06-09days on market $69,900 Active 6 DOM
-
2026-06-08days on market $69,900 Active 5 DOM
-
2026-06-07days on market $69,900 Active 4 DOM
-
2026-06-04remarks 699-char remark
-
2026-06-04$69,900 Active 1 DOM
ⓘ Source: listings_history table (triggers on properties + properties_extension) + one-shot
backfill from property_details.listing_events for pre-trigger history.
Tax reassessment forecast CA · Resets to sale price
- Current annual tax
- $344 · $29/mo
- Projected year-2 tax
- $531 · $44/mo
- Expected delta
- +$187/yr (+$16/mo · 54.3%)
ⓘ Screening estimate from a state-policy table — verify with the county assessor before closing.
Climate risk First Street
- Flood 1/10 Low FEMA zone AO · 0% chance over 30 yrs
- Wildfire 5/10 Major
- Heat 8/10 Severe 2 d/yr ≥111°F today · 6 d/yr by 30 yrs out
- Wind 1/10 Low
- Air quality 5/10 Major 8 unhealthy d/yr today · 11 by 30 yrs out
Nearby sold comps map
Loading sold comps map…
Walkable amenities ~0.75 mi
Loading nearby amenities…
Taxation est. · year 1
- Rental income
- $31,577
- − Mortgage interest
- −$3,915
- − Property taxes
- −$344
- − Insurance
- −$1,817
- − Repairs & maintenance
- −$2,526
- − Management
- −$2,526
- − Depreciation
- −$2,033
- Taxable income
- $18,415
- Est. tax owed @ 24.0%
- −$4,419
- After-tax cash flow
- $13,966/yr
For passive investors: Depreciation is non-cash, so a rental often shows a tax loss while cash-flowing — sheltering income. Rental losses are passive: they offset passive income freely, and up to $25,000/yr can offset ordinary (W-2) income if you actively participate and your MAGI is under $100k (phasing out to $0 by $150k); unused losses carry forward. On sale, claimed depreciation is recaptured at up to 25%, and gains may owe capital-gains tax (a 1031 exchange can defer both). Figures are a year-1 estimate at your 24.0% rate — not tax advice; consult a CPA.
Schools (NCES district)
- District
- Palm Springs Unified
- NCES district ID
- 0629550
- Math proficiency
- 21% ▼ -7.00%
- Reading proficiency
- 42% ▬ 0.00%
- Median HH income
- $43,638
- Composite
- 26.76/100
- National rank
- #7131
- State rank
- #328 of 517 in CA
Livability — Garnet
- Score
- 53/100
- State rank
- #971
- US rank
- #24574
Category grades
Schools grade is shown separately in the Schools card above.
Census & demographics
- Census place
- Garnet, CA
- County
- Riverside County · 2,287,001 people
- Metro
- Riverside-San Bernardino-Ontario, CA
- Population (ZIP)
- 41,615
- Household income
- $54,023
- Rent vs Own
- Severe rent burden
- 2095.0
Population outlook (Riverside County) Hauer SSP2
- Today (2025)
- 2,664,475 people
- By 2030
- 2,802,692 · +5.2%
- By 2040
- 3,050,904 · +14.5%
- By 2050
- 3,256,783 · +22.2%
- By 2075
- 3,655,058 · +37.2%
- By 2100
- 3,766,594 · +41.4%
Race, ethnicity, and origin ACS 2023
- Neighborhood character
- Majority Hispanic (64%)
- Race & ethnicity
- Hispanic / Latino 64% Two or more races 27% White 23% Black 7% Native American 2% Asian 2%
- Hispanic origin (detail)
- Mexican 53%
- Common ancestry
- Lithuanian 1% Romanian 1% Italian 1%
- Foreign-born
- 27% · Canada, Vietnam
- Languages at home
- 47% English-only · Spanish 50% Russian/Polish/Slavic 1%
Political lean MEDSL · Riverside
- 2024 margin
- Toss-up / Even · D 48.0% · R 49.3% · Other 2.6%
- 2008→2024 swing
- -3.6pp toward R · 2008: 2.3pp · 2024: -1.3pp
- All cycles
- 2024: R+1.3 2020: D+8.0 2016: D+4.3 2012: R+0.4 2008: D+2.3
Not yet ingested
- Civics
- —
Market trends
- HPI YoY
- ▼ -102.10%
- Current HPI
- 418.4691
- Rent YoY
- ▲ 3.66%
- Metro
- Riverside-San Bernardino-Ontario, CA
- State GDP YoY
- ▲ 3.21%
- F500 in state
- 116
Industry mix (Fortune 500 HQ in CA)
| Industry | F500 HQs | Revenue |
|---|---|---|
| Technology | 27 | $1,492B |
|
||
| Financial Services | 3 | $174B |
|
||
| Retail | 3 | $44B |
|
||
| Insurance | 3 | $26B |
|
||
| Media / Entertainment | 2 | $115B |
|
||
| Pharmaceuticals / Biotech | 2 | $62B |
|
||
Price history
+351.0% since first listed6 events — show timeline
- 2026-06-03 Listed $69,900 GPSMLS
- 2003-09-01 Sold (MLS) $11,000 GPSMLS
- 2003-09-01 Sold (MLS) $11,000 GPSMLS
- 2002-09-08 Listed $18,500 GPSMLS
- 2002-05-04 Listing Removed — GPSMLS
- 2002-02-03 Listed $15,500 GPSMLS
Property tax history
-2.1%/yrLatest (2025): $344 · -2.1% YoY. Source: county tax records.
Cash-flow waterfall
monthlySold comps — $/sqft
last 12 mo · ≤1 miLoading sold comps…