1055 Oregon Rd · Mattituck, NY
Flood risk 1/10 · Minimal
- FEMA flood zone
- X (unshaded)
- Chance of flooding over 30 yrs
- 0.0%
- Est. flood insurance / yr
- $473 – $860
Fire risk 1/10 · Minimal
- Est. fire insurance / yr
- $691 – $1,283
Heat risk 5/10 · Moderate
- Hot days now (above 91°F)
- 7 days/yr
- Hot days in 30 yrs
- 19 days/yr
Wind risk 8/10 · Major
- Chance of severe wind over 30 yrs
- 80.0%
Air-quality risk 3/10 · Minor
- Unhealthy air days now
- 2 days/yr
- Unhealthy air days in 30 yrs
- 3 days/yr
Risk factors via First Street. Map © Google.
Why this score? — see what drove the B- grade
The composite is a weighted blend of 9 inputs, each scored 0–100. Each bar is that input's sub-score; the figure is the points it added to the 100-point composite (weight × sub-score).
- Cash flow +24.6/30.0
- ARV discount +15.0/15.0
- DSCR +7.9/10.0
- Schools +6.1/10.0
- 1% rule +5.7/10.0
- Livability +3.5/5.0
- Rent growth +2.5/5.0
- Condition / age +2.5/5.0
- Appreciation +0.0/10.0
$1,199,000
🖨 Deal sheet 📄 Offer letter ✓ Due diligence
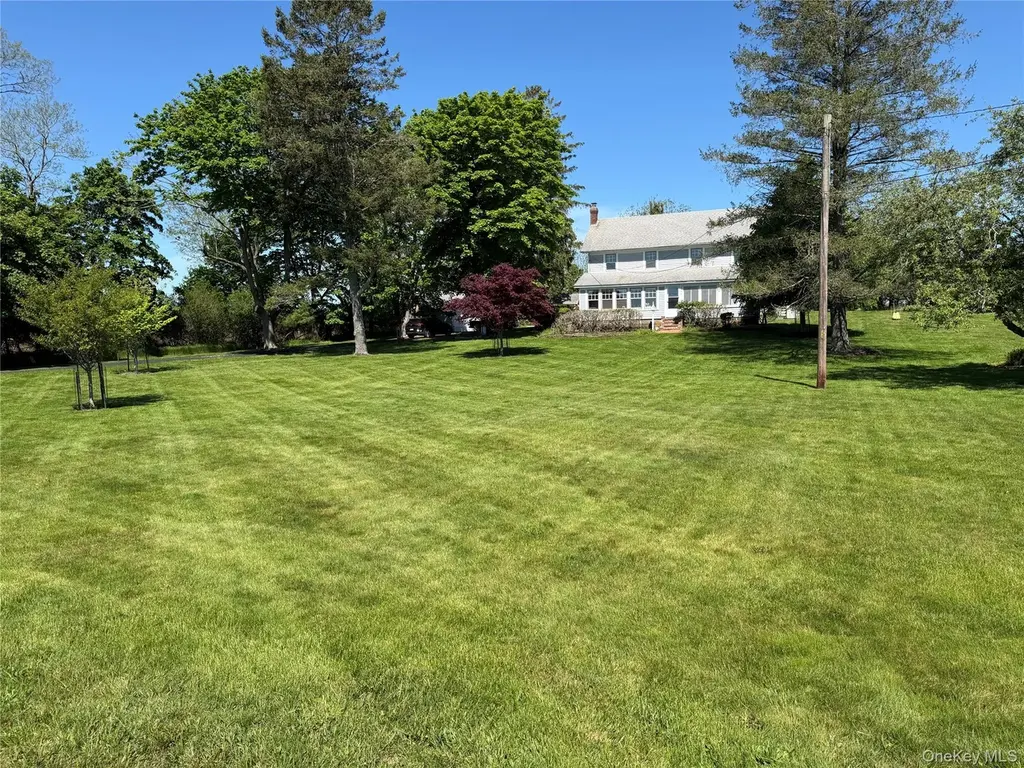
Listing remarks
Multi-use North Fork retreat with beach access and easy NYC connectivity. Welcome to this charming farmhouse nestled in the quaint town of Mattituck, where timeless character meets peaceful North Fork living. Set in a very private, secluded location, this spacious home offers 6 Bedrooms and 1 Bath, featuring a kitchen with quick access to the formal Dining Room, an inviting Living Room, a Den/Home Office, and a spacious Parlor perfect for gatherings. .Beautiful hardwood flooring and solid-wood doors add warmth and character throughout, while the enclosed Sunroom provides the perfect place to relax and enjoy panoramic views of the landscaped property. Outside, the property offers exceptional
Key facts
- 1.46 acre lot
- 2 garage spots
- Built 1926
Property features AI
Exterior
- Parking: Detached garage and garage(s) / outbuilding(s) / shed(s); Detached parking; Driveway; Off-street parking; Oversized parking; Total parking spaces for 8; 2-car garage
- Utilities: Electricity connected (PSEG); Cable connected; Phone connected; Cesspool sewer
- Home design: Single family residence; Updated/remodeled; Two levels
- Construction: Block foundation; Block construction; Vinyl siding
- Exterior features: Mailbox; Back yard; Front yard; Garden; Level and paved lot
Interior
- Kitchen: Electric oven; Electric range; Microwave; Refrigerator; ENERGY STAR qualified appliances
- Bedrooms: Two levels (total rooms: 10)
- Flooring: Carpet; Tile; Wood
- Bathrooms: One full bathroom
- Heating & cooling: Radiant heating; Oil heating; ENERGY STAR qualified equipment; Ductless cooling
- Interior features: First-floor bedroom; First-floor full bath; Ceiling fans; High-speed internet; Storage; Accessible approach with ramp; Covered patio/deck/porch
- Laundry & utility: Laundry room; Washer; Dryer; Hot water heating
Neighborhood map
What this means for you Summary
Snapshot
- This is a 5-bed/1.0-bath single-family listed at $1.20M.
Deal economics
- At list price, monthly cash flow is $2k ($30k/yr) — positive.
- The deal already cash-flows at list — no discount required.
- Meets the 1% rule at list price ($13k rent vs $1.20M).
- Recommended offer: $1.18M (1.5% below list) — sets the bar for market timing.
- Cap rate 8.8% vs local median 4.0% in Mattituck — top-decile yield for the area; either an underpriced asset or a hidden risk that comps aren't pricing in. Stress-test before assuming the spread holds.
Location & tenants
- Location reads 70/100 on livability (#461 in NY) — a middle-class / working-renter tenant base. Strengths: crime A+, employment A+, health & safety B+; Watch: housing C-, amenities F, commute F.
- Mattituck-Cutchogue Union Free School District (suburban): math 69% / reading 68% proficiency, ranked #127 of 590 in NY (top 22%) — acceptable for families but not a draw, mixed tenant base, ~2y average lease; only 16% free/reduced lunch — higher-income household profile.
- Zoned schools: Mattituck-Cutchogue Elementary School (math 65% / reading 68%, grade B+, #575 of 2,108 statewide, top 27%, 453 students, 37% FRL); Mattituck Junior-Senior High School (math 74% / reading 72%, grade B+, #670 of 1,100 statewide, top 61%, 548 students, 0% FRL) — zoned schools at 18% FRL track the district average.
- Market conditions: 49 active listings in the ZIP; 2 comparable units currently listed for rent nearby; 1,366 units permitted in Suffolk County in 2024 (216 in 5+ unit buildings).
Forward outlook
- Local home prices are declining (-3.0%/yr); year-one equity from $8k of loan paydown is wiped out by about $36k of value loss. Plan a longer hold.
- Suffolk County population projected to shrink 5% by 2050 — rents likely to lag national; underwrite the cash flow, not the appreciation.
Negotiation context
- It's been on market 24 days — a 2% lower offer ($1.18M) is reasonable based on typical stale-listing flexibility.
Risks & watch-outs
- Watch-outs: built in 1926 — expect roof / HVAC / electrical / plumbing capex.
- Climate carrying-cost: severe wind risk, 80% chance of damaging wind over 30y; extreme-heat days projected 7→19/yr by 2055 (HVAC capex compounding) — expect insurance premiums to compound above CPI over the hold.
Questions for the listing agent
- Built in 1926 — when were the roof, HVAC, electrical panel, plumbing, and water heater last replaced?
- Is there a deadline driving the sale (1031 exchange, divorce, estate, relocation)? That informs how much negotiation room exists.
- Schools are A-rated — typically a magnet for longer-tenancy family renters. What's the average tenant stay here, and is there a school-zone premium baked into asking?
- What's the average days-on-market for RENTAL listings here right now (not sales)? A rising rental-DOM trend means longer vacancies and softer asking-rent achievability than the comps imply.
- What's the recent tenant-quality profile in this submarket — average credit score on applications, eviction rate, late-payment / NSF rate, and stable-employment percentage? A property-management company in the area should have these aggregated.
- How much new for-sale + rental construction is in the pipeline within 1–3 miles? Heavy new supply typically softens prices + rents 12–24 months out; constrained supply supports both.
Investment metrics
- 1% rule
- 1.07% ✓
- Cap rate
- 8.78%
- Cash-on-cash
- 8.88%
- DSCR
- 1.39
- GRM
- 7.8
CMA / ARV
- ARV (on-the-fly)
- $1,460,912
- Comps found
- 2
Show comp detail 2 sales within ~0.75 mi
| Address | Dist | Beds/Ba | Sqft | Sold | Price | $/sf | Match |
|---|---|---|---|---|---|---|---|
| 3320 Oregon Rd | 0.46mi | 4/2.0 (-1) | 2,000 (-10%) | 5mo | $1,075,000 | $538 | 48 |
| 2850 Reeve Rd | 0.61mi | 4/3.5 (-1) | 2,150 (-4%) | 9mo | $1,410,000 | $656 | 43 |
Match score weights: distance 35% · size 25% · config 20% · recency 20%. Top-matched comps best support the ARV.
Projected returns pro-forma
-3.0% appreciation · 3.0% rent growth · sell at horizon
- IRR
- -2.9%
- Equity multiple
- 0.89×
- Total profit
- $-36,324
- Equity at exit
- $178,775
- IRR
- 6.8%
- Equity multiple
- 1.51×
- Total profit
- $171,202
- Equity at exit
- $103,668
Cash invested: $335,720 (down + closing). Projections, not guarantees.
Landlord ↔ Tenant lean methodology
- Overall (STATE)
- 15 Strongly Tenant-Friendly
- State New York
- 15 Strongly Tenant-Friendly · D+10
- County
- — inherits STATE
- City
- — inherits STATE
ZIP-level market 11952
- Home prices YoY
- -17.2%
- Active inventory
- 49
- Price-to-rent
- 7.8×
Monthly cashflow live
- Estimated rent
- $12,808 medium interval (Pro) →
- Mortgage (P&I)
- −$6,288
- Tax from tax record
- −$848 /mo · $10,171/yr
- Insurance
- −$500
- HOA
- −$0
- Vacancy / Maint / Mgmt
- −$2,690
- Net cashflow
- $2,483
Break-even live
UW: 25.0% down · 7.5% · 30yr · 1.5% tax · 5.0% vac · 8.0% maint · 8.0% mgmt
Financing live
Cash to close
- Down payment
- $299,750
- Closing costs
- $35,970
- Reserves months
- —
- Total cash needed
- —
Loan-product check · same deal, 3 products live
Conventional
25% down · 7.5% · 30yr
- Down + closing
- —
- Monthly P&I
- —
- Monthly cashflow
- —
- DSCR
- —
- Eligible?
- —
Personal DTI + credit; lowest rate.
DSCR
20% down · 8.5% · 30yr
- Down + closing
- —
- Monthly P&I
- —
- Monthly cashflow
- —
- DSCR
- —
- Eligible?
- —
No personal income docs; deal must DSCR.
Hard money
10% down · 12.0% · 12mo
- Down + closing
- —
- Monthly P&I
- —
- Monthly cashflow
- —
- DSCR
- —
- Eligible?
- —
Short-term bridge; refi at stabilization.
Rent comps 2 comps
| Address | Beds | Baths | Sqft | Rent | $/sqft | DOM | Units | Dist |
|---|---|---|---|---|---|---|---|---|
| 1835 Naugles Dr Unit 1429740P Mattituck, NY | 4.0 | 4.0 | 2389 | $15,520 | $6.50 | 43d | 1 | 0.82mi |
| 800 Ruth Rd Mattituck, NY | 6.0 | 2.5 | 2000 | $8,000 | $4.00 | 43d | 1 | 1.40mi |
Listing history 13 events
-
2026-06-18days on market $1,199,000 Active 24 DOM
-
2026-06-17days on market $1,199,000 Active 23 DOM
-
2026-06-16days on market $1,199,000 Active 22 DOM
-
2026-06-15days on market $1,199,000 Active 21 DOM
-
2026-06-13days on market $1,199,000 Active 19 DOM
-
2026-06-12days on market $1,199,000 Active 18 DOM
-
2026-06-09days on market $1,199,000 Active 15 DOM
-
2026-06-08days on market $1,199,000 Active 14 DOM
-
2026-06-07days on market $1,199,000 Active 13 DOM
-
2026-06-04days on market $1,199,000 Active 9 DOM
-
2026-06-02days on market $1,199,000 Active 8 DOM
-
2026-06-01days on market $1,199,000 Active 7 DOM
-
2026-05-31days on market $1,199,000 Active 6 DOM
ⓘ Source: listings_history table (triggers on properties + properties_extension) + one-shot
backfill from property_details.listing_events for pre-trigger history.
Tax reassessment forecast NY · Partial reset (capped growth)
- Current annual tax
- $10,171 · $848/mo
- Projected year-2 tax
- $15,217 · $1,268/mo
- Expected delta
- +$5,046/yr (+$421/mo · 49.6%)
ⓘ Screening estimate from a state-policy table — verify with the county assessor before closing.
Climate risk First Street
- Flood 1/10 Low FEMA zone X (unshaded) · 0% chance over 30 yrs
- Wildfire 1/10 Low
- Heat 5/10 Major 7 d/yr ≥91°F today · 19 d/yr by 30 yrs out
- Wind 8/10 Severe 80% chance of damaging wind over 30 yrs
- Air quality 3/10 Moderate 2 unhealthy d/yr today · 3 by 30 yrs out
Nearby sold comps map
Loading sold comps map…
Walkable amenities ~0.75 mi
Loading nearby amenities…
Taxation est. · year 1
- Rental income
- $153,696
- − Mortgage interest
- −$67,163
- − Property taxes
- −$10,171
- − Insurance
- −$5,995
- − Repairs & maintenance
- −$12,296
- − Management
- −$12,296
- − Depreciation
- −$34,880
- Taxable income
- $10,896
- Est. tax owed @ 24.0%
- −$2,615
- After-tax cash flow
- $27,186/yr
For passive investors: Depreciation is non-cash, so a rental often shows a tax loss while cash-flowing — sheltering income. Rental losses are passive: they offset passive income freely, and up to $25,000/yr can offset ordinary (W-2) income if you actively participate and your MAGI is under $100k (phasing out to $0 by $150k); unused losses carry forward. On sale, claimed depreciation is recaptured at up to 25%, and gains may owe capital-gains tax (a 1031 exchange can defer both). Figures are a year-1 estimate at your 24.0% rate — not tax advice; consult a CPA.
Schools (NCES district)
- District
- Mattituck-Cutchogue Union Free School District
- NCES district ID
- 3600021
- Math proficiency
- 69% ▼ -3.00%
- Reading proficiency
- 68% ▲ 4.00%
- Median HH income
- $84,164
- Composite
- 61.4/100
- National rank
- #765
- State rank
- #127 of 590 in NY
Livability — Mattituck
- Score
- 70/100
- State rank
- #461
- US rank
- #8015
Category grades
Schools grade is shown separately in the Schools card above.
Census & demographics
- Census place
- Mattituck, NY
- City population
- 4,749
- Population (ZIP)
- 4,749
Population outlook (Suffolk County) Hauer SSP2
- Today (2025)
- 1,505,262 people
- By 2030
- 1,498,318 · -0.5%
- By 2040
- 1,471,101 · -2.3%
- By 2050
- 1,424,848 · -5.3%
- By 2075
- 1,337,157 · -11.2%
- By 2100
- 1,217,720 · -19.1%
Race, ethnicity, and origin ACS 2023
- Neighborhood character
- Predominantly White (92%)
- Race & ethnicity
- White 92% Hispanic / Latino 7% Two or more races 2%
- Hispanic origin (detail)
- Mexican 2%
- Common ancestry
- Romanian 16% Subsaharan African 5% Scotch-Irish 3%
- Foreign-born
- 12% · Canada
- Languages at home
- 84% English-only · Russian/Polish/Slavic 6% Spanish 5% French/Haitian/Cajun 2%
Political lean MEDSL · Suffolk
- 2024 margin
- Lean R (+10.0) · D 45.0% · R 55.0%
- 2008→2024 swing
- -16.0pp toward R · 2008: 6.0pp · 2024: -10.0pp
- All cycles
- 2024: R+10.0 2020: R+0.0 2016: R+8.2 2012: D+2.9 2008: D+6.0
Not yet ingested
- Civics
- —
Market trends
- HPI YoY
- ▼ -94.04%
- Current HPI
- 453.8895
- Rent YoY
- —
- Metro
- —
- State GDP YoY
- ▲ 2.60%
- F500 in state
- 92
Industry mix (Fortune 500 HQ in NY)
| Industry | F500 HQs | Revenue |
|---|---|---|
| Financial Services | 10 | $950B |
|
||
| Consumer Goods | 9 | $162B |
|
||
| Insurance | 4 | $225B |
|
||
| Telecommunications | 2 | $144B |
|
||
| Pharmaceuticals | 2 | $112B |
|
||
| Media / Entertainment | 2 | $69B |
|
||
Property tax history
+2.0%/yrLatest (2025): $10,171 · +0.0% YoY. Source: county tax records.
Cash-flow waterfall
monthlySold comps — $/sqft
last 12 mo · ≤1 miLoading sold comps…