 🏷️ Likely Rental
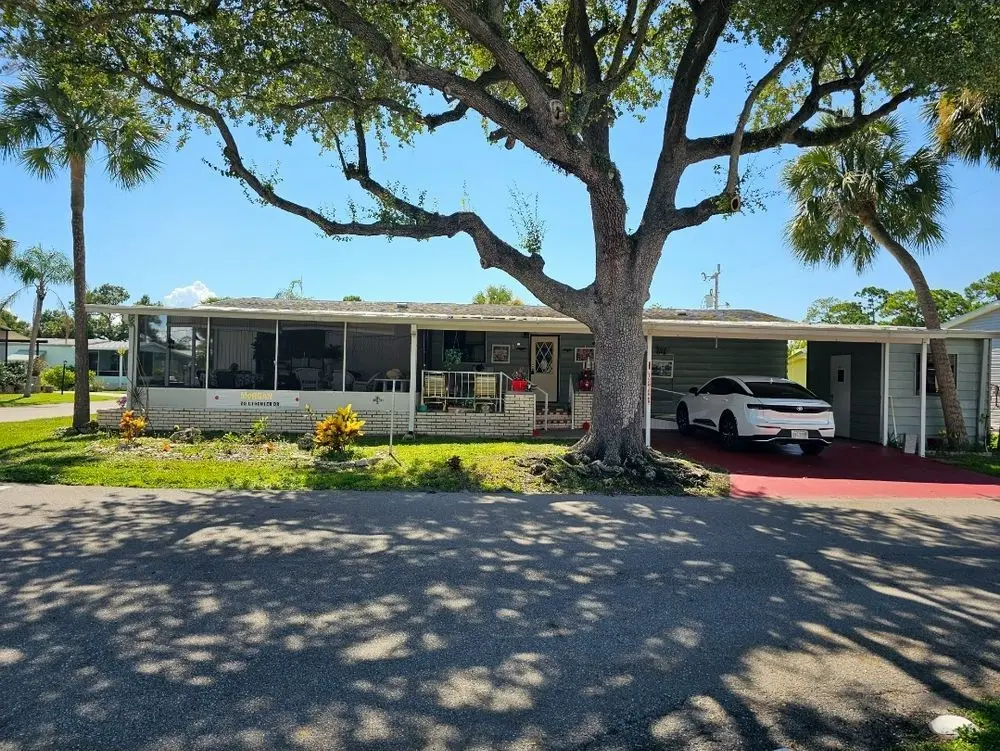
20 Ligonier Dr · North Fort Myers, FL
Flood risk No data
- FEMA flood zone
- —
- Chance of flooding over 30 yrs
- —
- Est. flood insurance / yr
- —
Fire risk No data
- Est. fire insurance / yr
- —
Heat risk No data
- Hot days now (above threshold)
- —
- Hot days in 30 yrs
- —
Wind risk No data
- Chance of severe wind over 30 yrs
- —
Air-quality risk No data
- Unhealthy air days now
- —
- Unhealthy air days in 30 yrs
- —
Risk factors via First Street. Map © Google.
Why this score? — see what drove the D grade
The composite is a weighted blend of 9 inputs, each scored 0–100. Each bar is that input's sub-score; the figure is the points it added to the 100-point composite (weight × sub-score).
- Cash flow +15.0/30.0
- ARV discount +7.5/15.0
- 1% rule +5.0/10.0
- DSCR +5.0/10.0
- Schools +4.1/10.0
- Livability +3.7/5.0
- Condition / age +2.5/5.0
- Rent growth +2.0/5.0
- Appreciation +0.0/10.0
$25,000
🖨 Deal sheet 📄 Offer letter ✓ Due diligence
Listing remarks
* * * * NEED TO SELL ASAP * * * * Fully furnished 2 bed/2 bath doublewide in 55+ park in North Fort Myers. Large screened in lanai, double parking carport with small shed. NEW interior electric panel installed in the last 6 months ($2,500). New central AC/heat system approx. 2 years ago. Extra large living room and master bedroom areas. Fully furnished to include contents of kitchen cabinets/drawers (pots, pans, dishes, etc. ). Move in ready and open to offers. Lot rent is $750/month and includes lawn maintenance and weekly trash pick up. * * * WILLING TO HEAR ANY OFFERS * * *
Key facts
- Small shed
- Screened in lanai
- Listed 274 days
Tags
Neighborhood map
What this means for you Summary
Snapshot
- This is a 2-bed/2.0-bath single-family listed at $25k.
Deal economics
- At list price, monthly cash flow is $1k ($16k/yr) — positive.
- The deal already cash-flows at list — no discount required.
- Meets the 1% rule at list price ($2k rent vs $25k).
- Recommended offer: $22k (12.0% below list) — sets the bar for market timing.
- Cap rate 70.2% vs local median 3.6% in North Fort Myers — top-decile yield for the area; either an underpriced asset or a hidden risk that comps aren't pricing in. Stress-test before assuming the spread holds.
Location & tenants
- Location reads 74/100 on livability (#269 in FL, #4,409 nationally) — a middle-class / working-renter tenant base. Strengths: cost of living A+, housing A+, health & safety A+; Watch: employment C-, amenities F, commute F.
- Lee (suburban): math 47% / reading 50% proficiency, ranked #42 of 73 in FL (top 58%) — families likely to look elsewhere, expect single-tenant / working-renter base with shorter leases.
- Market conditions: Rents soft (-1.9%/yr); 472 active listings in the ZIP; 40 comparable units currently listed for rent nearby; rentals at typical pace (median 24d on market — plan ~3-4 weeks tenant-placement turnaround); 15,411 units permitted in Lee County in 2024 (4,686 in 5+ unit buildings).
- This rent runs 40% of the median local income ($57k/yr) — at the standard rent-burdened threshold; future hikes will face affordability resistance.
Forward outlook
- Local home prices are declining (-3.0%/yr); year-one equity from $173 of loan paydown is wiped out by about $750 of value loss. Plan a longer hold.
- Lee County population projected at +44% by 2050 — long-run rental-demand tailwind backs the buy-and-hold thesis.
- At projected returns (-3.0% appreciation + 0.0% rent growth), your $7k cash investment doubles in ~1 year — after that, you're playing with house money.
Negotiation context
- It's been on market 274 days — a 12% lower offer ($22k) is reasonable based on typical stale-listing flexibility.
Questions for the listing agent
- It's been on market 274 days. Have you received any prior offers? Is the seller open to a 12% concession, seller financing, or rate buy-down credit?
- Why hasn't it sold? Are there any deal-killer items the seller is aware of (foundation, flood, title, zoning, code violations)?
- Is there a deadline driving the sale (1031 exchange, divorce, estate, relocation)? That informs how much negotiation room exists.
- The area grade is low — what's the realistic commute time and amenity access for the typical tenant pool here? Any planned neighborhood developments (good or bad) we should know about?
- What's the average days-on-market for RENTAL listings here right now (not sales)? A rising rental-DOM trend means longer vacancies and softer asking-rent achievability than the comps imply.
- What's the recent tenant-quality profile in this submarket — average credit score on applications, eviction rate, late-payment / NSF rate, and stable-employment percentage? A property-management company in the area should have these aggregated.
- How much new for-sale + rental construction is in the pipeline within 1–3 miles? Heavy new supply typically softens prices + rents 12–24 months out; constrained supply supports both.
Investment metrics
- 1% rule
- 7.61% ✓
- Cap rate
- 70.16%
- Cash-on-cash
- 228.09%
- DSCR
- 11.15
- GRM
- 1.1
CMA / ARV
- ARV (on-the-fly)
- $292,800
- Comps found
- 4
Show comp detail 4 sales within ~0.75 mi
| Address | Dist | Beds/Ba | Sqft | Sold | Price | $/sf | Match |
|---|---|---|---|---|---|---|---|
| 57 Cardinal Dr | 0.32mi | 2/1.5 | 1,200 (0%) | 3mo | $135,000 | $113 | 80 |
| 150 Brooks Rd | 0.50mi | 2/2.0 | 1,160 (-3%) | 0mo | $159,900 | $138 | 71 |
| 1329 Sunrise Dr | 0.65mi | 3/2.0 (+1) | 1,248 (+4%) | 23mo | $305,000 | $244 | 39 |
| 400 E North Shore Dr | 0.74mi | 3/2.0 (+1) | 1,282 (+7%) | 13mo | $340,000 | $265 | 38 |
Match score weights: distance 35% · size 25% · config 20% · recency 20%. Top-matched comps best support the ARV.
Projected returns pro-forma
-3.0% appreciation · 0.0% rent growth · sell at horizon
- IRR
- —
- Equity multiple
- 11.73×
- Total profit
- $75,143
- Equity at exit
- $3,728
- IRR
- —
- Equity multiple
- 22.87×
- Total profit
- $153,117
- Equity at exit
- $2,162
Cash invested: $7,000 (down + closing). Projections, not guarantees.
Landlord ↔ Tenant lean methodology
- Overall (STATE)
- 87 Strongly Landlord-Friendly
- State Florida
- 87 Strongly Landlord-Friendly · R+3
- County
- — inherits STATE
- City
- — inherits STATE
ZIP-level market 33903
- Rents YoY
- -1.9%
- Active inventory
- 472
- Price-to-rent
- 1.1×
Monthly cashflow live
- Estimated rent
- $1,903 high interval (Pro) →
- Mortgage (P&I)
- −$131
- Tax est. 1.5%
- −$31 /mo · $375/yr
- Insurance
- −$10
- HOA
- −$0
- Vacancy / Maint / Mgmt
- −$400
- Net cashflow
- $1,331
Break-even live
UW: 25.0% down · 7.5% · 30yr · 1.5% tax · 5.0% vac · 8.0% maint · 8.0% mgmt
Financing live
Cash to close
- Down payment
- $6,250
- Closing costs
- $750
- Reserves months
- —
- Total cash needed
- —
Loan-product check · same deal, 3 products live
Conventional
25% down · 7.5% · 30yr
- Down + closing
- —
- Monthly P&I
- —
- Monthly cashflow
- —
- DSCR
- —
- Eligible?
- —
Personal DTI + credit; lowest rate.
DSCR
20% down · 8.5% · 30yr
- Down + closing
- —
- Monthly P&I
- —
- Monthly cashflow
- —
- DSCR
- —
- Eligible?
- —
No personal income docs; deal must DSCR.
Hard money
10% down · 12.0% · 12mo
- Down + closing
- —
- Monthly P&I
- —
- Monthly cashflow
- —
- DSCR
- —
- Eligible?
- —
Short-term bridge; refi at stabilization.
Rent comps 40 comps
| Address | Beds | Baths | Sqft | Rent | $/sqft | DOM | Units | Dist |
|---|---|---|---|---|---|---|---|---|
| 92 Oak St North Fort Myers, FL | 2.0 | 2.0 | 1008 | $2,000 | $1.98 | 3d | 1 | 0.35mi |
| 1526 Wood Rd North Fort Myers, FL | 1.0 | 1.0 | 912 | $1,500 | $1.64 | 3d | 1 | 0.42mi |
| 21 Crescent Lake Dr Unit 21 North Fort Myers, FL | 2.0 | 1.0 | 900 | $1,550 | $1.72 | 23d | 1 | 0.42mi |
| 8049 Stillwater Ct North Fort Myers, FL | 1.0–2.0 | 1.0–2.0 | 720 | $1,600 | $2.22 | 23d | 1 | 0.63mi |
| 112 Crescent Lake Dr North Fort Myers, FL | 2.0 | 1.0 | 980 | $1,700 | $1.73 | 23d | 1 | 0.65mi |
| 1201 Betmar Blvd North Fort Myers, FL | 3.0 | 2.0 | 1380 | $2,200 | $1.59 | 3d | 1 | 0.67mi |
| 69 E Mariana Ave Unit B North Fort Myers, FL | 3.0 | 1.0 | 1000 | $1,795 | $1.79 | 3d | 1 | 0.68mi |
| 1398 Evalena Ln North Fort Myers, FL | 3.0 | 2.0 | 1479 | $1,849 | $1.25 | 2d | 1 | 0.68mi |
| 3345 N Key Dr #47 North Fort Myers, FL | 2.0 | 2.5 | 1112 | $2,150 | $1.93 | 23d | 1 | 0.69mi |
| 3392 N Key Dr North Fort Myers, FL | 2.0 | 2.0 | 1270 | $1,850 | $1.46 | 21d | 1 | 0.69mi |
| 3392 N Key Dr Unit B7 North Fort Myers, FL | 2.0 | 2.0 | 1200 | $1,895 | $1.58 | 10d | 1 | 0.69mi |
| 3324 N Key Dr #7 North Fort Myers, FL | 2.0 | 1.0 | 791 | $1,495 | $1.89 | 23d | 1 | 0.73mi |
| 3342 N Key Dr Unit L3 North Fort Myers, FL | 2.0 | 1.0 | 791 | $1,490 | $1.88 | 23d | 1 | 0.74mi |
| 3300 N Key Dr Unit 4W North Fort Myers, FL | 2.0 | 2.0 | 1103 | $3,000 | $2.72 | 23d | 1 | 0.75mi |
| 3328 N Key Dr #5 North Fort Myers, FL | 2.0 | 1.0 | 791 | $1,400 | $1.77 | 23d | 1 | 0.75mi |
| 3328 N Key Dr North Fort Myers, FL | 2.0 | 1.0 | 800 | $1,400 | $1.75 | 3d | 1 | 0.76mi |
| 3350 N Key Dr #713 North Fort Myers, FL | 3.0 | 2.0 | 1207 | $2,250 | $1.86 | 3d | 1 | 0.79mi |
| 3350 N Key Dr Unit B911 North Fort Myers, FL | 3.0 | 2.0 | 1283 | $3,800 | $2.96 | 23d | 1 | 0.79mi |
| 3392 N Key Dr #7 North Fort Myers, FL | 2.0 | 2.0 | 1200 | $1,895 | $1.58 | 23d | 1 | 0.82mi |
| 3462 Hancock Bridge Pkwy #242 North Fort Myers, FL | 2.0 | 2.0 | 1152 | $1,750 | $1.52 | 23d | 1 | 0.84mi |
| 3460 N Key Dr #203 North Fort Myers, FL | 1.0 | 1.5 | 840 | $3,250 | $3.87 | 23d | 1 | 0.86mi |
| 3460 N Key Dr #210 North Fort Myers, FL | 2.0 | 2.0 | 1412 | $1,795 | $1.27 | 14d | 1 | 0.86mi |
| 3460 N Key Dr #311 North Fort Myers, FL | 2.0 | 2.0 | 1412 | $3,200 | $2.27 | 23d | 1 | 0.86mi |
| 3460 N Key Dr Fort Myers, FL | 2.0 | 2.0 | 1412 | $1,800 | $1.27 | 23d | 1 | 0.87mi |
| 3460 N Key Dr Fort Myers, FL | 2.0 | 2.0 | 1440 | $1,800 | $1.25 | 16d | 1 | 0.87mi |
| 3490 N Key Dr #514 North Fort Myers, FL | 2.0 | 2.0 | 1103 | $1,495 | $1.36 | 23d | 1 | 0.90mi |
| 3490 N Key Dr #203 North Fort Myers, FL | 1.0 | 1.5 | 840 | $1,300 | $1.55 | 23d | 1 | 0.90mi |
| 3490 N Key Dr #211 North Fort Myers, FL | 2.0 | 2.0 | 1412 | $1,550 | $1.10 | 23d | 1 | 0.90mi |
| 3490 N Key Dr #511 North Fort Myers, FL | 2.0 | 2.0 | 1412 | $1,650 | $1.17 | 23d | 1 | 0.90mi |
| 3490 N Key Dr #410 North Fort Myers, FL | 2.0 | 2.0 | 1412 | $3,900 | $2.76 | 23d | 1 | 0.90mi |
| 1275 Gramac Dr North Fort Myers, FL | 3.0 | 2.0 | 1013 | $1,550 | $1.53 | 3d | 1 | 0.95mi |
| 1275 Gramac Dr North Fort Myers, FL | 3.0 | 2.0 | 1013 | $1,575 | $1.55 | 23d | 1 | 0.95mi |
| 1310 Thompson St North Fort Myers, FL | 3.0 | 3.0 | 1387 | $2,800 | $2.02 | 23d | 1 | 1.04mi |
| 1260 Joerin Ave North Fort Myers, FL | 1.0 | 1.0 | 936 | $1,105 | $1.18 | 23d | 1 | 1.08mi |
| 1288 Waite Dr North Fort Myers, FL | 2.0 | 2.0 | 972 | $2,200 | $2.26 | 23d | 1 | 1.12mi |
| 257 Poe Ave North Fort Myers, FL | 2.0 | 1.0 | 870 | $1,175 | $1.35 | 3d | 1 | 1.17mi |
| 1846 Powell Dr Unit 28 North Fort Myers, FL | 1.0 | 1.0 | 850 | $1,500 | $1.76 | 3d | 1 | 1.18mi |
| 1056 Old Bridge Rd North Fort Myers, FL | 2.0 | 1.0 | 1100 | $1,350 | $1.23 | 23d | 1 | 1.22mi |
| 1195 Green Ave North Fort Myers, FL | 3.0 | 2.0 | 1250 | $1,850 | $1.48 | 23d | 1 | 1.23mi |
| 446 San Bernardino St North Fort Myers, FL | 2.0 | 1.0 | 1104 | $1,590 | $1.44 | 10d | 1 | 1.29mi |
Listing history 10 events
-
2026-06-17days on market $25,000 Active 274 DOM
-
2026-06-16days on market $25,000 Active 273 DOM
-
2026-06-16days on market $25,000 Active 272 DOM
-
2026-06-13days on market $25,000 Active 270 DOM
-
2026-06-09days on market $25,000 Active 266 DOM
-
2026-06-07days on market $25,000 Active 264 DOM
-
2026-06-01days on market $25,000 Active 258 DOM
-
2026-06-01days on market $25,000 Active 257 DOM
-
2025-09-24price $25,000
-
2025-09-16$35,000 Active
ⓘ Source: listings_history table (triggers on properties + properties_extension) + one-shot
backfill from property_details.listing_events for pre-trigger history.
Nearby sold comps map
Loading sold comps map…
Walkable amenities ~0.75 mi
Loading nearby amenities…
Taxation est. · year 1
- Rental income
- $22,835
- − Mortgage interest
- −$1,400
- − Property taxes
- −$375
- − Insurance
- −$125
- − Repairs & maintenance
- −$1,827
- − Management
- −$1,827
- − Depreciation
- −$727
- Taxable income
- $16,554
- Est. tax owed @ 24.0%
- −$3,973
- After-tax cash flow
- $11,993/yr
For passive investors: Depreciation is non-cash, so a rental often shows a tax loss while cash-flowing — sheltering income. Rental losses are passive: they offset passive income freely, and up to $25,000/yr can offset ordinary (W-2) income if you actively participate and your MAGI is under $100k (phasing out to $0 by $150k); unused losses carry forward. On sale, claimed depreciation is recaptured at up to 25%, and gains may owe capital-gains tax (a 1031 exchange can defer both). Figures are a year-1 estimate at your 24.0% rate — not tax advice; consult a CPA.
Schools (NCES district)
- District
- Lee
- NCES district ID
- 1201080
- Math proficiency
- 47% ▼ -11.00%
- Reading proficiency
- 50% ▼ -4.00%
- Median HH income
- $49,518
- Composite
- 41.49/100
- National rank
- #3458
- State rank
- #42 of 73 in FL
Livability — North Fort Myers
- Score
- 74/100
- State rank
- #269
- US rank
- #4409
Category grades
Schools grade is shown separately in the Schools card above.
Census & demographics
- Census place
- North Fort Myers, FL
- County
- Lee County · 788,662 people
- City population
- 57,035
- Metro
- Cape Coral-Fort Myers, FL
- Population (ZIP)
- 23,655
- Household income
- $56,993
- Rent vs Own
- Severe rent burden
- 468.0
Population outlook (Lee County) Hauer SSP2
- Today (2025)
- 871,946 people
- By 2030
- 955,468 · +9.6%
- By 2040
- 1,113,587 · +27.7%
- By 2050
- 1,256,891 · +44.1%
- By 2075
- 1,560,270 · +78.9%
- By 2100
- 1,726,848 · +98.0%
Race, ethnicity, and origin ACS 2023
- Neighborhood character
- Predominantly White (81%)
- Race & ethnicity
- White 81% Hispanic / Latino 14% Two or more races 8% Black 2%
- Hispanic origin (detail)
- Mexican 3% Puerto Rican 3% Cuban 3%
- Common ancestry
- Lithuanian 4% Romanian 4% Italian 3%
- Foreign-born
- 11% · Canada
- Languages at home
- 88% English-only · Spanish 9% Other Indo-European 1%
Political lean MEDSL · Lee
- 2024 margin
- Strong R (+28.4) · D 35.5% · R 63.9%
- 2008→2024 swing
- -18.0pp toward R · 2008: -10.4pp · 2024: -28.4pp
- All cycles
- 2024: R+28.4 2020: R+19.2 2016: R+20.4 2012: R+16.6 2008: R+10.4
Not yet ingested
- Civics
- —
Market trends
- HPI YoY
- ▼ -172.26%
- Current HPI
- 256.773
- Rent YoY
- ▼ -1.94%
- Metro
- Cape Coral-Fort Myers, FL
- State GDP YoY
- ▲ 3.28%
- F500 in state
- 36
Industry mix (Fortune 500 HQ in FL)
| Industry | F500 HQs | Revenue |
|---|---|---|
| Industrial Technology | 2 | $29B |
|
||
| Insurance | 2 | $17B |
|
||
| Retail | 1 | $60B |
|
||
| Technology Distribution | 1 | $58B |
|
||
| Homebuilding | 1 | $35B |
|
||
| Technology Manufacturing | 1 | $35B |
|
||
Price history
-28.6% since first listed2 events — show timeline
- 2025-09-24 Price Changed $25,000 ForSaleByOwner.com
- 2025-09-16 Listed $35,000 ForSaleByOwner.com
Cash-flow waterfall
monthlySold comps — $/sqft
last 12 mo · ≤1 miLoading sold comps…