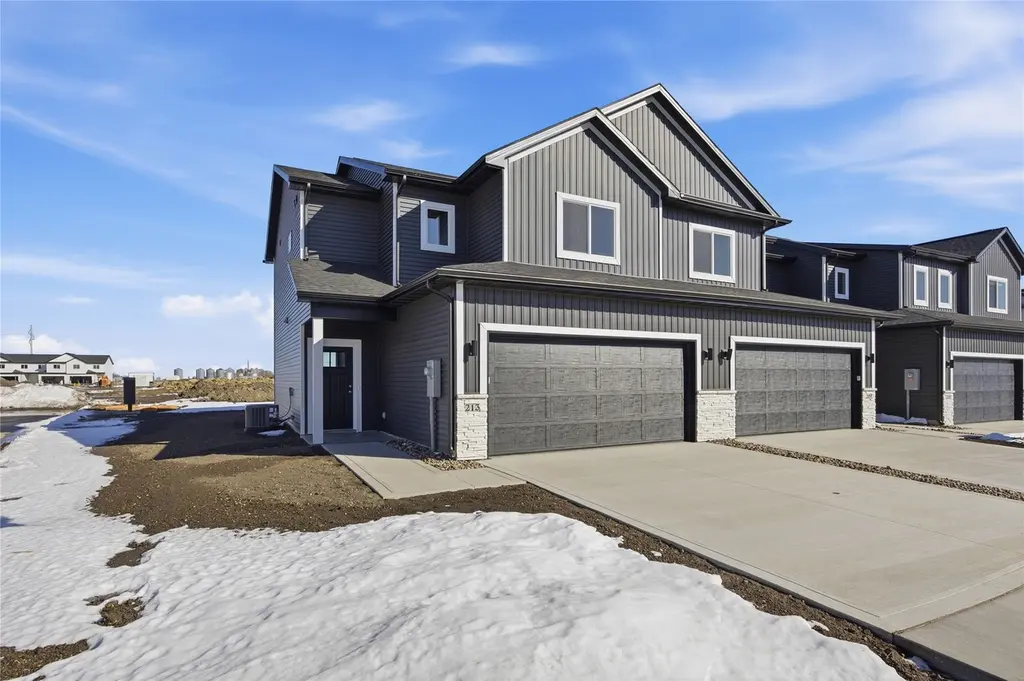
213 NE Doe Pointe Ln · Ankeny, IA
Flood risk No data
- FEMA flood zone
- —
- Chance of flooding over 30 yrs
- —
- Est. flood insurance / yr
- —
Fire risk No data
- Est. fire insurance / yr
- —
Heat risk No data
- Hot days now (above threshold)
- —
- Hot days in 30 yrs
- —
Wind risk No data
- Chance of severe wind over 30 yrs
- —
Air-quality risk No data
- Unhealthy air days now
- —
- Unhealthy air days in 30 yrs
- —
Risk factors via First Street. Map © Google.
Why this score? — see what drove the D grade
The composite is a weighted blend of 9 inputs, each scored 0–100. Each bar is that input's sub-score; the figure is the points it added to the 100-point composite (weight × sub-score).
- ARV discount +13.7/15.0
- Cash flow +7.1/30.0
- Schools +7.1/10.0
- Livability +4.6/5.0
- Rent growth +2.7/5.0
- 1% rule +2.6/10.0
- Condition / age +2.5/5.0
- DSCR +1.3/10.0
- Appreciation +0.0/10.0
$269,900
🖨 Deal sheet (PDF) 📄 Offer letter ✓ Due diligence
Listing remarks MLS
Proud to present Destiny Homes new townhome floor plan the Hyperion! These are nestled in Ankeny First Street Commons community on the East side of Ankeny. Featuring 3 bedrooms, 2.5 baths with over 1500 sqft of finished living space with 9-foot ceilings! These open floor plans have tons of natural light with large windows in the great room. Laundry is conveniently located upstairs with all of the bedrooms! Other additional features include a passive radon system, two-year builder warranty, and all appliances included. Ask about our $2,000 in closing cost savings when you use our preferred lender! Discover easy living in the heart of Ankeny-schedule your tour today! All information obtained from seller and public records.
Key facts
- $150 HOA
- 2 garage spots
- Built 2025
Neighborhood map
What this means for you Summary
Snapshot
- This is a 3-bed/2.5-bath other listed at $270k.
Deal economics
- At list price, monthly cash flow is $-386 ($-5k/yr) — negative.
- To cash-flow at today's rent, offer at most $214k (20.7% below list).
- To meet the 1% rule (rent ≥ 1% of price), the offer needs to be $206k (23.6% below list).
- Recommended offer: $206k (23.6% below list) — sets the bar for 1% rule.
- Cap rate 4.6% vs local median 3.0% in Ankeny — top-decile yield for the area; either an underpriced asset or a hidden risk that comps aren't pricing in. Stress-test before assuming the spread holds.
Location & tenants
- Location reads 92/100 on livability (#3 in IA, #29 nationally) — a professional / high-income tenant draw. Strengths: amenities A+, employment A+, housing A+; Watch: commute C-.
- Ankeny Community School District (suburban): math 80% / reading 82% proficiency, ranked #15 of 289 in IA (top 5%) — strong family-tenant draw, lease renewals of 3-5y typical; only 10% free/reduced lunch — higher-income household profile.
- Zoned schools: East Elementary School (math 62% / reading 62%, grade B, #363 of 616 statewide, top 62%, 413 students, 37% FRL); Parkview Middle School (math 76% / reading 83%, grade A+, #35 of 246 statewide, top 16%, 867 students, 23% FRL); Ankeny High School (math 77% / reading 84%, grade A, #30 of 336 statewide, top 9%, 1,347 students, 20% FRL) — zoned schools average 26% FRL vs 10% district-wide (16 pts higher); higher-poverty schools than district average — tighter screening recommended.
- Market conditions: Rents flat; 712 active listings in the ZIP; 4 comparable units currently listed for rent nearby; rentals lingering (median 46d on market — plan ~5-8 weeks vacancy on turnover, expect pricing pressure); 50% of comp listings sitting > 30 days — soft ceiling on asking rent; solid renter incomes; 2,953 units permitted in Polk County in 2024 (540 in 5+ unit buildings).
Forward outlook
- Local home prices are declining (-3.0%/yr); year-one equity from $2k of loan paydown is wiped out by about $8k of value loss. Plan a longer hold.
- Polk County population projected at +37% by 2050 — long-run rental-demand tailwind backs the buy-and-hold thesis.
Negotiation context
- It's been on market 199 days — a 12% lower offer ($238k) is reasonable based on typical stale-listing flexibility.
Questions for the listing agent
- What do current leases actually rent for vs. the listed asking? Can we see a recent rent roll and the last 12 months of T-12 income?
- It's been on market 199 days. Have you received any prior offers? Is the seller open to a 24% concession, seller financing, or rate buy-down credit?
- What does the HOA fee cover, when was the last increase, and are there any pending special assessments or reserve-fund shortfalls?
- Why hasn't it sold? Are there any deal-killer items the seller is aware of (foundation, flood, title, zoning, code violations)?
- Is there a deadline driving the sale (1031 exchange, divorce, estate, relocation)? That informs how much negotiation room exists.
- Schools are A-rated — typically a magnet for longer-tenancy family renters. What's the average tenant stay here, and is there a school-zone premium baked into asking?
- The area grade is low — what's the realistic commute time and amenity access for the typical tenant pool here? Any planned neighborhood developments (good or bad) we should know about?
- What's the average days-on-market for RENTAL listings here right now (not sales)? A rising rental-DOM trend means longer vacancies and softer asking-rent achievability than the comps imply.
- What's the recent tenant-quality profile in this submarket — average credit score on applications, eviction rate, late-payment / NSF rate, and stable-employment percentage? A property-management company in the area should have these aggregated.
- How much new for-sale + rental construction is in the pipeline within 1–3 miles? Heavy new supply typically softens prices + rents 12–24 months out; constrained supply supports both.
Investment metrics
- 1% rule
- 0.76% ✗
- Cap rate
- 4.58%
- Cash-on-cash
- -6.13%
- DSCR
- 0.73
- GRM
- 10.9
CMA / ARV
- ARV (median comp)
- $313,259
- List price
- $269,900
- Delta
- -13.84%
- Verdict
- UNDERPRICED
- Comps
- 20 within 1.0 mi
Projected returns pro-forma
-3.0% appreciation · 0.92% rent growth · sell at horizon
- IRR
- -29.3%
- Equity multiple
- 0.04×
- Total profit
- $-72,422
- Equity at exit
- $40,243
- IRR
- -42.3%
- Equity multiple
- -0.47×
- Total profit
- $-110,857
- Equity at exit
- $23,336
Cash invested: $75,572 (down + closing). Projections, not guarantees.
Landlord ↔ Tenant lean methodology
- Overall (STATE)
- 83 Strongly Landlord-Friendly
- State Iowa
- 83 Strongly Landlord-Friendly · R+6
- County
- — inherits STATE
- City
- — inherits STATE
ZIP-level market 50021
- Rents YoY
- 0.9%
- Active inventory
- 712
- Price-to-rent
- 10.9×
Monthly cashflow live
- Estimated rent
- $2,062 medium interval (Pro) →
- Mortgage (P&I)
- −$1,415
- Tax est. 1.5%
- −$337 /mo · $4,048/yr
- Insurance
- −$112
- HOA
- −$150
- Vacancy / Maint / Mgmt
- −$433
- Net cashflow
- $-386
Break-even live
Sensitivity live
| Price | -10% $-199 | -5% $-293 | +0% $-386 | +5% $-479 | +10% $-572 |
|---|---|---|---|---|---|
| Rent | -10% $-549 | -5% $-467 | +0% $-386 | +5% $-304 | +10% $-223 |
| Rate | -1.0pp $-250 | -0.5pp $-317 | base $-386 | +0.5pp $-456 | +1.0pp $-527 |
UW: 25.0% down · 7.5% · 30yr · 1.5% tax · 5.0% vac · 8.0% maint · 8.0% mgmt
Financing live
Cash to close
- Down payment
- $67,475
- Closing costs
- $8,097
- Reserves months
- —
- Total cash needed
- —
Loan-product check · same deal, 3 products live
Conventional
25% down · 7.5% · 30yr
- Down + closing
- —
- Monthly P&I
- —
- Monthly cashflow
- —
- DSCR
- —
- Eligible?
- —
Personal DTI + credit; lowest rate.
DSCR
20% down · 8.5% · 30yr
- Down + closing
- —
- Monthly P&I
- —
- Monthly cashflow
- —
- DSCR
- —
- Eligible?
- —
No personal income docs; deal must DSCR.
Hard money
10% down · 12.0% · 12mo
- Down + closing
- —
- Monthly P&I
- —
- Monthly cashflow
- —
- DSCR
- —
- Eligible?
- —
Short-term bridge; refi at stabilization.
Rent comps 4 comps
| Address | Beds | Baths | Sqft | Rent | $/sqft | DOM | Units | Dist |
|---|---|---|---|---|---|---|---|---|
| 221 NE Crossing Oaks Dr Ankeny, IA | 4.0 | 2.5 | 1709 | $2,195 | $1.28 | 16d | 1 | 0.11mi |
| 604 NE Pearl Dr Ankeny, IA | 3.0 | 2.0 | 1464 | $2,395 | $1.64 | 45d | 1 | 0.35mi |
| 4342 NE Spear Ln Unit 4342 Ankeny, IA | 3.0 | 2.5 | 1511 | $1,850 | $1.22 | 45d | 1 | 0.51mi |
| 4311 NE 16th St Ankeny, IA | 4.0 | 2.5 | 1762 | $2,395 | $1.36 | 16d | 1 | 0.75mi |
HOA detail
- Monthly dues
- $150 · $1,800/yr
Listing history 18 events
-
2026-06-21days on market $269,900 Active 199 DOM
-
2026-06-18days on market $269,900 Active 196 DOM
-
2026-06-17days on market $269,900 Active 195 DOM
-
2026-06-16days on market $269,900 Active 194 DOM
-
2026-06-15days on market $269,900 Active 193 DOM
-
2026-06-14days on market $269,900 Active 191 DOM
-
2026-06-13days on market $269,900 Active 190 DOM
-
2026-06-10days on market $269,900 Active 188 DOM
-
2026-06-09days on market $269,900 Active 187 DOM
-
2026-06-08days on market $269,900 Active 186 DOM
-
2026-06-07days on market $269,900 Active 185 DOM
-
2026-06-03days on market $269,900 Active 181 DOM
-
2026-06-02days on market $269,900 Active 180 DOM
-
2026-06-01days on market $269,900 Active 179 DOM
-
2026-05-31days on market $269,900 Active 178 DOM
-
2026-05-31days on market $269,900 Active 177 DOM
-
2025-12-03$269,900 Active 731-char remark
Show marketing remark (731 chars)
Proud to present Destiny Homes new townhome floor plan the Hyperion! These are nestled in Ankeny First Street Commons community on the East side of Ankeny. Featuring 3 bedrooms, 2.5 baths with over 1500 sqft of finished living space with 9-foot ceilings! These open floor plans have tons of natural light with large windows in the great room. Laundry is conveniently located upstairs with all of the bedrooms! Other additional features include a passive radon system, two-year builder warranty, and all appliances included. Ask about our $2,000 in closing cost savings when you use our preferred lender! Discover easy living in the heart of Ankeny-schedule your tour today! All information obtained from seller and public records.
-
2024-09-11soldstatus $336,000
ⓘ Source: listings_history table (triggers on properties + properties_extension) + one-shot
backfill from property_details.listing_events for pre-trigger history.
Nearby sold comps map
Loading sold comps map…
Walkable amenities ~0.75 mi
Loading nearby amenities…
Taxation est. · year 1
- Rental income
- $24,748
- − Mortgage interest
- −$15,119
- − Property taxes
- −$4,048
- − Insurance
- −$1,350
- − Repairs & maintenance
- −$1,980
- − Management
- −$1,980
- − HOA
- −$1,800
- − Depreciation
- −$7,852
- Taxable loss
- −$9,380
- Est. tax savings @ 24.0%
- +$2,251
- After-tax cash flow
- $-2,380/yr
For passive investors: Depreciation is non-cash, so a rental often shows a tax loss while cash-flowing — sheltering income. Rental losses are passive: they offset passive income freely, and up to $25,000/yr can offset ordinary (W-2) income if you actively participate and your MAGI is under $100k (phasing out to $0 by $150k); unused losses carry forward. On sale, claimed depreciation is recaptured at up to 25%, and gains may owe capital-gains tax (a 1031 exchange can defer both). Figures are a year-1 estimate at your 24.0% rate — not tax advice; consult a CPA.
Schools (NCES district)
- District
- Ankeny Community School District
- NCES district ID
- 1903690
- Math proficiency
- 80% ▼ -5.00%
- Reading proficiency
- 82% ▬ 0.00%
- Median HH income
- $75,384
- Composite
- 70.91/100
- National rank
- #246
- State rank
- #15 of 289 in IA
Livability — Ankeny
- Score
- 92/100
- State rank
- #3
- US rank
- #29
Category grades
Schools grade is shown separately in the Schools card above.
Census & demographics
- Census place
- Ankeny, IA
- County
- Polk County · 453,298 people
- City population
- 76,589
- Metro
- Des Moines-West Des Moines, IA
- Population (ZIP)
- 30,283
- Household income
- $99,572
- Rent vs Own
- Severe rent burden
- 472.0
Population outlook (Polk County) Hauer SSP2
- Today (2025)
- 548,042 people
- By 2030
- 588,557 · +7.4%
- By 2040
- 670,629 · +22.4%
- By 2050
- 752,830 · +37.4%
- By 2075
- 955,069 · +74.3%
- By 2100
- 1,115,436 · +103.5%
Race, ethnicity, and origin ACS 2023
- Neighborhood character
- Predominantly White (84%)
- Race & ethnicity
- White 84% Hispanic / Latino 6% Black 5% Two or more races 4% Asian 3%
- Hispanic origin (detail)
- Mexican 5%
- Common ancestry
- Italian 5% Portuguese 4% Iranian 3%
- Foreign-born
- 6% · Canada, South Korea, Jamaica
- Languages at home
- 91% English-only · Spanish 5% Russian/Polish/Slavic 1% Other Asian/Pacific 1%
Political lean MEDSL · Polk
- 2024 margin
- D (+10.9) · D 54.8% · R 43.9% · Other 1.3%
- 2008→2024 swing
- -3.7pp toward R · 2008: 14.6pp · 2024: 10.9pp
- All cycles
- 2024: D+10.9 2020: D+15.2 2016: D+11.5 2012: D+14.2 2008: D+14.6
Not yet ingested
- Civics
- —
Market trends
- HPI YoY
- ▼ -150.38%
- Current HPI
- 208.945
- Rent YoY
- ▲ 0.92%
- Metro
- Des Moines-West Des Moines, IA
- State GDP YoY
- ▲ 2.48%
- F500 in state
- 4
Industry mix (Fortune 500 HQ in IA)
| Industry | F500 HQs | Revenue |
|---|---|---|
| Financial Services | 1 | $16B |
|
||
| Retail / Convenience | 1 | $15B |
|
||
Price history
-19.7% since first listed2 events — show timeline
- 2025-12-03 Listed $269,900 DMMLS
- 2024-09-11 Sold (Public Records) $336,000 Public Records
Cash-flow waterfall
monthlySold comps — $/sqft
last 12 mo · ≤1 miLoading sold comps…