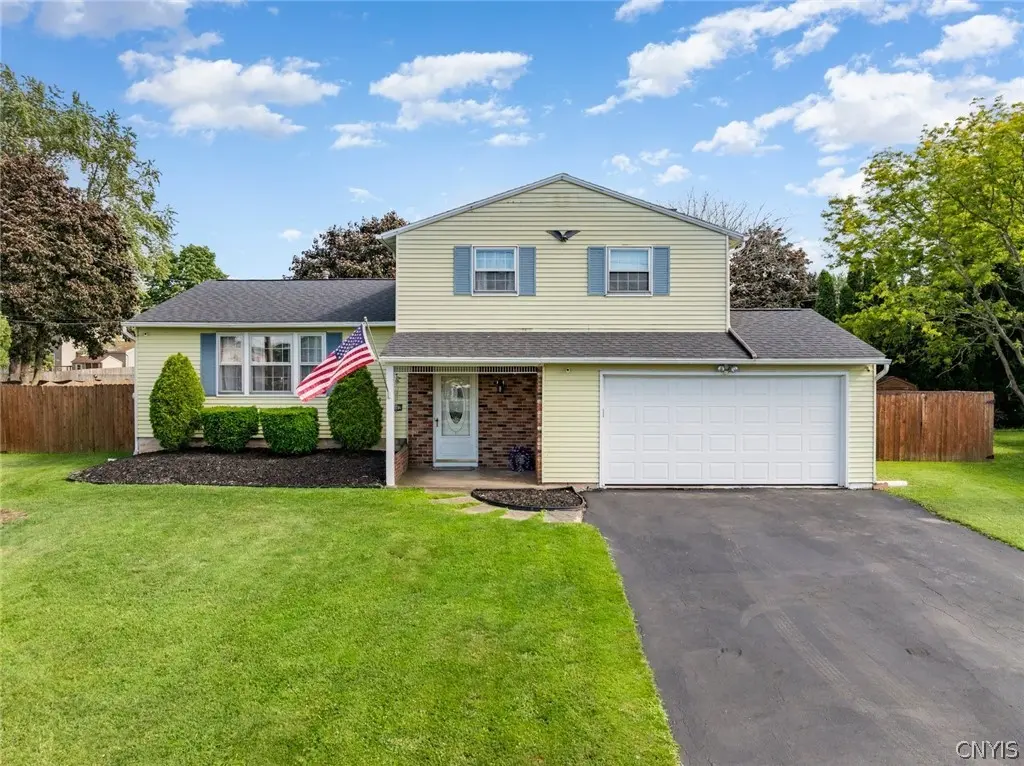
4362 Millwood Cir · Liverpool, NY
Flood risk 1/10 · Minimal
- FEMA flood zone
- X (unshaded)
- Chance of flooding over 30 yrs
- 0.0%
- Est. flood insurance / yr
- $473 – $860
Fire risk 2/10 · Minimal
- Est. fire insurance / yr
- $691 – $1,283
Heat risk 3/10 · Minor
- Hot days now (above 95°F)
- 7 days/yr
- Hot days in 30 yrs
- 16 days/yr
Wind risk 1/10 · Minimal
- Chance of severe wind over 30 yrs
- 0.0%
Air-quality risk 2/10 · Minimal
- Unhealthy air days now
- 0 days/yr
- Unhealthy air days in 30 yrs
- 1 days/yr
Risk factors via First Street. Map © Google.
Why this score? — see what drove the D- grade
The composite is a weighted blend of 9 inputs, each scored 0–100. Each bar is that input's sub-score; the figure is the points it added to the 100-point composite (weight × sub-score).
- Cash flow +9.9/30.0
- ARV discount +5.8/15.0
- Schools +4.3/10.0
- Livability +4.3/5.0
- 1% rule +3.7/10.0
- DSCR +2.8/10.0
- Rent growth +2.5/5.0
- Condition / age +2.5/5.0
- Appreciation +0.0/10.0
$299,500
🖨 Deal sheet 📄 Offer letter ✓ Due diligence
Listing remarks MLS
Spacious open split "ready to go" featuring updated main & 1/2 bath, newer furnace, hotwater heater, appliances, bedroom carpeting, kitchen flooring & a list of additional improvements! Eat in kitchen open to family room w/ brick wall faced wood fireplace, double wide patio door to patio & nice size fenced yard w/ pool & shed. Interior offers formal dining rm off kitchen, open living rm to front entry foyer, 3 upper spacious bdrms & full remodeled bath & main level 1/2 bath, lower level finished basement, 2 car garage, front entry covered porch & more, located on low traffic neck of cul de sac!
Key facts
- Quiet cul-de-sac
- Updated half bath
- Split-level home
Tags
Property features AI
Exterior
- Parking: Attached garage with storage; Garage door opener; 2 garage spaces
- Utilities: Electricity connected (circuit breakers); Sewer connected; Spring water source; Cable available; High-speed internet available
- Home design: Two-story house; Resale property; Located on a cul-de-sac; Irregular residential lot; Faces a city street
- Construction: Aluminum siding and brick exterior; Architectural shingle roof; Block foundation; Copper plumbing; Built as an existing structure
- Exterior features: Blacktop driveway; Fully fenced yard; Above-ground pool; Patio; Open porch; Gazebo; Shed(s); Storage
Interior
- Kitchen: Electric cooktop; Free-standing range/oven; Range hood; Dishwasher; Disposal; Refrigerator; Exhaust fan
- Bedrooms: Total of 9 rooms (includes bedrooms and other living spaces)
- Flooring: Carpet; Laminate; Varies
- Bathrooms: One full bathroom; One half bathroom; One main-level bathroom
- Heating & cooling: Gas forced-air heating; Window cooling units
- Interior features: Separate/formal dining room; Entrance foyer; Eat-in kitchen; Separate/formal living room; Kitchen/family room combo; Living/dining room; Skylights; Thermal windows; Programmable thermostat
- Laundry & utility: Washer and dryer included; Laundry located in basement; Gas water heater
Neighborhood map
What this means for you Summary
Snapshot
- This is a 3-bed/1.5-bath single-family listed at $300k.
Deal economics
- At list price, monthly cash flow is $-186 ($-2k/yr) — negative.
- To cash-flow at today's rent, offer at most $267k (10.9% below list).
- To meet the 1% rule (rent ≥ 1% of price), the offer needs to be $261k (12.9% below list).
- Recommended offer: $261k (12.9% below list) — sets the bar for 1% rule.
Location & tenants
- Location reads 86/100 on livability (#16 in NY, #363 nationally) — a professional / high-income tenant draw. Strengths: commute A+, housing A+, health & safety A+.
- Liverpool Central School District (suburban): math 49% / reading 49% proficiency, ranked #381 of 590 in NY (top 65%) — families likely to look elsewhere, expect single-tenant / working-renter base with shorter leases.
- Market conditions: 96 active listings in the ZIP; 3 comparable units currently listed for rent nearby; rentals leasing fast (median 14d on market — plan ~1-2 weeks tenant-placement turnaround); solid renter incomes; 616 units permitted in Onondaga County in 2024 (256 in 5+ unit buildings).
- This rent runs 35% of the median local income ($88k/yr) — at the standard rent-burdened threshold; future hikes will face affordability resistance.
Forward outlook
- Local home prices are declining (-3.0%/yr); year-one equity from $2k of loan paydown is wiped out by about $9k of value loss. Plan a longer hold.
- Onondaga County population projected to shrink 9% by 2050 — rents likely to lag national; underwrite the cash flow, not the appreciation.
Negotiation context
- Only 1 days on market — expect competitive offers; lowballing is unlikely to land.
- 3 sale attempts since 11y ago with the ask held roughly flat each time — persistent listings suggest the price (not the market) is what's stuck; bring a comps-based counter.
- Current owner paid $131k; list at $300k implies a 129% gain — meaningful room to come down on a strong offer.
Questions for the listing agent
- What do current leases actually rent for vs. the listed asking? Can we see a recent rent roll and the last 12 months of T-12 income?
- Built in 1974 — when were the roof, HVAC, electrical panel, plumbing, and water heater last replaced?
- Is there a deadline driving the sale (1031 exchange, divorce, estate, relocation)? That informs how much negotiation room exists.
- The area grade is low — what's the realistic commute time and amenity access for the typical tenant pool here? Any planned neighborhood developments (good or bad) we should know about?
- What's the average days-on-market for RENTAL listings here right now (not sales)? A rising rental-DOM trend means longer vacancies and softer asking-rent achievability than the comps imply.
- What's the recent tenant-quality profile in this submarket — average credit score on applications, eviction rate, late-payment / NSF rate, and stable-employment percentage? A property-management company in the area should have these aggregated.
- How much new for-sale + rental construction is in the pipeline within 1–3 miles? Heavy new supply typically softens prices + rents 12–24 months out; constrained supply supports both.
Investment metrics
- 1% rule
- 0.87% ✗
- Cap rate
- 5.55%
- Cash-on-cash
- -2.66%
- DSCR
- 0.88
- GRM
- 9.6
CMA / ARV
- ARV (on-the-fly)
- $288,800
- Comps found
- 12
Show comp detail 12 sales within ~0.75 mi
| Address | Dist | Beds/Ba | Sqft | Sold | Price | $/sf | Match |
|---|---|---|---|---|---|---|---|
| 7878 Morgan Rd | 0.52mi | 3/1.5 | 1,536 (+1%) | 8mo | $300,000 | $195 | 67 |
| 17 Mango Ln | 0.43mi | 3/1.5 | 1,450 (-5%) | 7mo | $259,900 | $179 | 66 |
| 22 Tree Line Dr | 0.20mi | 4/1.5 (+1) | 1,656 (+9%) | 9mo | $301,000 | $182 | 63 |
| 4389 Wetzel Rd | 0.40mi | 4/1.5 (+1) | 1,416 (-7%) | 8mo | $257,500 | $182 | 58 |
| 3 Gooseberry Ln | 0.47mi | 4/2.5 (+1) | 1,561 (+3%) | 11mo | $340,000 | $218 | 56 |
| 119 Sagamore Dr S | 0.61mi | 3/1.5 | 1,616 (+6%) | 7mo | $298,625 | $185 | 56 |
| 210 Blackberry Rd | 0.64mi | 3/2.5 | 1,484 (-2%) | 8mo | $289,500 | $195 | 56 |
| 17 Dove | 0.66mi | 4/2.0 (+1) | 1,594 (+5%) | 5mo | $280,900 | $176 | 50 |
| 6 Quail Path | 0.56mi | 3/1.5 | 1,308 (-14%) | 6mo | $290,000 | $222 | 46 |
| 131 Sagamore Dr S | 0.60mi | 4/1.5 (+1) | 1,712 (+13%) | 1mo | $365,000 | $213 | 45 |
| 81 Bayberry Cir | 0.69mi | 3/1.5 | 1,342 (-12%) | 9mo | $255,000 | $190 | 41 |
| 4 Nightingale Path | 0.65mi | 4/2.5 (+1) | 1,700 (+12%) | 10mo | $308,000 | $181 | 33 |
Match score weights: distance 35% · size 25% · config 20% · recency 20%. Top-matched comps best support the ARV.
Projected returns pro-forma
-3.0% appreciation · 3.0% rent growth · sell at horizon
- IRR
- -20.7%
- Equity multiple
- 0.28×
- Total profit
- $-60,201
- Equity at exit
- $44,656
- IRR
- -13.8%
- Equity multiple
- 0.20×
- Total profit
- $-67,039
- Equity at exit
- $25,895
Cash invested: $83,860 (down + closing). Projections, not guarantees.
Landlord ↔ Tenant lean methodology
- Overall (STATE)
- 15 Strongly Tenant-Friendly
- State New York
- 15 Strongly Tenant-Friendly · D+10
- County
- — inherits STATE
- City
- — inherits STATE
ZIP-level market 13090
- Active inventory
- 96
- Price-to-rent
- 9.6×
Monthly cashflow live
- Estimated rent
- $2,608 medium interval (Pro) →
- Mortgage (P&I)
- −$1,571
- Tax from tax record
- −$551 /mo · $6,609/yr
- Insurance
- −$125
- HOA
- −$0
- Vacancy / Maint / Mgmt
- −$548
- Net cashflow
- $-186
Break-even live
UW: 25.0% down · 7.5% · 30yr · 1.5% tax · 5.0% vac · 8.0% maint · 8.0% mgmt
Financing live
Cash to close
- Down payment
- $74,875
- Closing costs
- $8,985
- Reserves months
- —
- Total cash needed
- —
Loan-product check · same deal, 3 products live
Conventional
25% down · 7.5% · 30yr
- Down + closing
- —
- Monthly P&I
- —
- Monthly cashflow
- —
- DSCR
- —
- Eligible?
- —
Personal DTI + credit; lowest rate.
DSCR
20% down · 8.5% · 30yr
- Down + closing
- —
- Monthly P&I
- —
- Monthly cashflow
- —
- DSCR
- —
- Eligible?
- —
No personal income docs; deal must DSCR.
Hard money
10% down · 12.0% · 12mo
- Down + closing
- —
- Monthly P&I
- —
- Monthly cashflow
- —
- DSCR
- —
- Eligible?
- —
Short-term bridge; refi at stabilization.
Rent comps 3 comps
| Address | Beds | Baths | Sqft | Rent | $/sqft | DOM | Units | Dist |
|---|---|---|---|---|---|---|---|---|
| 4071 Sesame Path Liverpool, NY | 4.0 | 2.5 | 1928 | $3,200 | $1.66 | 21d | 1 | 0.93mi |
| 1 Gallowgate Ct Liverpool, NY | 3.0 | 1.5 | 1585 | $1,698 | $1.07 | 13d | 1 | 1.00mi |
| 7648 Autumnal Ln Liverpool, NY | 3.0 | 1.5 | 1100 | $2,500 | $2.27 | 13d | 1 | 1.31mi |
Listing history 2 events
-
2026-06-18remarks 699-char remark
-
2026-06-18$299,500 Active 1 DOM
ⓘ Source: listings_history table (triggers on properties + properties_extension) + one-shot
backfill from property_details.listing_events for pre-trigger history.
Tax reassessment forecast NY · Partial reset (capped growth)
- Current annual tax
- $6,609 · $551/mo
- Projected year-2 tax
- $6,609 · $551/mo
- Expected delta
- $0/yr ($0/mo · 0.0%)
ⓘ Screening estimate from a state-policy table — verify with the county assessor before closing.
Climate risk First Street
- Flood 1/10 Low FEMA zone X (unshaded) · 0% chance over 30 yrs
- Wildfire 2/10 Low
- Heat 3/10 Moderate 7 d/yr ≥95°F today · 16 d/yr by 30 yrs out
- Wind 1/10 Low 0% chance of damaging wind over 30 yrs
- Air quality 2/10 Low 0 unhealthy d/yr today · 1 by 30 yrs out
Nearby sold comps map
Loading sold comps map…
Walkable amenities ~0.75 mi
Loading nearby amenities…
Taxation est. · year 1
- Rental income
- $31,300
- − Mortgage interest
- −$16,777
- − Property taxes
- −$6,609
- − Insurance
- −$1,498
- − Repairs & maintenance
- −$2,504
- − Management
- −$2,504
- − Depreciation
- −$8,713
- Taxable loss
- −$7,304
- Est. tax savings @ 24.0%
- +$1,753
- After-tax cash flow
- $-474/yr
For passive investors: Depreciation is non-cash, so a rental often shows a tax loss while cash-flowing — sheltering income. Rental losses are passive: they offset passive income freely, and up to $25,000/yr can offset ordinary (W-2) income if you actively participate and your MAGI is under $100k (phasing out to $0 by $150k); unused losses carry forward. On sale, claimed depreciation is recaptured at up to 25%, and gains may owe capital-gains tax (a 1031 exchange can defer both). Figures are a year-1 estimate at your 24.0% rate — not tax advice; consult a CPA.
Schools (NCES district)
- District
- Liverpool Central School District
- NCES district ID
- 3617520
- Math proficiency
- 49% ▼ -6.00%
- Reading proficiency
- 49% ▲ 1.00%
- Median HH income
- $59,134
- Composite
- 42.84/100
- National rank
- #3134
- State rank
- #381 of 590 in NY
Livability — Liverpool
- Score
- 86/100
- State rank
- #16
- US rank
- #363
Category grades
Schools grade is shown separately in the Schools card above.
Census & demographics
- County
- Onondaga County · 247,257 people
- City population
- 29,004
- Metro
- Syracuse, NY
- Population (ZIP)
- 29,004
- Household income
- $88,492
- Rent vs Own
- Severe rent burden
- 733.0
Population outlook (Onondaga County) Hauer SSP2
- Today (2025)
- 467,894 people
- By 2030
- 463,381 · -1.0%
- By 2040
- 447,697 · -4.3%
- By 2050
- 426,399 · -8.9%
- By 2075
- 373,661 · -20.1%
- By 2100
- 307,967 · -34.2%
Race, ethnicity, and origin ACS 2023
- Neighborhood character
- Predominantly White (79%)
- Race & ethnicity
- White 79% Two or more races 9% Hispanic / Latino 7% Black 6% Asian 3%
- Hispanic origin (detail)
- Mexican 1% Puerto Rican 4%
- Common ancestry
- Romanian 7% Lithuanian 4% Italian 2%
- Foreign-born
- 6% · Canada, China, South Korea
- Languages at home
- 93% English-only · Other Indo-European 2% Spanish 1% Russian/Polish/Slavic 1%
Political lean MEDSL · Onondaga
- 2024 margin
- D (+17.3) · D 58.6% · R 41.4%
- 2008→2024 swing
- -3.0pp toward R · 2008: 20.3pp · 2024: 17.3pp
- All cycles
- 2024: D+17.3 2020: D+20.6 2016: D+12.8 2012: D+21.1 2008: D+20.3
Not yet ingested
- Civics
- —
Market trends
- HPI YoY
- ▼ -228.53%
- Current HPI
- 320.4989
- Rent YoY
- —
- Metro
- Syracuse, NY
- State GDP YoY
- ▲ 2.60%
- F500 in state
- 92
Industry mix (Fortune 500 HQ in NY)
| Industry | F500 HQs | Revenue |
|---|---|---|
| Financial Services | 10 | $950B |
|
||
| Consumer Goods | 9 | $162B |
|
||
| Insurance | 4 | $225B |
|
||
| Telecommunications | 2 | $144B |
|
||
| Pharmaceuticals | 2 | $112B |
|
||
| Media / Entertainment | 2 | $69B |
|
||
Price history
+130.6% since first listed8 events — show timeline
- 2026-06-17 Listed $299,500 CNYIS
- 2016-02-19 Sold (Public Records) $131,000 Public Records
- 2016-02-16 Sold (MLS) $131,000 CNYIS
- 2015-12-01 Pending — CNYIS
- 2015-11-23 Contingent — CNYIS
- 2015-11-03 Relisted — CNYIS
- 2015-10-19 Contingent — CNYIS
- 2015-10-06 Listed $129,900 CNYIS
Property tax history
+1.4%/yrLatest (2025): $6,609 · +4.9% YoY. Source: county tax records.
Cash-flow waterfall
monthlySold comps — $/sqft
last 12 mo · ≤1 miLoading sold comps…